
Abstract
MRI and Monte Carlo simulated data of pulsed gradient spin echo experiments were used to study the effects of diffusion time, gradient strength and b-value on diffusion tensor (DT) metrics using real and simulated fixed rat spines. Radial (λ⊥) in grey matter and simulation data, axial (λ||) in both grey and white matter in fixed rat spinal cords and mean diffusivity in all tissues showed a significant decrease with diffusion time at b = 1 μm2/ms. All diffusivities significantly decreased with b-value at g = 116 mT/m and at Δeff = 23 ms. The fractional anisotropy (FA) significantly increased with diffusion time at b = 1 μm2/ms in the simulation data and grey matter. FA significantly increased in white matter and simulation data and significantly decreased in grey matter with b-value at g = 116 mT/m and at Δeff = 23 ms. These data suggest that DTI metrics are highly dependent on pulse sequence parameters.
Introduction
The advent of diffusion tensor (DT) magnetic resonance (MR) imaging has made a significant impact in the field of neuroimaging.1–9 Many different metrics can be calculated from DTI and can be used to infer information about the underlying microstructural features of the tissue in each voxel. Mean diffusivity (MD), fractional anisotropy (FA), and axial (λ||) and radial (λ⊥) diffusivities have been shown to change with disease, damage or dysfunction,9–13 as well as development5,14–19 and aging20,21 in the brain.
Signal from a diffusion pulse sequence, such as the Stejskal-Tanner pulsed gradient spin echo (PGSE) sequence, 22 is attenuated by a factor e-bADC, where ADC is the apparent diffusion coefficient of water in the voxel and b depends on the pulse sequence used and its parameters, including those relating to gradient pulses. Thus, in a simple diffusion-weighted imaging experiment, one can acquire a signal without much diffusion weighting where b is close to zero, and one can also acquire a signal with diffusion weighting where b is non-zero. Assuming the signal decay is mono-exponential, one can easily calculate the ADC.
The measured ADC of water in tissue can be dependent on the diffusion-gradient direction because of the anisotropic nature of tissue.5–7,9,23 Cellular structures can hinder or restrict water diffusion, causing the measured ADC to be smaller than the free diffusion coefficient. The hindrance can have different effects in different directions depending on the presence of cellular structures and their permeability to water molecules. Thus, DTI measurements combine several diffusion-weighted sequences in at least six different directions to measure the diffusion tensor.
Many groups use several gradient directions and a single b-value per direction to do DTI calculations, because it has been shown that at least 30 unique and evenly distributed gradient orientations are needed for robust determination of many DTI metrics. 24 It has been shown that the diffusion signal and metrics of the diffusion tensor change with increasing b-value in the developing rat brain. 25 It was concluded that the capability of DTI metrics to detect axonal damage and demyelination11,13,26–28 critically depends on the specific b-value used. 25 Thus, it was suggested that b-values be optimized for detecting specific neural tissue changes. 25
Previous studies have shown that DTI metrics change with b-value, using constant timings and different gradient strengths. 25 Diffusion signal is also diffusion time dependent,29–41 and thus changing the diffusion time can affect the non-mono-exponential decay behavior.
The effects of diffusion time on DTI metrics are controversial. 42 Some studies indicated that white matter DTI metrics were basically unchanged for diffusion times ranging from 8 to 2000 ms.43–46 Other studies found changes with diffusion time.38,40,41 It has been proposed that shorter diffusion times affect DTI metrics.47,48 Preliminary studies of rat brain support this proposal. 49 DTI metrics could also be diffusion gradient strength-dependent. Measurements made at constant b-values but with different diffusion times and diffusion gradient strengths also showed changes. 38 It was suggested 38 this decrease was not seen by others 43 because of the use of constant b-values. Data were acquired with constant gradient strength, but while careful attention was paid to the diffusion pulse sequence parameters, the echo time ranged from 67.9 to 96.9 ms. 38 Thus, the observed changes could be due to T2 rather than diffusion effects. A more comprehensive study is needed to characterize the effect of diffusion time on DTI metrics in CNS tissue.
Here we use Monte Carlo computer simulations to show the effects of diffusion time on DT metrics (MD, FA, λ||, and λ⊥) using two different geometries. The first geometry consisted of square cylinders on a square lattice 29 and the second geometry consisted of cylinders on a hexagonal lattice. 47 We used three gradient directions: one along the cylinders, corresponding to the direction of the axial diffusivity, and two perpendicular to this direction, whose results can be averaged to correspond to the direction of the radial diffusivity. The effects of using two diffusion images, one with low b-value close to zero and the other with high b-value, each with different diffusion times, were also studied. We also measured the effects of diffusion time on DT metrics using fixed rat spines for comparisons with the simulation data.
Methods
Sample preparation
Two healthy adult rats were sacrificed using transcardiac perfusion. Under isoflurane anesthetic, phosphate-buffered saline (PBS) solution was injected into the left ventricle of the heart for 10 minutes, followed by 4% paraformaldehyde (PFA) in 0.1 M PBS (pH 7.6). Spinal cords were excised and fixed in 4% PFA for one week. Prior to imaging, spinal cords were washed in 0.1 M PBS for 48 hours to remove any excess fixative. After washing, two thoracic spinal cord sections were wrapped together with Teflon tape along with an NMR glass containing 0.1 M PBS solution capped on both ends with paraffin wax. Teflon tape was wrapped around both ends of the sample to hold it firmly in a 50 mL plastic sample tube. The tube was filled with room temperature Fomblin® Perfluoropolyether Y04 grade fluid (Solvay Solexis) to eliminate external proton signal and susceptibility artifacts and maintain moisture in the samples. The sample holder was left at room temperature for several hours to allow the sample temperature to equilibrate.
Imaging
The sample tube was placed in a custom-built 33 mm inductively-coupled quadrature RF volume coil (NRC Institute for Biodiagnostics, Winnipeg, MB, Canada) and maintained at 20 °C ± 2 °C during imaging. All MR experiments were performed on a 7 T 21 cm Bruker Avance III NMR system with a BGA12-S actively-shielded gradient system and Paravision 5.
Three 1 mm thick slices, spaced 3 mm apart, were placed perpendicular to the two spinal cords and the PBS sample. All acquisitions had an FOV of 3 × 3 cm and a 256 × 256 matrix size for an in-plane resolution of 117 × 117 μm2. DTI data were acquired with a PGSE sequence using a 6-direction icosahedral gradient encoding scheme. In order to accommodate a large range of diffusion times and reduce the effect of T2 relaxation, TE was held constant at 75 ms. TR = 1500 ms and gradient pulse duration, δ = 4.5 ms. The low b-value was 0.00123 ms/μm2 and the high b-value ranged from 0.979 to 1.002 ms/μm2 depending on gradient direction. Fat suppression was turned on to reduce chemical shift artifacts and the readout bandwidth was relatively low (12.5 kHz) to improve SNR.
For the first set of experiments, eight different gradient separation times were logarithmically spaced between 8 and 56.5 ms (Δ = 8, 10.5, 14, 18.5, 24.5, 32.5, 42.5, and 56.5 ms). At Δ = 8 ms, the gradient strength was 352 mT/m to achieve b = 1 ms/μm2, but only 116 mT/m at Δ = 56.5 ms. The effective diffusion times are Δ - δ/3 = 6.5, 9, 12.5, 17, 23, 31, 41, and 55 ms. Each DTI experiment was acquired with 8 averages for a total acquisition time of 6 hours × 8 experiments = 48 hours.
Given the skepticism about previous measurements, because the changing gradient strength might affect the DTI metrics, a second set of experiments were used to compare DTI metrics as a function of diffusion time by keeping the gradient strength (g = 116 mT/m) and gradient pulse duration (δ = 4.5 ms) constant while varying Δ = 8, 10.5, 14, 18.5, 24.5, 32.5, 42.5, 56.5 ms and thus b = 0.10878, 0.15472, 0.21904, 0.30173, 0.41198, 0.55899, 0.74274, 1.000 ms/μm2. To keep the signal-to-noise ratio (SNR) similar in all measurements, the signal loss due to the different b-factors was calculated assuming an ADC of 0.5 μm2/ms and the minimum number of averages to increase the SNR to at least that of the highest b-factor image with 8 averages was used. Thus, the numbers of averages used in these measurements were 4, 4, 4, 4, 5, 6, 7, and 8 for a total acquisition time of 31.5 hours.
Another set of experiments was run to assess the effect of changing gradient strength without changing the diffusion time. Images were acquired with constant Δ = 24.5 ms, δ = 4.5 ms and varying g = 59.6, 71.0, 84.5, 99.2, 116, 135, 156, 181 mT/m corresponding to the same b-values as in the second experiment, namely b = 0.10878, 0.15472, 0.21904, 0.30173, 0.41198, 0.55899, 0.74274, 1.000 ms/μm2. Again, to keep the SNR similar in all measurements, the signal loss due to the different b-factors was calculated assuming an ADC of 0.5 μm2/ms and the minimum number of averages to increase the SNR to at least that of the highest b-factor image with 8 averages was used. Thus, the numbers of averages used in these measurements were 4, 4, 4, 4, 5, 6, 7, and 8 for a total acquisition time of 31.5 hours.
Using a custom-built MATLAB tool, all images from each experiment were registered to the low b-value image for that experiment or the lowest Δ for the first experiment. The registration used a rigid affine transformation matrix determined automatically by maximizing the 2D correlation coefficient between the two images. An anisotropic diffusion filter was subsequently applied to improve the apparent SNR.50,51 The filter was applied with 3 iterations and a gradient modulus threshold equal to three times the standard deviation of the noise in each image.
52
Diffusion tensors were determined using a non-linear least-squares fit and a modified Cholesky decomposition to ensure positive definiteness.
53
After diagonalization, DTI metric maps (FA, MD, λ|| and λ) were calculated. Thirty-nine regions of interest (ROIs) were defined in the images, 13 per slice, including the left, right, ventral, and dorsal regions of the white matter and the left and right regions of the grey matter of the spinal cords as well as the PBS sample as shown in Figure 1.
Thirteen regions of interest (ROIs) selected in one image slice of two rat spines.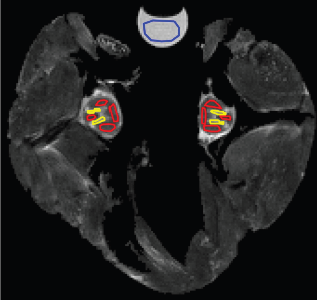
Monte Carlo simulation
A Monte Carlo computer simulation of the experiments was conducted. The simulation was programmed in C++ following a previously used method. 29 Two different geometries were used to simulate tissues similar to white matter in rat spines as previously described. 47
The first geometry consisted of 5.35 μm parallel square cylinders defined on a square lattice with a 6.02 μm spacing and a packing fraction of f = 0.79. The geometry for the second simulation consisted of 5.35-μm diameter parallel cylinders defined on a hexagonal lattice with a packing of f = 0.79.
Intracellular space was defined as the interior of the cylinders and extracellular space was defined as exterior to the cylinders. The intracellular and extracellular spaces were associated with distinct diffusion coefficients. For all simulations, Di = 1.0 μm2/ms and De = 2.5 μm2/ms and the T2 relaxation times were homogenous. 29
A set of N = 100,000 point particles was uniformly distributed in a random manner over the lattice. At each time step of 1 μs, the position of a particle was updated by generating a step vector with a random orientation in 3-dimensional space. The magnitude of the step vector was determined by the product of the speed of the particle and the length of the time step. The speed was calculated using
If the point particle reached a boundary, it would be specularly reflected because, for this simulation, the permeability of the barriers was set to 0. The simulation allowed for multiple reflections in a single time step.
The simulation modeled a PGSE sequence to derive the ADC from the spin magnetization vectors of the particles. The transverse component of the spin magnetization vector,
During a time step in which a gradient was being applied, 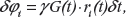
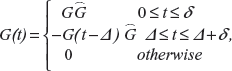
Once the echo time had elapsed, the signal of the 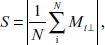
For each signal, a corresponding b-value was obtained from the equation b = γ
2
δ
2
Pulse sequence parameters, including echo times and diffusion gradients and timings, were made to match the parameters from the imaged spines.
In addition, the simulation data were used to fit lnS(b) to b using two data points, one at b = 0.10878 ms/μm2 and one with b = 1 ms/μm2. Several pairs of b-values were used. For each of the b-values, A was one of eight possible values; 8, 10.5, 14, 18.5, 24.5, 32.5, 42.5, and 56.5 ms. Thus 64 fits of lnS(b) to b using two data points, one at b = 0.10878 ms/μm2 and one with b = 1 ms/μm2, were used to calculate the ADC value for the simulation. If A had no effect on ADC then presumably each fit would give an identical value, given that the fits were using identical values for b.
Statistical analysis
To determine whether there were statistically significant changes in DTI metrics with diffusion time or b-value, statistics were performed using SAS® 9.2 software. One-way ANOVAs were used to measure the significance in the effects of effective diffusion times and b-values on the diffusion tensor metrics (FA, MD, λ|| and λ⊥) using real and simulated fixed rat spines. One-way ANOVAs were also used to measure the significance of effective diffusion time on diffusion tensor metrics when two different effective diffusion times were used in the fit to calculate the diffusion tensor. Statistical significance was determined using a threshold value of 0.05, where any
Results
λ||, λ⊥ and MD were calculated from the simulation data and from the rat spine images and are plotted in Figure 2. Significant variations in these data were confirmed with one-way ANOVAs, with Axial (λ||) shown in black, radial (λ⊥), shown in magenta, and mean (MD), shown in blue, diffusivities calculated from simulation data for square cylinders (first column), circular cylinders (second column) and from rat spine white matter (third column) and grey matter (fourth column). Note that the vertical axis scale changes for the rat spine data. Error bars for the simulation data are calculated from standard deviations in the diffusion tensor eigenvalues from three different runs of the simulation. Errors in the rat data are the standard deviations of the parameters in the ROIs. (A) These data were collected from experiments with constant b = 1 ms/μm2 and plotted versus effective diffusion-time (Δeff). (B) These data were collected from experiments with constant g = 29.9 mT/m and plotted versus Δeff. (C) These data were collected from experiments with constant Δ = 24.5 ms and plotted versus b-value.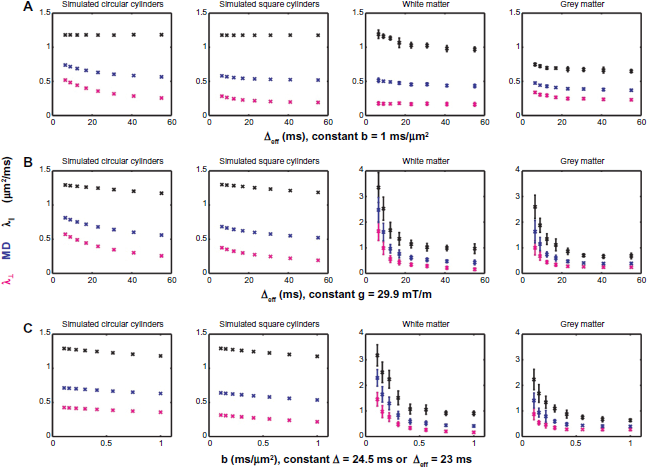
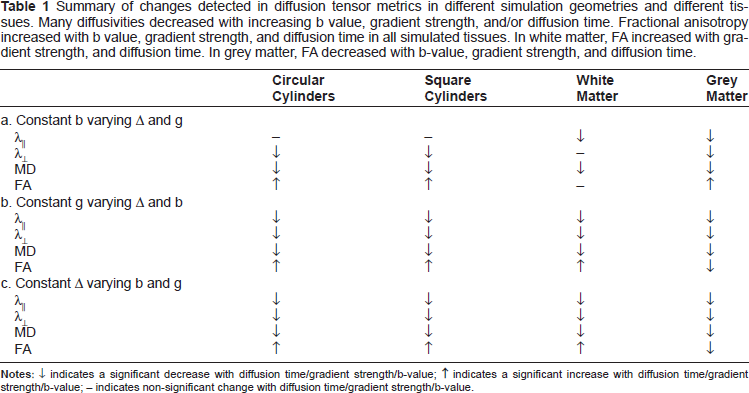
FA values were calculated from these data and are plotted in Figure 3. The significant variations in these data were confirmed with one-way ANOVA, with Fractional anisotropies calculated from simulation data for square cylinders (first column), circular cylinders (second column) and from rat spine white matter (third column) and grey matter (fourth column). Error bars for the simulation data are calculated standard deviations in the diffusion tensor eigenvalues from three different runs of the simulation. Errors in the rat data are the standard deviations of the FA values in the ROIs. (A) These data were collected from experiments with constant b = 1 ms/μm2 and plotted versus Δeff. (B) These data were collected from experiments with constant g = 29.9 mT/m and plotted versus Δeff. (C) These data were collected from experiments with constant Δ = 24.5 ms and plotted versus b-value. Summary of changes detected in diffusion tensor metrics in different simulation geometries and different tissues. Many diffusivities decreased with increasing b value, gradient strength, and/or diffusion time. Fractional anisotropy increased with b value, gradient strength, and diffusion time in all simulated tissues. In white matter, FA increased with gradient strength, and diffusion time. In grey matter, FA decreased with b-value, gradient strength, and diffusion time.
↓ indicates a significant decrease with diffusion time/gradient strength/b-value; ↑ indicates a significant increase with diffusion time/gradient strength/b-value; – indicates non-significant change with diffusion time/gradient strength/b-value.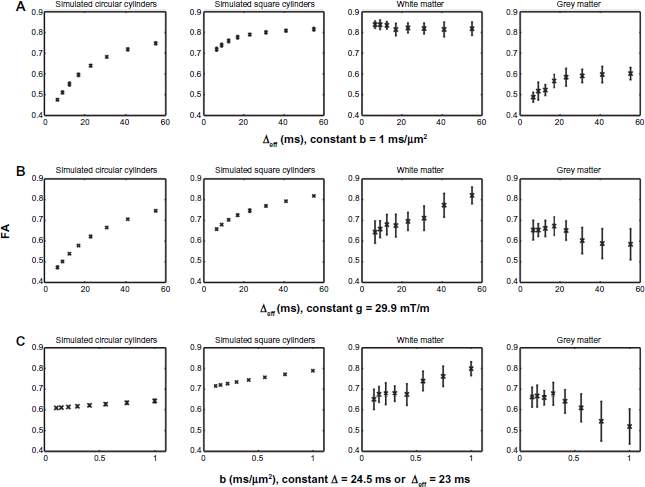
The diffusivities and FA values calculated using two data points, one with b = 0.10878 ms/μm2 and one with b = 1 ms/μm2, are shown in Figure 4. The significant variations in these data were confirmed with one-way ANOVA, with Axial (λ||) (first column), radial (λ⊥) (second column), and mean (MD) (third column) diffusivities and FA (fourth column) calculated from simulation data for square cylinders (first row) and circular cylinders (second row) using two b-values, b = 0.10878 ms/μm2 and one with b = 1 ms/μm2.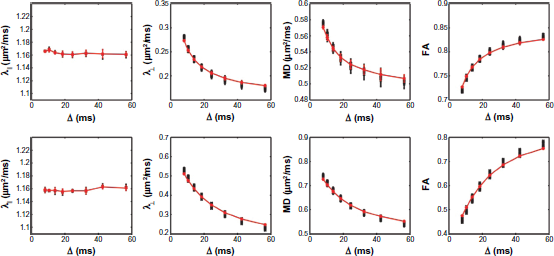
Discussion
Simulation data show significant decreases with effective diffusion time at constant b-value (λ⊥, MD) and at constant gradient strength (λ||, λ⊥, MD) similar to some studies29–41 and differing from others.25,43–46 Previous studies have suggested that missing changes are due to having a constant b-value instead of constant gradient strength, which does not appear to be the case for these simulation data. Therefore, this lack of change in previously collected data could be due to T2 effects. 38 Significant decreases in DT metrics were detected at Aeff of 23 ms, similar to previous studies that showed significant changes in DT metrics in developing rat brains with b-value at Δeff of 15.3 and 18.3 ms. 25
λ|| and MD in both white and grey matter in fixed rat spinal cords, and λ⊥ in only grey matter in the fixed spinal cords, significantly decreased with effective diffusion time at b = 1 μm2/ms. The noise in these data, as well as partial volume averaging effects, could account for the difference detected between the data and simulation. Also, a two-compartment model with constant diffusion coefficients for each compartment might be an oversimplification of the tissue. Nonetheless, the data do agree with some previous studies.25,43–46
All diffusivities measured in both grey and white matter significantly decreased with b-value when gradient strength or effective diffusion time was held constant. The difference in parameter values between grey and white matter also varied when gradient strength or effective diffusion time was held constant.
Increases were observed in FA with effective diffusion time, when b or g was held constant in the simulation data. Smaller increases were observed in FA with b when the effective diffusion time was held constant. These data clearly indicate that for tissue with similar properties to those simulated, FA values are diffusion time-dependent.
In white matter, no change in FA was detected when effective diffusion time varied at b = 1 μm2/ms. A significant increase was detected in FA in white matter with b-value when diffusion time or gradient strength was held constant. In grey matter, an increase was detected in FA with diffusion time when b was held constant and a decrease was detected in FA with b-value when gradient strength or diffusion time was held constant. These data suggest that FA is highly dependent on pulse sequence parameters. The contrast in FA maps between white matter and grey matter is also highly dependent on pulse sequence parameters.
The trends of radial and mean diffusivities with diffusion time and b-value are similar between simulation data and rat spine. When b is held constant, the trend in the increase in FA is similar between simulation and grey matter. When gradient strength or effective diffusion time is held constant, the trend of increasing FA is similar in white matter and simulation data. With varying b, the experimental data again show similar trends as the simulation data for b > 0.3.
The difference between simulation data and experimental data are likely due to the mismatch in geometry and diffusion coefficients between the simulations and tissue. For instance, the simulations used a constant diameter of 5.35 μm47 for the cylinders, while rat spinal cord tissue has been measured to have axons that range in diameter from about 2 μm to a little more than 5 μm in diameter. 54
One problem with the rat spine data is that the change in lnS from one b-value to the next for the first few b-values is smaller than the noise in lnS. Thus parameters measured from these data were extremely noisy. The dissimilarity between simulation and experimental data for b < 0.3 is probably because of this. Several points in the ROIs were removed from the calculations if the apparent diffusion coefficient measured from the fit was larger than 5 μm2/ms. Clearly a large SNR is required for DTI calculations, especially for small variations in b-values.
In vivo rat spinal cord measurements and simulations would add more insight into the controversies of changing DTI metrics. At body temperature all diffusion coefficients should be much larger than those at the temperatures used and simulated for the fixed spines in this study. 55 Thus, water molecules would diffuse longer distances in vivo than ex vivo. Therefore, it is less likely that DTI metrics would change with the longer diffusion times used in this study. Shorter diffusion times using oscillating gradient techniques 30 might be needed to detect changes in DTI metrics with diffusion times.
Using the 64 fits in each set of simulation data, no significant change in any of the DTI metrics was detected with effective diffusion time. Yet, the similar data in Figures 1 and 2, with constant b, using the same effective diffusion time for both measurements, show significant decreases in MD and λ⊥ and significant increases in FA. Thus variations in DTI metrics could be missed due to changes in pulse sequence parameters when making measurements. Care should be used to acquire images with the same pulse sequence parameters in all directions for comparable results.
For tissue like fixed rat spines with structures similar to what was modeled in the simulations, care should be used when calculating and comparing diffusion tensor metrics. It is not acceptable to simply use the same b-values in several experiments and compare the data. The elements that make up the b-value, namely the gradient strength and effective diffusion time, must be the same as well.
Conclusions
This study indicates that there are variations in measurements of diffusion tensor metrics with pulse sequence parameters, including effective diffusion time, b-value and gradient strength. For measurements to be compared between studies and within studies, pulse sequence parameters should be the same in each study. It is not sufficient to use the same b-value to compare data. Even to compare diffusion tensor metrics between studies that use the same parameters, the parameters used to obtain all b-values for all images in the study should be clearly explained.
Funding
The authors would like to acknowledge funding from the Natural Sciences and Engineering Research Council of Canada, Canada Foundation for Innovation, the Manitoba Research and Innovation Fund, and the Multiple Sclerosis Society of Canada.
Competing Interests
Author(s) disclose no potential conflicts of interest.
Author Contributions
Conceived and designed the experiments: MM, JDT, TJV. Analyzed the data: JDT, TJV, SLH, MM. Wrote the first draft of the manuscript: JDT, TJV, SLH, MM. All authors reviewed and approved of the final manuscript.
Footnotes
Acknowledgements
The authors would like to thank Dr. Handi Zhang for providing the excised rat spines used in this study.
As a requirement of publication author(s) have provided to the publisher signed confirmation of compliance with legal and ethical obligations including but not limited to the following: authorship and contributorship, conflicts of interest, privacy and confidentiality and (where applicable) protection of human and animal research subjects. The authors have read and confirmed their agreement with the ICMJE authorship and conflict of interest criteria. The authors have also confirmed that this article is unique and not under consideration or published in any other publication, and that they have permission from rights holders to reproduce any copyrighted material. Any disclosures are made in this section. The external blind peer reviewers report no conflicts of interest.