
Abstract
In this study we used incorporation of the DNA synthesis marker 5-bromo-2′-deoxyuridine or BrdU to visualize cell proliferation in the visual system of the adult mouse as a response to monocular enucleation. We detected new BrdU-labeled cells in different subcortical retinal target regions and we established a specific time frame in which this cell proliferation occurred. By performing immunofluorescent double stainings for BrdU and different vascular (glucose transporter type 1, collagen type IV), glial (thymosin β4, glial fibrillary acidic protein) and neuronal (Neuronal Nuclei, doublecortin) markers, we identified these proliferating cells as activated microglia. Additional immunohistochemical stainings for thymosin β4 and glial fibrillary acidic protein also revealed reactive astrocytes in the different retinorecipient nuclei and allowed us to delineate a time frame for microglial and astroglial activation. A PCR array experiment further showed increased levels of cytokines, chemokines, growth factors and enzymes that play an important role in microglial-astroglial communication during the glial activation process in response to the deafferentation.
Introduction
Since the pioneering work by Hubel and Wiesel in 1963 on monocularly deprived kittens, it has long been assumed that cortical plasticity is restricted to a so-called ‘critical period’ early in life beyond which no activity-dependent cortical reorganization is possible. 1 This general idea lasted until the 1980's when Merzenich and colleagues showed that neuronal plasticity can occur in the somatosensory system of adult monkeys after peripheral sensory deafferentation. 2 Soon thereafter it became clear that in adult higher mammals all sensory systems, including the visual system, are capable of functional reorganization in response to sensory deprivation or hyper-stimulation.3,4
In the last decade the attention in visual cortex plasticity research has shifted to mouse, because this animal model offers the possibility of unraveling the molecular and cellular mechanisms underlying the capacity to reorganize neuronal connectivity through genetic manipulations.5–9
Evidence is also emerging that such plastic changes in the brain in response to activity changes include more than a neuronal response in se. The central nervous system (CNS) has been shown to answer with compensatory angiogenesis when oxygen and nutrients become scarce due to prolonged exercise, stroke or chronic exposure to a hypoxic environment.10–13 Raising rats from time of weaning in an enriched environment increased synaptogenesis and the growth of neuropil in the cerebral cortex, which led to a significant growth of new capillaries to compensate for a higher metabolic demand.14–18 Similar but less significant results were obtained in older rats. 19 On the contrary, dark rearing rats from the time of birth greatly reduced cortical thickness and vascular density in the visual cortex due to the absence of visual stimuli. 20
Next to blood vessels also glial cells respond to changes in the brain. These cells provide physical support and nutrients to the CNS, preserve tissue homeostasis, form myelin and modulate neurotransmission. Cerebral ischemia and intraventricular kainic acid injections lead to microglial and astroglial activation in rat hippocampus (HC). 21 Glial reactions in the CNS do not only take place at the site of the lesion, but also at the projection site of the injured or endangered neuron. Examples of lesions that showed glial activation at the projection site are peripheral nerve lesion, fascialis nerve transection, spinal cord injury, entorhinal cortex lesion, and also various lesions in rat visual system.22–28 However, these effects have never been described in the visual system of the adult mouse.
To investigate whether unilateral enucleation induces local angiogenesis, gliogenesis or neurogenesis along the visual pathway of the adult mouse, we used BrdU as an in vivo marker of proliferating cells. Subsequent immunofluorescent double stainings with cell type specific markers were applied to determine the identity of the newly born cells in response to the retinal deafferentation. We conducted additional immunohistochemical analyses and a PCR array to scrutinize the observed glial response.
Materials and Methods
Animals and rearing conditions
All animals (n = 59) were from the inbred C57Bl/6J strain, obtained from Janvier Elevage (Le Genest-St-Isle, France) and housed under standard laboratory conditions. At the time of manipulation they were at least 12 weeks old and had been raised under a daily photoperiod of 13 hours light and 11 hours darkness with water and food available ad libitum. All experiments have been approved by the Institutional Laboratory Animal Use and Care Committee (Animal Facilities, K.U. Leuven, Belgium) and were in strict accordance with the European Communities Council Directive of November the 24th 1986 (86/609/EEC).
Monocular deprivation
The enucleation of the mice took place as previously described.
29
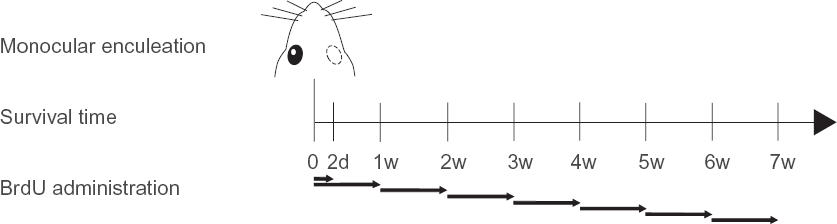
Briefy, under sedation by intraperitoneal (i.p.) injection of a mixture of ketamine hydrochloride (50 mg/mL) and medetomidine hydrochloride (1 mg/mL) (Pfizer Global Pharmaceuticals, Brussels, Belgium) at a dose of 8 μL per g body weight, the right eye was carefully removed (MEN, n = 49) and the orbit was filled with viscostat (Ultradent Products, South Jordan, UT), a viscous coagulate and hemostatic agent. After injection with atipamezol hydrochloride (0.5 mg/mL; Pfizer), the animals were allowed to recover on a heath pad. They were all administered 0.05 mL of antibiotics (Kefzol, 1 g Natrii cefazolin, and 15 mg Lidocaini hydrochloridum anhydricum in 4 mL 0.9% NaCl). Subsequently, the mice were placed back in an 11/13 h dark/light cycle for different survival times (2 days, 1, 2, 3, 4, 5, 6 and 7 weeks for BrdU immunohistochemistry (Fig. 1); 1, 3, 5, 7 and 14 days for thymosin β4 (Tβ4) and glial fibrillary acidic protein (GFAP) immunohistochemistry; and 1 week for immunofluorescent double stainings and for the PCR array) before being sacrificed. All control mice (CM, n = 10) were maintained in a similar light environment (11/13 h dark/light cycle).
BrdU administration
To identify proliferating cells and establish the time frame in which these cells are formed we used BrdU labeling. 30 Hereto, MEN (n = 29) and CM (n = 3) were injected i.p. with 40-50 mg/kg BrdU (Sigma-Aldrich, St. Louis, MO) each day, maximally one week prior to sacrifice (Fig. 1).
Tissue preparation
The animals used for single immunohistochemical stainings (CM, n = 3; MEN, n = 3 per survival time for BrdU immunohistochemistry; CM, n = 2; MEN, n = 3 per survival time for Tβ4 and GFAP immunohistochemistry) were sacrificed with an overdose of sodium pentobarbital (60 mg/mL, i.p.; CEVA Santé Animale, Brussels, Belgium) and were immediately perfused transcardially with 1% and 4% formaldehyde (Sigma-Aldrich) respectively in 0.15 M phosphate-buffered saline (PBS, pH 7.42). The brains were post-fixed for 24 h at 4 °C, rinsed with tap water and stored at 4 °C in PBS until further processing. Coronal sections were cut on a Vibratome (50-μm thick; Leica, Leitz Instruments, Heidelberg, Germany) and stored at 4 °C in PBS until further use. Series of free-floating sections were processed for BrdU, Tβ4 and GFAP immunohistochemistry.
The tissues used for double immunofluorescence (MEN, n = 5) were cryoprotected after postfixation by using graded concentrations of sucrose (15–20–30%; Merck, Overijse, Belgium) and were frozen in dry ice-cooled 2-methylbutane (Merck) at a temperature of -40 °C. Ten-μm-thick sections were prepared on a cryostat (Microm HM 500 OM, Walldorf, Germany), mounted on 0.1% poly-L-lysine (Sigma-Aldrich)-coated slides, and kept at -30 °C until staining. These sections were fluorescently double stained for BrdU and different vascular (glucose transporter type 1 or GLUT-1, collagen type IV), glial (Tβ4, GFAP) and neuronal (Neuronal Nuclei or NeuN, doublecortin or DCX) markers.
The animals used for the PCR array (CM, n = 5; MEN, n = 5) were sacrificed by cervical dislocation upon deep anesthesia (sodium pentobarbital overdose, 60 mg/mL, i.p.) and the brains were immediately frozen in dry ice-cooled 2-methylbutane (Merck) at a temperature of -40 °C. One hundred-μm-thick sections were prepared on a cryostat and collected on uncoated baked slides, from which tissue samples were collected.
Immunological reagents
Primary antibodies
Anti-BrdU (rat monoclonal immunoglobulin G (IgG), ab6326, ABCAM, Cambridge, UK) was used to detect proliferating cells. To investigate a glial response anti-Tβ4 (rabbit polyclonal IgG, FR9520.2, Immundiagnostik AG, Bensheim, Germany) was used to detect microglia, and anti-GFAP (rabbit polyclonal IgG, Z 0334, Dako, Glostrup, Denmark) for astrocytes. To detect mature neurons we used anti-NeuN (mouse monoclonal IgG, MAB377, Chemicon International Inc., Temecula, USA), and anti-DCX (rabbit polyclonal IgG, ab18723, ABCAM) for immature neurons. To stain the vasculature anti-GLUT-1 (rabbit polyclonal IgG, ab14683, ABCAM) and anti-collagen type IV (rabbit polyclonal IgG, AB756P, Chemicon International Inc.) were used.
Secondary antibodies
The secondary antibodies used in this study were: biotinylated goat anti-rat IgGs (ab6844, ABCAM), biotinylated goat anti-rabbit IgGs (E0432, Dako), Alexa 568-conjugated goat anti-rat IgGs (A11077, Molecular Probes, Eugene, OR, USA), Alexa 488-conjugated goat anti-rabbit IgGs (A11034, Molecular Probes) and Alexa 488-conjugated goat anti-mouse IgGs (A11029, Molecular Probes).
Immunohistochemistry
All incubations and rinses (3 x 10 min) were performed in Tris-buffered saline (0.01 M Tris, 0.9% NaCl, 0.3% Triton-X 100, pH 7.6). Serial 50-μm-thick free-floating Vibratome sections were pretreated with 0.3% H2O2, rinsed, and preincubated in normal goat serum (1:5; Chemicon International) for 45 min. Sections for BrdU immunohistochemistry underwent an additional pretreatment for 30 min in 2N HCl at 37 °C to denaturate the DNA. After overnight incubation with the primary antibodies rat anti-BrdU (1:1000), rabbit anti-Tβ4 (1:8000) or rabbit anti-GFAP (1:16000), detection was performed using biotinylated goat anti-rat IgGs (1:1000, 30 min) and an avidin-biotin-horseradish peroxidase solution (2 h; Vectastain Elite ABC, Vector Laboratories, Burlingame, CA) for BrdU immunohistochemistry, or biotinylated goat anti-rabbit IgGs (1:500, 30 min) and peroxidase conjugated streptavidin (1:500, 30 min; Dako) for Tβ4 and GFAP immunohistochemistry. The sections were immunostained using the glucose oxidase-diaminobenzidine-nickel method resulting in a black staining.31–33 Omission of the primary or secondary antibody abolished the immunohistochemical staining completely, indicating method specificity.
Immunofluorescent double staining
Primary and secondary antibody combinations and dilutions used for the immunofluorescent double stainings.

Microscopy
All microscopic images were captured using a Zeiss Axio-Imager equipped with a Zeiss Axiocam camera and Axiovision software (Carl Zeiss, Benelux). For the immunofluorescent stainings, images were enhanced with a Zeiss ApoTome. To identify the visual subcortical brain regions, we used the atlas of the mouse brain by Paxinos and Franklin. 34
PCR array
The upper, optical layers of the left visually deprived superior colliculus (SC) were collected manually from 100-μm-thick sections. Samples from 5 MEN mice were pooled, idem for 5 CM, and RNA was extracted from the two resulting samples using the RNeasy Mini Kit (Qiagen GmbH, Hilden, Germany) according to manufacturer's instructions. Genomic DNA contamination was eliminated by performing on-column DNase digestion with the RNase-free DNase Set (Qiagen). To obtain concentrations and to check for purity, spectrophotometric analysis was performed on the RNA samples using an Eppendorf BioPhotometer (Eppendorf, VWR International, Leuven, Belgium) and RNA samples of identical quantity (0.5 μg) were reverse transcribed with the SABiosciences RT 2 First Strand Kit (SABiosciences, Frederick, MD, USA), according to manufacturer's protocol, on a GeneAmp PCR System 9700 (Applied Biosystems, Foster City, CA, USA). cDNA was mixed with the RT 2 SYBR Green/ROX qPCR Master Mix (SABiosciences) and added to each well of a Mouse Angiogenesis RT 2 Profiler PCR Array (SABiosciences). PCR was performed on an ABI Prism 7000 SDS apparatus (Applied Biosystems). For data analysis the ΔΔCt method was used; for each gene the fold-change was calculated as the difference in gene expression between the left SC of MEN mice and that of controls. A positive value indicates gene upregulation and a negative value indicates gene downregulation. Genes of interest in our study are those with a fold-change of 2 or more. The housekeeping genes hypoxanthine guanine phosphoribosyl transferase 1 (Hprt1), heat shock protein 90 kDa alpha class B member 1 (Hsp90ab1) and β-actin (Actb) were used to normalize all samples.
Results
Timing and location of cell proliferation after monocular enucleation
To investigate whether cell proliferation takes place to support plastic changes as a result of sensory deprivation, unilaterally enucleated mice received daily intraperitoneal injections of the cell proliferation marker BrdU, maximally one week prior to sacrifice (Fig. 1). Immunohistochemistry for BrdU revealed regions of pronounced cell proliferation in different subcortical nuclei of the mouse visual system (Fig. 2). We could distinguish clear immunohistochemical staining for BrdU in direct retinal target structures such as the ipsilateral medial pre-optic area (Fig. 2A) and retro-chiasmatic area (Fig. 2B), the entire optic chiasm (Fig. 2C) and the ipsi- and contralateral optic tract (Fig. 2D). In the lateral geniculate nucleus (LGN, Fig. 2E) BrdU-immunopositive nuclei were found contralateral mainly in the dorsal LGN (dLGN), but there was also immunopositive staining in the ventral LGN (vLGN) and the intergeniculate leaflet (IGL). In the ipsilateral LGN immunostaining was confined to a small cluster of cells in the medial portion of the dLGN, the same region that did not show any staining in the contralateral LGN. In the SC (Fig. 2F) staining for BrdU appeared contralateral, but only in the superficial, optical layers.

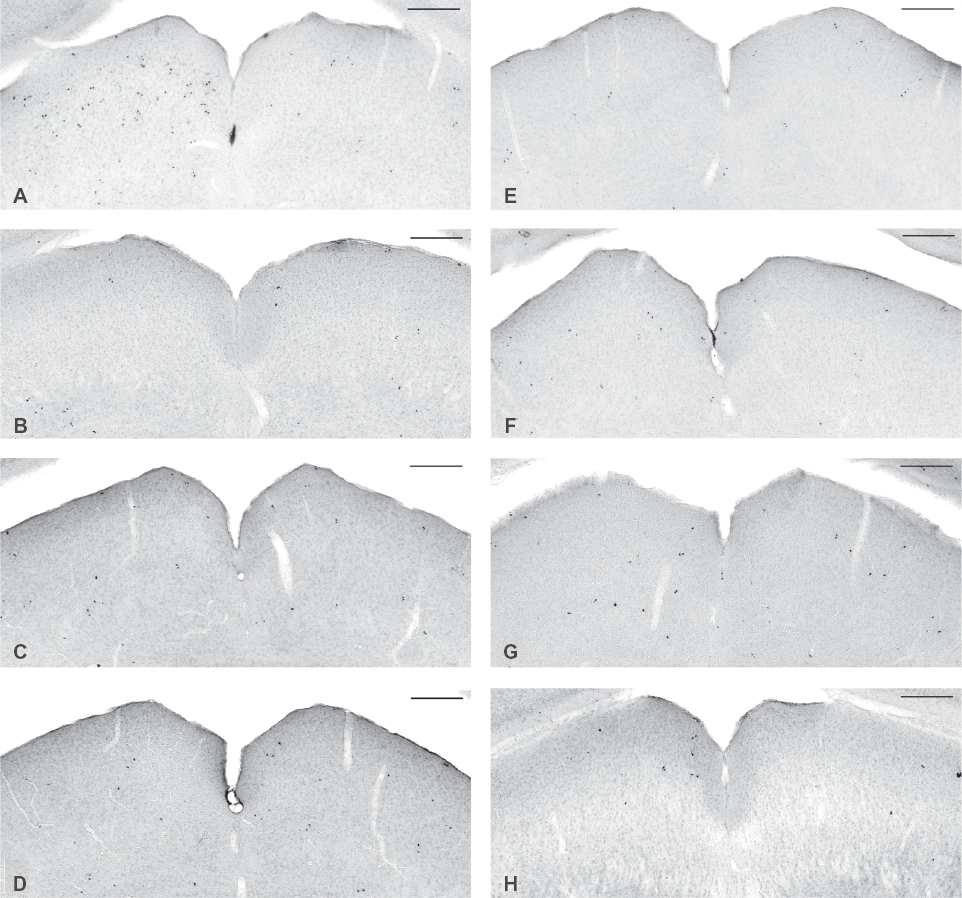
By injecting the animals at different time points after enucleation a time frame for this occurring cell growth could be established (Fig. 1). All six subcortical retinorecipient regions were examined and displayed a similar time line, as illustrated for the SC in Figure 3. Animals that survived 1 week after enucleation and thus received BrdU injections during the first week upon visual manipulation showed intense BrdU labeling (Figs. 2, 3A). On the contrary, animals that survived the enucleation 2 weeks or longer, and received BrdU injections only during the last week of survival, did not show any BrdU immunostaining exceeding background staining in these brain regions (Fig. 3B–G). By looking at the 2-day survival time, we saw that these animals showed less intense staining compared to the other groups that received injections over a longer time period, nevertheless we could observe a slight difference in the number of BrdU-immunopositive nuclei between the ipsi- and contralateral SC at this time point (Fig. 3H). These observations clearly delineate the first week after monocular enucleation as the time frame for cell proliferation.
When examining serial sections through the entire visual cortex, no BrdU-immunopositive staining could be detected exceeding background staining at any time point post-enucleation (Fig. 4A, data shown for 1 week post-enucleation). The few scattered nuclei that stained positive for BrdU corresponded to the background staining that was also present in control mice (Fig. 4B).

Identification of the proliferating cells
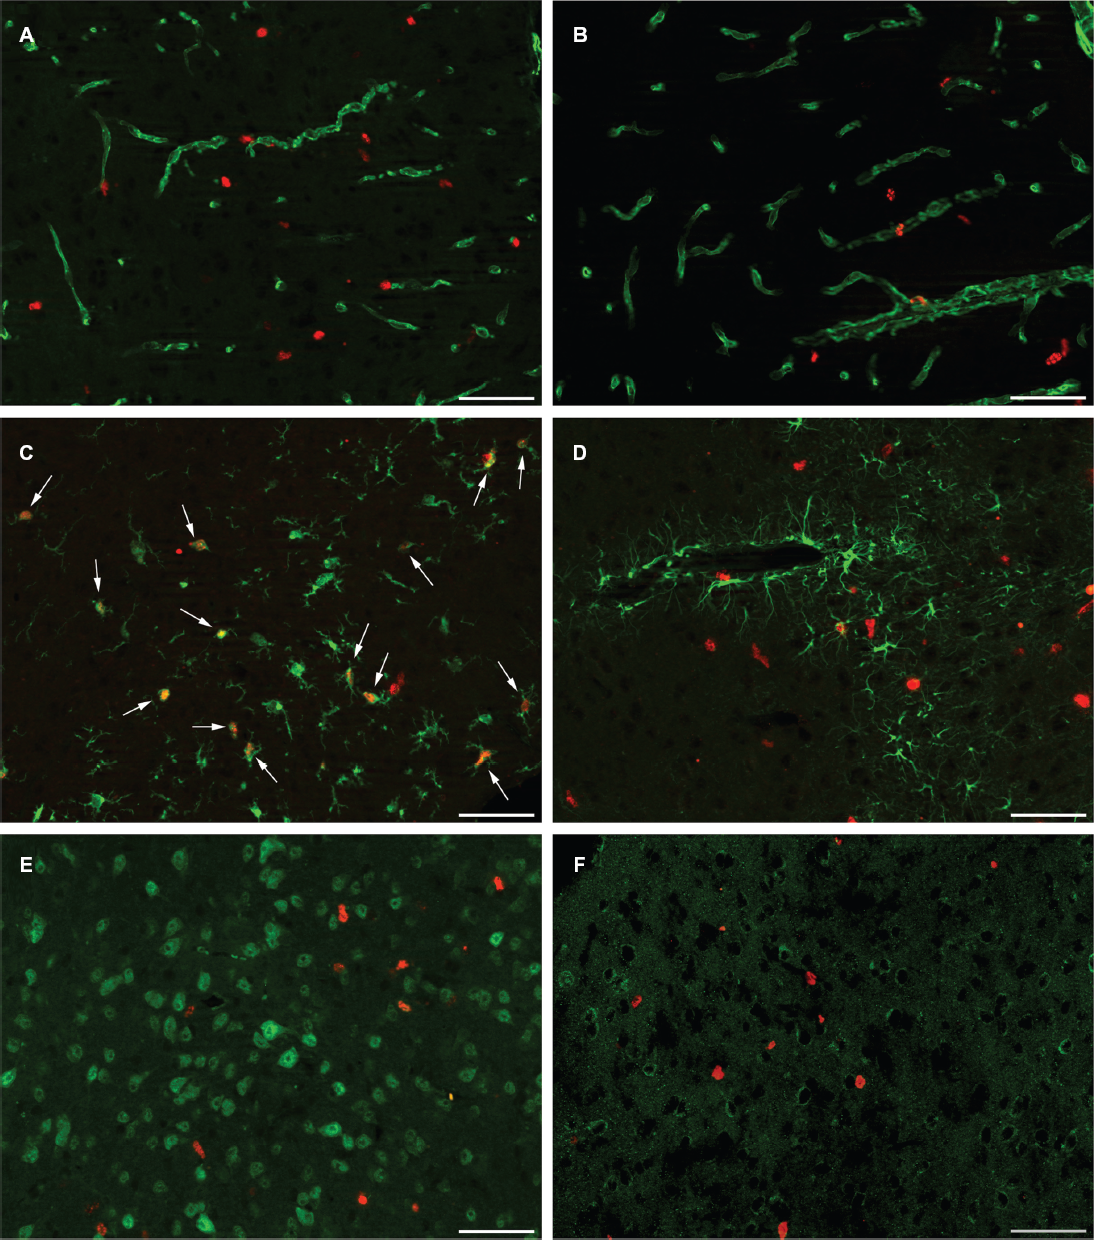
To identify the proliferating cell type within the subcortical regions of the mouse visual system, we performed fluorescent double stainings for BrdU and different vascular (GLUT-1, collagen type IV), glial (Tβ4, GFAP) and neuronal (NeuN, DCX) markers (Fig. 5). For this experiment only monocularly enucleated mice with a 1-week survival time were used, since they showed the most pronounced BrdU staining pattern. All six retinal targets were examined in this experiment, but only the results of the double stainings in the SC are shown, since all regions displayed a similar staining pattern.
Vascular markers
To investigate whether angiogenesis occurred, we verified if the newly formed cells were indeed endothelial cells. For this objective we used antibodies against the vascular markers GLUT-1, which is a major glucose transporter at the mammalian blood brain barrier, and collagen type IV, which is a major constituent of the basement membrane. Both vascular markers showed a very similar staining pattern (Fig. 5A–B). No apparent double staining was visible, but BrdU-immunopositive nuclei seemed to be closely associated with blood vessels.
Glial markers
To verify a possible glial response we used antibodies against Tβ4, a marker of a subpopulation of microglia, 35 and GFAP, a marker of reactive astrocytes. As illustrated in Figure 5C many BrdU-immunopositive nuclei colocalized with Tβ4 indicating that most proliferating cells were microglia. Figure 5D on the contrary shows that BrdU-immunopositive nuclei were very rarely associated with GFAP-immunoreactive astrocytes. These results show clearly that the most prominent proliferating cell type in the subcortical nuclei were microglia.
Neuronal markers
To examine possible neuronal cell growth in the proliferation zones, we used antibodies against NeuN, which is a nuclear protein restricted to nuclei and perikarya of most mature neurons, and DCX, a microtubule-associated protein that is exclusively expressed in early postmitotic neurons. No BrdU-immunopositive nuclei colocalized with NeuN-positive nuclei (Fig. 5E). This observation matches our expectations since the NeuN antibody only detects postmitotic neurons that are initiating cellular and morphological differentiation. Immunofluorescent staining for DCX also did not display any colocalization with BrdU-immunopositive nuclei (Fig. 5F). These results indicate that neuronal cell growth is not occurring in any of the retinal target structures upon monocular enucleation.
Upregulation of Tβ4 and GFAP expression in the contralateral sc after monocular enucleation
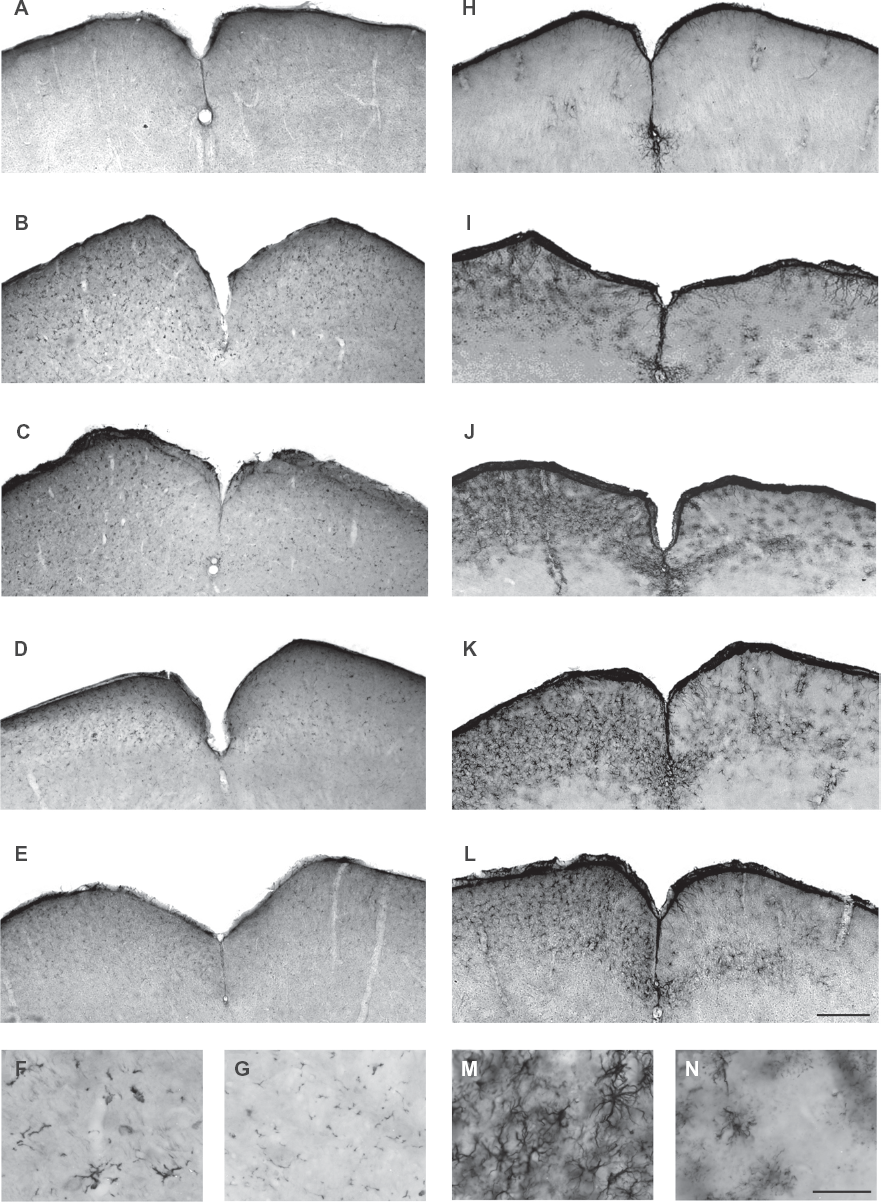
Immunohistochemical staining for Tβ4 at different survival times post-enucleation showed a substantial upregulation of Tβ4-immunopositive microglia in the contralateral SC. This upregulation was not yet visible at 1 day post-enucleation (Fig. 6A), but became obvious after 3 (Fig. 6B) and 5 days (Fig. 6C). At 7 days the expression levels had already started to normalize (Fig. 6D) until the Tβ4 upregulation had disappeared at 14 days after enucleation (Fig. 6E). When investigating the microglia in more detail at 3 days post-enucleation, a change in morphology was observed (Fig. 6F). Clear hypertrophic Tβ4-immunopositive microglial cells were detected in comparison to the small, inactive, Tβ4-expressing ramifications in control mice (Fig. 6G). In addition, immunohistochemical staining of GFAP showed a pronounced upregulation of reactive astrocytes in the contralateral SC. This upregulation was not visible at 1 day post-enucleation (Fig. 6H), but became detectable at 3 days (Fig. 6I). After 5 days reactive astrocytes became apparent (Fig. 6J) and the GFAP upregulation reached its maximum around 7 days after enucleation (Fig. 6K). In contrast to the microglial response, this astroglial response persisted beyond 14 days of survival (Fig. 6L). When analyzing these astrocytes in more detail, a hypertrophic morphology was noticeable (Fig. 6M) when compared to astrocytes in control mice (Fig. 6N).
PCR array
To profile the expression of 84 genes at once, we performed a PCR array in which we compared the expression of these genes within the upper, optical layers of the contralateral SC between 1-week enucleated and control mice. There was no apparent change in the expression of genes related specifically to angiogenesis, while some genes with a broader range of functions were up- or down-regulated. Genes with a fold upregulation of 2 or more were interleukin-1β (IL-1β), urokinase-type plasminogen activator (Plau), ephrin-A1 (Efna1), basic fibroblast growth factor (Fgf2) and chemokine (C-X-C motif) ligand 5 (Cxcl5). These genes showed fold upregulations of 4.34, 3.15, 2.69, 2.17 and 2.09 respectively in the unilateral enucleated mice compared to controls. On the contrary, there was an apparent downregulation of plasminogen (Plg) with a factor of 2.02.
Discussion
Absence of angiogenesis
Our experiments did not reveal any apparent angiogenesis along the mouse visual pathway after monocular enucleation. It is well-known that synaptic plasticity as well as vascular plasticity decreases with age.19,36–40 However, previous research showed that functional recovery still occurs in the visual system of adult mice. Limited retinal lesions as well as monocular deprivation by eye suture induced dendritic spine plasticity in adult mouse visual cortex.41,42 We here show that angiogenesis is not taking place to support such structural reorganizations. It is possible that no additional metabolic support is needed for such plastic changes to come about, not even after unilateral enucleation. When looking at motor activity studies, it is clear that angiogenesis only occurred after prolonged extensive physical exercise.11,12,43 This increased motor activity leads to extensive activation of already existing synapses and this enhances the metabolic demand of the tissue, which causes the formation of new blood vessels to supply adequate amounts of oxygen and glucose. However, when the animal had to learn complex acrobatic movements which require minimal motor activity, this led to the formation of new synapses, but no supporting angiogenesis seemed to take place. 43 In this case the existing vasculature seemed to be sufficient to meet the metabolic needs for the plastic rearrangements.
Glial response
In our study cell proliferation occurred only in subcortical visual regions after monocular enucleation. These subcortical brain regions are direct retinal targets which suggests that this cell proliferation is more a reaction to the sensory deafferentation instead of the sensory deprivation.44–48 The immunofluorescent double stainings clearly showed proliferation of Tβ4-immunopositive microglia during the first week of enucleation at these deafferented retinal projection sites. This result is in accordance with other deafferentation studies that showed activation of microglia at the projection site of injured neurons. Microglial hypertrophy, proliferation, and changed gene expression were also found in the zone of anterograde degeneration after facial nerve axotomy, peripheral nerve injury, spinal cord injury and entorhinal cortex lesions.24–26,28 Glial reactions also occurred in anterograde deafferentation studies performed on rat visual system. Unilateral destruction of the dLGN in adult rats led to hypertrophy of astroglia in the ipsilateral primary visual cortex, activated microglia and reactive astrocytes appeared in the contralateral SC within the first week after optic nerve transection in adult rats, and monocular enucleation in rats led to an increase in GFAP-immunopositive astrocytes in the contralateral LGN from 1 to 4 weeks post-enucleation.22,23,27
The immunohistochemical stainings in our study also showed an upregulation of GFAP-immunopositive astrocytes at the deafferented retinal projection sites, which occurred later than the Tβ4 upregulation. The time frame of microglial and astroglial activation after monocular enucleation corresponds to the glial response seen in other deafferentation studies. Our immunohistochemical stainings showed activation of microglia which was visible 3 days after enucleation and peaked at 5 days, after which the activation started to decrease until it had disappeared after 14 days. The astrocyte activation appeared at slightly later time points in comparison to the microglial response. The astrocyte activation reached its maximum at 7 days after enucleation and still persisted after 14 days. This is in accordance with results obtained in entorhinal cortex lesion studies, where microglia contributed to the immediate response after perforant path transection, by activating and proliferating within the first 3 days postlesion, and GFAP-immunopositive astrocytes always appeared several days later.25,49–56 In our model, as in other CNS injuries, microglia were the first cells to respond to the deafferentation by changing their cellular morphology from ramified ‘resting’ microglia to hyperramified hypertrophic microglia, by starting to proliferate within the denervated zone, and by changing the expression of cell surface molecules as well as the production of cytokines, chemokines and growth factors. This fast reaction corresponds to their ‘sentinel’ function in the CNS where they actively scan their environment by means of highly motile processes for changes in tissue homeostasis, after which they can trigger the appropriate response to the detected threats, such as phagocytosis of axonal debris and activation of astrocytes.50,53,57 Astrocytes seem to be activated by microglial production of IL-1 after which they also start to increase their number, show a hypertrophic morphology and increase their expression of GFAP.49,58–64 They help cleaning up the degenerated axons by phagocytosis and seem to release cytokines and growth factors that stimulate neuronal sprouting, such as ciliary neurotrophic factor (CNTF) and FGF2.53,57,65,66 In our monocular enucleation model, upregulation of GFAP immunoreactivity seemed to be a consequence of astrocyte activation and migration rather than proliferation, as no apparent double immunostaining for BrdU and GFAP occurred. This is in accordance with other studies where little or no proliferation of astrocytes could be seen at the site of denervation.67,68
Gene expression changes in the deafferented SC
The changes in gene expression we detected by performing a PCR array on the deafferented SC can all be connected to glial activation. As described above, the cytokine IL-1β, the gene that showed the most pronounced upregulation in our study, is produced and secreted by activated microglia to stimulate surrounding astrocytes.49,58–60,62–64 IL-1β also seems to activate microglia in an autocrine fashion, but these glial cells are primarily activated through neuronal-microglial signaling.69–74 The second most upregulated gene in our study encoded the enzyme urokinase-type plasminogen activator (uPA), a serine protease which activates plasminogen through proteolytic cleavage. This enzyme is also produced by activated microglia. 75 Cerebral ischemia in mice, rats and humans leads to elevated uPA secretion by microglia and in response to brain inflammation in mice both uPA receptor (uPAR) mRNA and protein expression are increased by resident microglial cells, which greatly accelerates the cleavage of plasminogen to active plasmin by concentrating the enzymatic reaction at discrete membrane regions.76–79 Plasmin does not only function to facilitate migration of cells by degrading the extracellular matrix, but also activates the unprocessed proform of brain-derived neurotrophic factor (pro-BDNF). BDNF can then promote cell survival and neurite outgrowth in the deafferented zone by binding to its receptor tyrosine kinase TrkB.80–83 Yet plasminogen mRNA was downregulated. Plasminogen expression is stimulated by IL-6, which is produced by activated microglia and astrocytes.84–88 In response to kainic acid lesions, plasminogen expression levels in hippocampal neurons temporarily increase.89,90 Possibly a feedback mechanism exists to prevent excessive plasmin activity through downregulation of plasminogen gene transcription. To determine whether we missed a period of increased plasminogen expression additional experiments within the first week post-enucleation are needed. The chemokine ephrin-A1 was also upregulated in the deafferented SC in our study. In adult rats ephrin-A1 mRNA levels were elevated in the deafferented HC after entorhinal cortex lesions. 91 This upregulation reached its peak at 14 days postlesion, but was also clearly discernible after 7 days, corresponding to our PCR array results. Ephrins have been widely reported to act as repulsion guidance molecules that prevent axons originating from various CNS structures from growing towards inappropriate targets.92–97 This function will prove useful in gaining proper functional recovery after deafferentation. Another chemokine that showed increased expression in the deafferented SC was CXCL5. Very little is known about this chemokine in deafferentation studies, but as it is produced by activated microglia and astrocytes CXCL5 could have a role in chemotaxis and inflammation in deafferented regions in the CNS.86–88 The increase in FGF2 or bFGF expression one week after deafferentation of the SC is in accordance with the elevated levels of FGF2 produced by reactive astrocytes after entorhinal cortex lesions in adult rats.65,98 This upregulation was necessary for cholinergic axonal sprouting in the denervated HC. In frogs and rats FGF2 increased retinal ganglion cell survival after transection of the optic nerve, and after a visual cortex lesion in rats the survival of neurons in the LGN was enhanced through administration of FGF2.99–101 This protective function is believed to be mediated through BDNF and TrkB signaling.102,103
Absence of neurogenesis
Although increased neurogenesis has been shown to occur after deafferentation in the olfactory bulb in adult mice and in the dorsal vagal complex in the adult rat brain stem,104,105 no new neuronal cells are formed in our study. While the olfactory bulb and the dorsal vagal complex are located in proximity to adult neural stem cell pools, that is the rostral migratory stream originating from the subventricular zone and the floor of the fourth ventricle,106,107 this is not the case for the retinal brain targets investigated in our study.
Conclusion
Our study showed apparent local cell proliferation in different subcortical retinal target regions of the adult mouse visual system within one week after unilateral enucleation but not in the visual cortex. Further immunohistochemical and immunofluorescent staining revealed these proliferating cells to be microglia that are activated within 3 days in response to the sensory deafferentation and also showed a slower onset of the activation (but not proliferation) of astroglia. We found changing expression levels for cytokines, chemokines, growth factors and enzymes that play an important role in microglial-astroglial communication during the activation process.
Abbreviations
brain-derived neurotrophic factor
5-bromo-2′-deoxyuridine
control mouse
central nervous system
chemokine (C-X-C motif) ligand 5
doublecortin
dorsal lateral geniculate nucleus
basic fibroblast growth factor
glial fibrillary acidic protein
glucose transporter type 1
hippocampus
immunoglobulin G
intergeniculate leaflet
interleukin-1β; i.p., intraperitoneal
lateral geniculate nucleus
monocular enucleation mouse
Neuronal Nuclei
phosphate-buffered saline
polymerase chain reaction
superior colliculus
thymosin β4
urokinase-type plasminogen activator
ventral lateral geniculate nucleus.
Footnotes
Acknowledgements
We thank Ria Vanlaer for expert technical assistance. This work was supported by grants of the Fund for Scientific Research-Flanders (FWO-Vlaanderen) and the Research Council of the K.U. Leuven (OT 05/33, OT 09/022). AC is the recipient of a PhD grant from the FWO-Vlaanderen.
This manuscript has been read and approved by all authors. This paper is unique and is not under consideration by any other publication and has not been published elsewhere. The authors report no conflicts of interest.