
Abstract
We reported previously that the pellagragenic property of corn protein is not only low L-tryptophan concentration but also the lower conversion percentage of L-tryptophan to nicotinamide; the amino acid composition greatly affected the conversion percentage. The amino acid value of wheat protein is lower than that of rice protein. In the present study, we compare the conversion percentages of L-tryptophan to nicotinamide between wheat protein and rice protein diets in growing rats. The body weight gain for 28 days in rats fed with a 10% amino acid mixture diet with wheat protein was lower than that of rats fed with a 10% amino acid diet with rice protein (68.1 ± 1.6 g vs 108.4 ± 1.9 g;
Introduction
The selection of some staple foods such as maize, rice, and wheat correlates with the prevalence of some nutrient-deficiency diseases. Pellagra, which is an L-tryptophan (L-Trp) and niacin deficiency syndrome,1,2 prevails in regions of high maize consumption 3 because the maize protein, zein, is low in L-Trp. 4 Beriberi, which is due to vitamin B1 deficiency, 5 prevails in regions of high rice consumption 6 because rice protein is high in L-Trp 7 but has low levels of vitamin B1 in polished rice. 8 With regard to wheat consumption regions, some special nutrient-deficiency diseases are not well understood.
The composition of dietary amino acids is reported to affect the conversion of L-Trp to nicotinamide (Nam).9–15 Generally, a diet low in L-Trp provides a lower conversion of L-Trp to Nam. When a diet with the first limiting amino acid of L-Trp was fed to rats, the lowest conversion of L-Trp to Nam was observed. 15 The concentration of L-Trp is lower in wheat protein than in rice protein. 7
In the present study, the conversion percentages of L-Trp to Nam were compared between rice protein and wheat protein diets in rats. We also investigated whether the addition of limiting amino acids to the wheat protein diet resulted in an increased conversion percentage of L-Trp to Nam.
Materials and Methods
Chemicals
Amino acids and sucrose were purchased from Wako Pure Chemical Industries Co. Ltd. Corn oil was purchased from Ajinomoto Co. Ltd. Gelatinized cornstarch, a mineral mixture (the AIN–93G mineral mixture),
16
and a vitamin mixture (nicotinic acid-free AIN-93 vitamin mixture containing 25% choline bitartrate)
16
were purchased from Oriental Yeast Co. Ltd. L-Trp, anthranilic acid (AnA), 3-hydroxykynurenine (3-HK), quinolinic acid (QA), and Nam were purchased from Wako. Kynurenine sulfate,
Animals and diets
The care and treatment of experimental animals conformed to the guidelines for the ethical treatment of laboratory animals set by the University of Shiga Prefecture. The room temperature was 20 °C and the humidity was 60%. A 12-hour light–dark cycle was maintained.
To acclimatize rats to their new environment, male Wistar rats (7 weeks old; CLEA Japan) were kept in individual rat metabolic cages (CT-10; CLEA Japan) and fed with a complete 10% amino acid mixture
19
diet
Compositions of diets.

Amino acid mixture simulated with wheat protein + limiting amino acids.
Amino acid mixture simulated with rice protein.
Amino acid mixture simulated with rice protein + limiting amino acids. 5Ref. 16.
Enzyme assays
The liver was dissected and a portion was homogenized immediately using a Teflon/glass homogenizer in five volumes of a cold 50 mmol/L KH2PO4/K2HPO4 buffer at pH 7.0. The resulting homogenate was used as an enzyme source. The methods used to measure the enzyme activities involved in the Nam catabolic pathway, Nam methyltransferase (NMTase) (
Measurement of L-Trp metabolites
The concentrations of L-Trp 22 and its metabolites, such as 5-HIAA, 23 kynurenine, 24 Nam, 18 2-Py, 18 4-Py, 18 MNA, 25 KA, 26 XA, 27 3-HA, 27 AnA, 28 QA, 29 and 3-HK, 30 in urine were measured using high-performance liquid chromatography.
Measurement of blood NAD
NAD (NAD+ + NADH) was measured using the methods of Shibata and Murata. 31
Calculation method for urinary excretion percentages of L-Trp and its metabolites
The conversion percentages were calculated from the following equation:
Conversion percentage = (urinary excretion of metabolite [mol/d])/(Trp intake [mol/d]) × 100
Statistical analyses
Values were reported as mean ± SE. Statistical significance was determined using one-way analysis of variance (ANOVA) followed by Tukey's multiple-comparison tests. Pearson correlation coefficients were calculated to determine the association between urine SUM (= Nam + MNA + 2-Py + 4-Py) and urine L-Trp and its metabolites. A
Results
Body weight gain, food intake, and food efficiency ratio
Figure 1 shows the effects of feeding the five different diets containing 10% amino acid mixture with nutritionally ideal protein, with wheat protein, with wheat protein + limiting amino acids (L-isoleucine, L-leucine, L-lysine, L-methionine, L-threonine, L-Trp, L-valine, L-histidine) (Table 1), with rice protein, and with rice protein + limiting amino acids (L-isoleucine, L-lysine, L-methionine, L-phenylalanine, L-threonine, L-Trp, L-valine, L-histidine) (Table 1) on body weight changes and food intake in rats.

Effects of amino acid mixture with wheat protein and with rice protein on body weight changes (A) and food intake (B) in rats.
Daily food intake for each day showed no significant differences among the five groups (Fig. 1), and the total food intake during the 28 days also showed no significant differences among the five groups (Table 2).
Effects of wheat and rice protein diets on the activities of NMTase and MNA oxidases in rat liver.
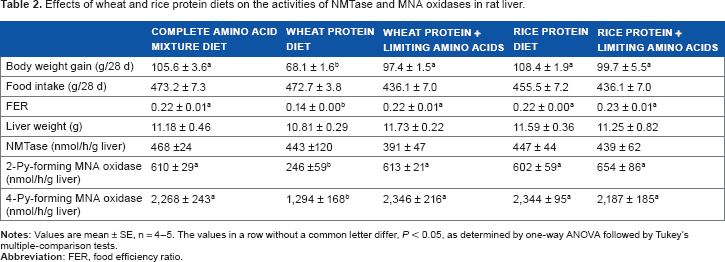
Body weight gain in the group fed with the wheat protein diet decreased from around day 15 compared with the other four groups (Fig. 1), and the final body weight gain was lower in the wheat protein group than in the other four groups (Table 2). Therefore, the food efficiency ratio (body weight gain/food intake) was lower in the wheat protein group than in the other four groups (Table 2).
Liver enzymes involved in Nam catabolism
NMTase activity showed no observable differences among the five groups (Table 2). The activities of 2-Py-forming and 4-Pyforming MNA oxidases were lower in the wheat protein group than in the other four groups, whose activities were recovered by the addition of the limiting amino acids (Table 2).
Blood NAD concentrations
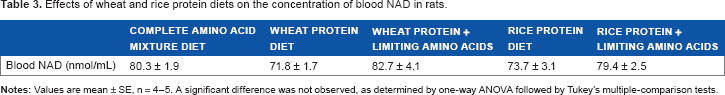
The diets used in the present study did not contain preformed niacin (Table 1). Therefore, all NAD was derived from dietary L-Trp. The concentrations of blood NAD were slightly lower in groups fed with wheat protein and rice protein diets than in groups fed with the complete amino acid mixture, wheat protein + limiting amino acids, and rice protein + limiting amino acids (Table 3), although significant differences were not observed among the five groups.
Effects of wheat and rice protein diets on the concentration of blood NAD in rats.
Urinary excretion concentrations of L-Trp and its metabolites
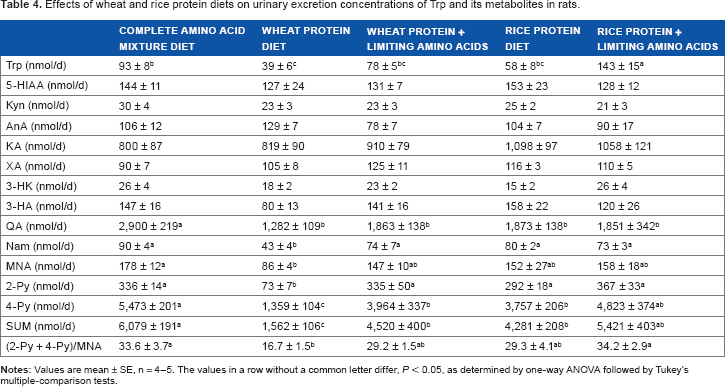
Table 4 shows the urinary excretion concentrations of L-Trp and its metabolites, such as 5-HIAA, kynurenine, KA, AnA, 3-HK, XA, 3-HA, QA, Nam, MNA, 2-Py, 4-Py, SUM, and (2-Py + 4-Py)/MNA, on day 28 as affected by dietary amino acids. The most characteristic finding was that the urinary excretion concentration of SUM (Nam + MNA + 2-Py + 4-Py) was lowest in the group fed with the wheat protein diet compared with the other groups, which was partly recovered with the addition of the limiting amino acids.
Effects of wheat and rice protein diets on urinary excretion concentrations of Trp and its metabolites in rats.
Urinary excretion percentages of L-Trp and its metabolites
As dietary concentrations of L-Trp among the diets differed, urinary excretion percentages of L-Trp and its metabolites were calculated (Table 5). The most characteristic finding was that the conversion percentage of L-Trp to Nam was lower in the group fed with the wheat protein diet than in the group fed with the rice protein diet, which was recovered with the addition of limiting amino acids.
Effects of wheat and rice protein diets on urinary excretory percentages of Trp and its metabolites in rats.

Association between urinary excretion of SUM and urinary excretion of Trp and its metabolites
Figure 2 shows the association between urinary excretion of SUM and urinary excretion of L-Trp and its metabolites. For L-Trp and its metabolites, a significant relationship was observed for QA and the latter metabolites, but not for the metabolites prior to QA.

Association between urinary excretion of SUM and urinary excretion of Trp and its metabolites. Data from five groups were used for analyzing the association. (A) Urine SUM and urine Trp. (B) Urine SUM and urine 5-HIAA. (C) Urine SUM and urine Kyn. (D) Urine SUM and urine AnA. (E) Urine SUM and urine KA. (F) Urine SUM and urine XA. (G) Urine SUM and urine 3-HK. (H) Urine SUM and urine 3-HA. (I) Urine SUM and urine QA. (J) Urine SUM and urine Nam. (K) Urine SUM and urine MNA. (L) Urine SUM and urine 2-Py. (M) Urine SUM and urine 4-Py.
Discussion
The supply of Nam from L-Trp makes up about half of that found in humans and experimental animals. 32 Therefore, studies on examining the effects of nutrients on the metabolism of L-Trp to Nam are very important for preventing pellagra outbreak.
Zein is a major protein in maize and is known to be a pellagragenic protein, 4 as it has a very low L-Trp concentration. Pellagra has had high prevalence in regions with high maize consumption since the beginning of the twentieth century. 33 Maize is thought to cause pellagra because of its low L-Trp content. However, Shibata 15 clarified that the pellagragenic effect of maize is not simply due to the lower concentration of L-Trp but it is because zein causes a lower conversion of L-Trp to Nam. That is, the two factors, namely the low concentration of L-Trp and the low conversion of L-Trp to Nam, both contribute to pellagra.
Shibata et al.14,34 reported that the urinary excretion ratio (2-Py + 4-Py)/MNA reflects the dietary protein nutritional value because this value affects the activities of 2-Py-forming and 4-Py-forming MNA oxidases but not that of NMTase. Similar findings were observed in the present study. The activities of MNA oxidases were higher in the rice protein group than in the wheat protein group. The excretion ratio (2-Py + 4-Py)/MNA was higher in the rice protein group than in the wheat protein group. The addition of limiting amino acids to the wheat protein diet enabled the recovery of values up to that of control values. Body weight gain data also showed that the amino acid value of rice protein was greater than that of wheat protein. These results indicate that the amino acid value of rice protein was greater than that of wheat protein in a whole animal experiment, a finding consistent with the general understanding.
The diets used in the present study did not contain preformed niacin, meaning that all Nam and its metabolites originated from dietary L-Trp. The values were found to be higher in the rice protein diet group than in the wheat protein diet group. A similar phenomenon was also observed in blood NAD concentrations. The addition of limiting amino acids to the wheat protein diet enabled recovery up to the control value. Therefore, the addition of limiting amino acids is suitable not only for growth promotion but also for the supply of Nam from L-Trp.
A correlation was observed between urine QA and urine SUM; that is, the biosynthesized amount of Nam from L-Trp was found to be subject to the formation of QA. Although the correlation was not significant, a weak relationship was observed between urine SUM and urine 3-HA. These results mean that QA is a key substance for the conversion of L-Trp to Nam.
The amounts of upper metabolites of L-Trp, such as 5-HIAA, kynurenine, AnA, KA, XA, and 3-HK, were almost the same between the wheat and rice protein diet groups, but the amounts of the latter metabolites from 3-HA and the beyond metabolites such as QA and Nam metabolites were significantly higher in the rice protein diet group than in the wheat protein diet group. The addition of limiting amino acids to the wheat protein diet increased the formation of QA from L-Trp. Liver 3-hydroxyanthranilic acid 3,4-dioxygenase (3-HADOase) and aminocarboxymuconate semialdehyde decarboxylase (ACMSDase) are involved in the formation of QA. 35 However, we did not measure the activities of these enzymes.
The L-Trp↠3-HA pathway exists in every organ and tissue, 36 while the L-Trp↠3-HA↠ACMS↠QA pathway is mainly located in the liver since the activity of 3-HADOase (the enzyme which catalyzes the 3-HA↠ACMS reaction) is found in the liver. 36 ACMS is an unstable compound but the majority of ACMS is catalyzed to form AMC by ACMSDase, and some ACMS that escapes from ACMSDase spontaneously cyclizes to form QA.
In conclusion, our results generally support the thinking that the composition of amino acids affects the conversion ratio of L-Trp to Nam. In addition, our results suggest that the amino acid composition affects the activity of ACMSDase as much as the dietary protein levels. 11
Footnotes
Author Contributions
Designed the research: KS. Conducted the research: TK. Analyzed data: KS, TF, TK. Drafted the manuscript: KS. All authors reviewed and approved of the final manuscript.