
Abstract
Estimates of healthcare utilization during an influenza pandemic are needed in order to plan for the allocation of staff and resources. The aim of this study was to assess the number, age, and arrival time of patients with influenza-like-illness (ILI), and associations between their symptoms during the 2009–2010 H1N1 pandemic. We conducted a cross-sectional analysis of electronic health records from the student health service (SHS) and an emergency department (ED) in Morgantown, West Virginia, between January 2009 and December 2010. During the 2009–2010 H1N1 pandemic, patient arrivals at SHS and ED varied over the week. SHS patients arrived early in the week and primarily in the afternoon. ED patient arrivals were more evenly distributed, with busier evenings and weekends. Those with fever were more likely to experience cough, sore throat, vomiting/nausea, chills, congestion, headache, and body-ache. These results can assist health professionals in preparing for an influenza pandemic.
Keywords
Introduction
Influenza outbreaks can result in considerable morbidity and mortality. The H1N1 influenza outbreak of 2009 was the first pandemic in over forty years. The Centers for Disease Control and Prevention (CDC) estimates that the peak H1N1 season (April 2009 to April 2010) in the United States resulted in 43–89 million cases, 195–403 thousand hospitalizations, and 8,870–18,300 deaths. 1 In addition to morbidity and mortality, Keech and Beardsworth concluded in their review that each episode of influenza resulted in a loss of 1.5–5.9 working days. 2 The global emergence of the H1N1 virus in April 2009 resurrected the significance of and urgency for continual influenza surveillance and epidemiologic data. 3 During an infectious disease outbreak, there is a massive increase in the demand for services in a healthcare facility such as a hospital emergency department. The available resources in such a facility needed to respond to this increased demand for healthcare services can be greatly enhanced with a more accurate estimate of the expected demand. 4
Influenza surveillance methodologies use laboratory-confirmed cases as the method for estimating total cases. However, not all cases go to a healthcare provider, nor are all cases tested for influenza. Therefore, the numbers reported are likely to be an undercount of the actual cases. Because of this, and in order to improve the timeliness of their reporting in the United States, the CDC monitors the occurrence of influenza-like illness (ILI), defined as fever > 100 °F, and cough, and/or sore throat (in the absence of a known cause other than influenza). 5
Symptomatic surveillance for influenza infections has limitations. A substantial proportion of patients infected with influenza virus may not develop clinical symptoms, even though they may shed their virus and transmit infection to others.6,7 In addition, several symptoms associated with influenza, such as fever, cough, headache, chills, fatigue, nausea, vomiting, and diarrhea, are also associated with other illnesses, which makes the clinical diagnosis of influenza difficult. 8
Babcock and associates, in a case series study, 9 and van den Dool and colleagues, in a prospective cohort study, 10 concluded that the sensitivity and positive predictive value of symptoms, such as fever and cough, for the diagnosis of influenza were low among hospitalized patients. Govaert and colleagues also reported a lower positive predictive value of the same combination of symptoms in elderly persons. 11 Hoeven and associates demonstrated that the influenza virus was present over twice as often as the clinically diagnosed influenza, indicating that clinical diagnosis alone should not be the basis for interventions designed to control the spread of the virus. 12
Despite these drawbacks, symptomatic surveillance is rapid and avoids the use of potentially scarce laboratory resources. Thus, symptomatic surveillance can be a critical tool for the prompt diagnosis of influenza needed to prevent the spread of virus and treat the disease in a timely fashion. In a retrospective, pooled analysis of 3,744 patients with ILI symptoms, Monto and colleagues concluded that clinical symptoms had a high positive predictive value of 60%–80%. 13
The overall purpose of this study was to assess the numbers and age distribution of patients presenting with symptoms of ILI to the two healthcare centers in a small Appalachian city between January 1, 2009, and December 31, 2010. The study also aimed to examine the associations between their symptoms and temporal patterns of presentation (month, day of week, and time of day). The results of this work can aid in public health planning and interventions for future influenza epidemics.
Methods
Research design and study population
Using electronic health records, we conducted a retrospective cross-sectional study of all patients who presented with ILI symptoms at the WELL WVU—The Students’ Center of Health (SHS) and the emergency department (ED) of Ruby Memorial Hospital between January 1, 2009, and December 31, 2010. Both facilities are part of the West Virginia University (WVU) Healthcare System and are located in Morgantown, a city in the metropolitan area of north central West Virginia, with a population of approximately 30,000. SHS is the healthcare clinic for the 30,000 students who attend West Virginia University. SHS operates from 8:30 am–6:00 pm during weekdays, and 8:30 am–4:30 pm during summer months. It follows the university schedule for semester breaks and holidays. Ruby Memorial Hospital is the largest in the city and its ED provides round-the-clock emergency care to sick and injured individuals from West Virginia and neighboring states.
A non-probability purposive sampling technique was used for this study that included all patients who presented with symptoms of ILI at either of the two participating healthcare centers in Morgantown, West Virginia, between January 1, 2009, and December 31, 2010. Information obtained from the electronic health records included age, sex, symptoms, diagnoses of the disease, and the date and time when they presented at the healthcare facility during the 2009–2010 H1N1 pandemic. Information on symptoms was only available for patients presenting at the ED. The West Virginia University Institutional Review Board (IRB) and the National Institute for Occupational Safety and Health IRB determined that this study was exempt from full review, and waived the requirement to obtain informed consent.
Data Analysis
We analyzed electronic health records by age, sex, month, weekday, and time for those patients who presented themselves with ILI at the SHS and ED in 2009 and 2010. For SHS, there were a total of 647 patient visits in 2009, of which 14 were repeat visits. In 2010, there were a total of 60 patient visits, of which 2 were repeat visits. Since the visits were on different days and times, they were included in the analyses for assessing the temporal patterns of patient visits.
Check-in times at SHS were categorized as morning (8:00 am–11:59 am) and afternoon (noon–5:59 pm). The hours at the ED were grouped into four time periods: midnight–5:59 am; 6:00 am–11:59 am; noon–5:59 pm; and 6:00 pm–11:59 pm.
Information on patient symptoms was not available from the SHS, but the records contained the ILI diagnoses for all the patients in this study. For the ED, we had information on the following symptoms recorded in the patient charts: fever, cough, chills, diarrhea, vomiting/ nausea, body ache, congestion, sore throat, headache, weakness/dizziness, ear pain, shortness of breath, and chest pain. Symptoms, such as tiredness, passing out, lethargy, and lightheadedness, were included under the symptom “weakness/dizziness.” Symptoms such as sinus drainage, runny nose/nasal drainage, stuffy nose, cold symptoms, sneezing, and lung pain were all combined with the main symptom “congestion.” Aches and back pain were combined with “body ache,” difficulty breathing was included under “shortness of breath,” throat pain was combined with “sore throat,” feeling flushed was included under “fever,” and rib pain was combined with “chest pain.” A separate category—”flu”—was listed on the medical records that combined influenza, ILI, and sick. Each of these symptoms was dummy-coded as 1 if the symptom was present and 0 if it was absent.
The following symptoms rarely occurred (between one and two cases) and were not included in the analysis: upper respiratory infection, abdominal pain, kidney pain, bladder infection, right flank pain, lymph node discomfort, tingling, rash, constant sleeping, bleeding, hearing problems, and dehydration.
Descriptive analyses were conducted to assess the temporal pattern (day of the week and time of the day), age distribution, and frequencies of ILI symptoms during the 2009–2010 H1N1 pandemic. Chi-square test was performed to assess whether ILI patients with fever were distributed differently across the days of the week. The likelihood of ILI patients with fever presenting at the ED and experiencing other symptoms was calculated by estimating the odds ratios (OR) and 95% confidence intervals using binary logistic regression analyses.
Results
The SHS had 20,466 patient visits in 2009 and 19,486 patient visits in 2010. Out of 707 patients identified in the patient records as presenting with ILI at the SHS in 2009 and 2010, nearly all (91.5%) were patients in 2009. Thus, there was a 91% decline in 2010 over 2009 in the number of patients with ILI presenting at SHS. For this reason, the demographic and other information of patients at SHS are only provided for 2009. There were slightly fewer female ILI patients (48%) than males. The age of ILI patients ranged from 17 to 39 years, and the mean age of ILI patients was 21.1 years (SD: 3.0). Over 54% of the ILI patients were between 17 and 20 years old, and another 39% were between 21 and 25 years old.
At the SHS in 2009, October was the busiest month, with 52% of the patients presenting; another 18% presented in November (Fig. 1). There was a significant difference between the number of patients presenting during different days of the week (
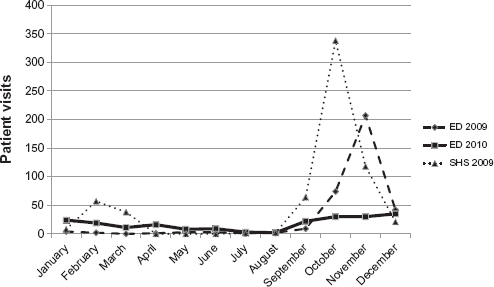
Monthly visits of ILI patients to SHS in 2009 and to ED in 2009 and 2010.
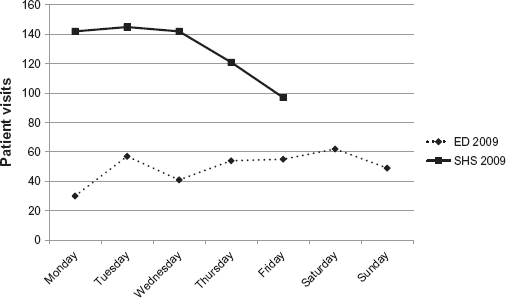
Weekly visits of ILI patients to ED and SHS in 2009.
There was a significant difference between the number of ILI patients presenting at the ED by month in 2009 (
In 2009, differences among the numbers of ILI patients at ED by day of the week were statistically significant (
In 2009, a third of ILI patients visited the ED between 6:00 pm and midnight, and slightly more patients (37%) visited during the same time in 2010 (Fig. 3). About 50% of the ILI patients presented between 6:00 pm and 6:00 am. At the ED, the most common symptoms of ILI patients in 2009 were fever (25.6%), cough (17.8%), and vomiting/nausea (9.5%) (Fig. 4). In 2010, fever was still the most common symptom (19.1%), followed by body ache (14.8%), sore throat (14.4%), and cough (13.4%).
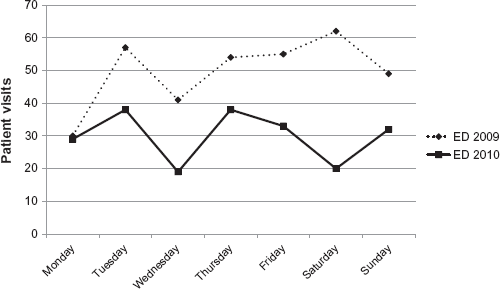
Weekly visits of ILI patients to ED in 2009 and 2010.
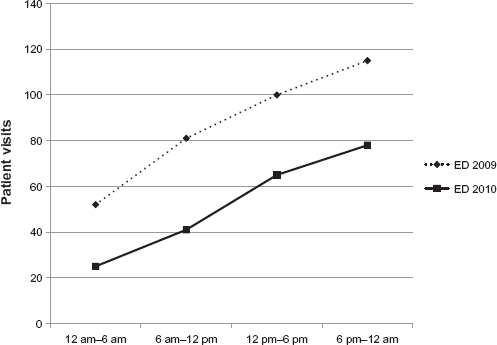
Timing of ILI patients to ED in 2009 and 2010.
Among the ILI patients at the ED in 2009, those with fever, when compared to those without, were more likely to also experience cough (OR: 10.89; CI: 5.88–20.16), sore throat (OR: 4.19; CI: 1.77–9.93), congestion (OR: 4.14; CI: 1.80–9.49), chills (OR: 3.98; CI: 1.44–11.04), headache (OR: 2.62; CI: 1.13–6.09), body ache (OR: 2.61; CI: 1.23–5.54), and vomiting or nausea (OR: 2.19; CI: 1.06–4.55) (Table 1). These patients were also more likely to have a flu test ordered at the ED (OR: 1.73; CI: 1.06–2.81). There were no significant differences in patients with fever either by sex or by day or time of presentation. Age was significantly and negatively associated with fever. Patients with median age (20.78 years) or younger were over three times more likely to have fever (OR: 3.27; CI: 1.91–5.61) than older patients.
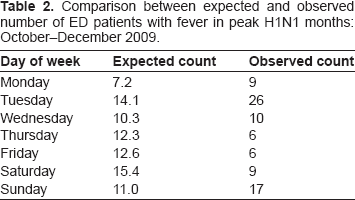
Odds ratios of ED patients with fever in 2009.
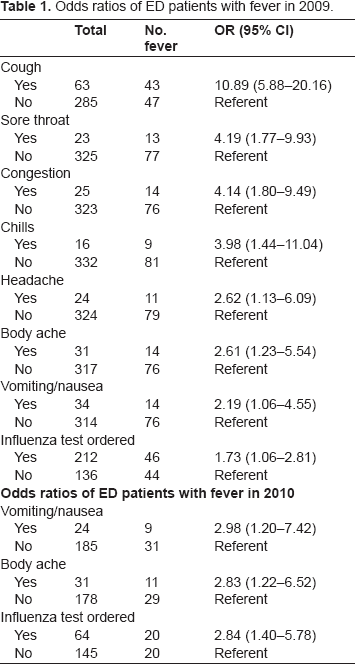
Among the ILI patients at the ED in 2010, those with fever were more likely to also experience vomiting or nausea (OR: 2.98; CI: 1.20–7.42) and body aches (OR: 2.83; CI: 1.22–6.52). Those with fever were also more likely to have a flu test ordered at the ED (OR: 2.84; CI: 1.40–5.78). The odds of having any other symptoms were not statistically significant and there was no association by age, sex, or day or time of presentation at the ED. Compared to the expected frequency of patients with fever on different days of the week in the peak months (October–December) of the H1N1 influenza season in 2009, the observed presentation of patients was much higher on Tuesday and Sunday, as shown in Table 2.
Comparison between expected and observed number of ED patients with fever in peak H1N1 months: October–December 2009.
Discussion
This study examines the temporal patterns of ILI patients presenting at a student health service (SHS) and a hospital emergency department (ED) during the 2009–2010 H1N1 pandemic in a city with a large college student population. Such an assessment can aid in public health planning and interventions for future influenza pandemics. Educational institutions such as schools, colleges, and universities, are places of high social contact, which can be prime sites of influenza transmission and outbreak. 14 Upper respiratory tract infections are a significant cause of morbidity among college and university students, adversely affecting their school and work performance. 15 In this study, we found that the number of ILI patients presenting at the SHS and ED in 2009 increased sharply at the beginning of the academic year, which is not the normal peak season for regular influenza.16,17
Most of the ILI patients presenting at the ED in 2009 and 2010 were younger than 60 years. This finding is consistent with what was seen nationally and is in contrast to the regular seasonal influenza pattern. 18 In this study, 86% of the 2009 patients and 79% of the 2010 patients were less than 40 years old; the highest proportion of patients in both years (42% in 2009 and 52% in 2010) were between 20 and 40 years old. This is an interesting finding because persons in the age group 20 to 40 years are considered to be the least vulnerable for all diseases. Yet, nationally, the H1N1 pandemic had a significant impact on this age group, with the elderly being less affected. These results concur with Shiley et al., who concluded that the median age of H1N1 patients was significantly lower than that of the seasonal influenza patients. 19
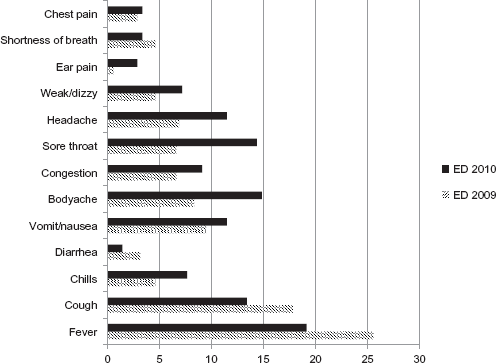
Percentage of ILI patients in ED with specific symptoms.
Another notable finding was that October was the month with the greatest number of patients presenting at the SHS in 2009; in turn, inflow of patients at the ED peaked in November in 2009 and 2010. One reason for this difference could be that the population seen at the ED has a different demographic than the population at SHS and influenza might have arrived sooner in the student population or spread faster because of higher population densities and greater mixing among the student population. Alternatively, it is possible that the ILI cases among the SHS patients in October had worsened in severity resulting in an ED visit in November. Nationally, the peaks in positive influenza cases in 2009 occurred in June and October. 20 Locally, data provided by West Virginia Sentinel Providers to the CDC indicate that a peak in visits for influenza cases in 2009–2010 occurred in October 2009, but not June 2009. 21 These data are corroborated by the positive test results that also peaked in October 2009, as reported by hospital and referral laboratories; 21 this suggests that patients in the ED and SHS followed a similar pattern to other areas of West Virginia. Additionally, the SHS did not experience the surge in June 2009 as many students were home for the summer. Less than 1% of the students who were ILI patients in 2009 presented themselves at SHS between the months of June and August.
The results also indicate that the distribution of patients both at the ED and SHS varied over the week during the 2009–2010 H1N1 pandemic. In 2009, the observed presentation of patients in the ED was much higher on Tuesday and Sunday compared to the expected frequency of patients with fever on different days of the week in the peak months (October–December) of the H1N1 influenza season. The ED had about half the number of patients in the late evening and early morning hours between 6:00 pm and 6:00 am. This suggests that there is a significant workload during the late evening and early morning hours; staff and healthcare services at ED are required equally during the day and nighttime periods.
Consistent with the CDC definition of ILI symptoms, the most common symptoms of ILI patients presenting at ED in 2009 were fever, cough, and vomiting/nausea. Our results are consistent with other studies that indicate a higher frequency of these symptoms among ILI patients. Among the 2009 ED patients, those with fever, compared to those patients without, were over ten times more likely to also have cough, four times more likely to experience sore throat and chills, over three times more likely to have congestion, and over two times more likely to report symptoms of headache, body ache, and vomiting or nausea. However, in 2010, while fever was still the most common symptom, it was closely followed by other symptoms, such as body ache, sore throat, and cough. A cross-sectional study by Shiley and colleagues compared the differences between epidemiological characteristics of pandemic H1N1 influenza and seasonal influenza. They concluded there were more complaints of cough, myalgia, and chest pain among the pandemic H1N1 influenza patients than among the seasonal influenza patients. 19 Tang et al. found that, compared with the seasonal influenza patients, those with H1N1 were at higher odds of experiencing cough (OR: 2.04; CI: 1.27–3.26) and sore throat (OR: 1.39; CI: 0.96–2.02). 22 Monto and colleagues conducted a retrospective, pooled analysis of eight double-blind, placebo-controlled studies in North America, Europe, and the Southern Hemisphere. 13 They analyzed baseline signs and symptoms from phase two and three clinical trial participants and concluded that fever and cough together were the two best predictors of influenza among patients with ILI. Several other studies also corroborate these findings.23,24 A systematic review of randomized control trials and cohort studies identified three symptoms—fever, rigors, and sweating—to diagnose influenza. 25 Another systematic review of clinical and epidemiological features of the pandemic influenza A (H1N1) in 2009 concluded with cough (84.9%), fever (84.7%), headache (66.5%), runny nose (60.1%), and muscle pain (58.1%) as the most common symptoms of confirmed cases. 26 Consistent with the literature, the results of this study indicate fever as the most common symptom among patients with ILI presenting at the ED.
Finally, this study has several limitations that need to be acknowledged. The study is confined to only two healthcare facilities in Morgantown, West Virginia. However, these healthcare facilities represent two different populations: the general population seeking care at the ED, and college age students seeking care through the university SHS. The diagnosis of ILI cases was based on symptoms reported by the patients. Many of the patients at the ED and SHS were not tested for influenza, so it is unclear how many cases of ILI were actually influenza. It is also possible that some of the actual influenza cases did not present with the symptoms of ILI. However, as indicated earlier, there is a strong correlation between ILI symptoms and laboratory-confirmed influenza.
Conclusion
In conclusion, we have demonstrated the temporal and demographic characteristics of patients presenting with ILI at two healthcare facilities in a small Appalachian city during the 2009–2010 H1N1 pandemic; for one facility we have examined the likelihood of other symptoms occurring along with fever in patients with ILI. There is a critical need to assess the magnitude of the burden of influenza cases and the healthcare resources needed to bear that burden. This study can assist health professionals in preparing for a better and more rapid response to an influenza epidemic.
Author Contributions
Conceived and designed the experiments: WL, RB, MF. Analyzed the data: RB, WL, TH. Wrote the first draft of the manuscript: RB, WL. Contributed to the writing of the manuscript: RB, WL, TH. Agree with manuscript results and conclusions: RB, TH, WL, MF, JP. Jointly developed the structure and arguments for the paper: RB, WL, TH, MF. Made critical revisions and approved final version: WL, TH, RB, MF, JP. All authors reviewed and approved of the final manuscript.
Funding
This study was funded in part by NIOSH contract 212-2008-M-25971 to West Virginia University.
Competing Interests
The authors have no competing interests. The findings and conclusions in this report are those of the authors and do not necessarily represent the views of the National Institute for Occupational Safety and Health.
Disclosures and Ethics
As a requirement of publication author(s) have provided to the publisher signed confirmation of compliance with legal and ethical obligations including but not limited to the following: authorship and contributorship, conflicts of interest, privacy and confidentiality and (where applicable) protection of human and animal research subjects. The authors have read and confirmed their agreement with the ICMJE authorship and conflict of interest criteria. The authors have also confirmed that this article is unique and not under consideration or published in any other publication, and that they have permission from rights holders to reproduce any copyrighted material. Any disclosures are made in this section. The external blind peer reviewers report no conflicts of interest.
Footnotes
Acknowledgments
The authors wish to thank Mr. Stephen Davis (Director of Clinical Research, Emergency Medicine, West Virginia University, Morgantown, West Virginia) for his help in the Institutional Review Board process, and Mr. Terry Jones (Administrator, Community Medicine, School of Medicine, West Virginia University, Morgantown, West Virginia) for his help in accessing the electronic health records at the emergency department.