
Abstract
Short-chain fatty acids (SCFAs), such as butyrate, produced by gut microorganisms, play a critical role in energy metabolism and physiology of ruminants as well as in human health. In this study, the temporal effect of elevated butyrate concentrations on the transcriptome of the rumen epithelium was quantified via serial biopsy sampling using RNA-seq technology. The mean number of genes transcribed in the rumen epithelial transcriptome was 17,323.63 ± 277.20 (±SD; N = 24) while the core transcriptome consisted of 15,025 genes. Collectively, 80 genes were identified as being significantly impacted by butyrate infusion across all time points sampled. Maximal transcriptional effect of butyrate on the rumen epithelium was observed at the 72-h infusion when the abundance of 58 genes was altered. The initial reaction of the rumen epithelium to elevated exogenous butyrate may represent a stress response as Gene Ontology (GO) terms identified were predominantly related to responses to bacteria and biotic stimuli. An algorithm for the reconstruction of accurate cellular networks (ARACNE) inferred regulatory gene networks with 113,738 direct interactions in the butyrate-epithelium interactome using a combined cutoff of an error tolerance (ε = 0.10) and a stringent P-value threshold of mutual information (5.0 × 10⁻¹¹). Several regulatory networks were controlled by transcription factors, such as CREBBP and TTF2, which were regulated by butyrate. Our findings provide insight into the regulation of butyrate transport and metabolism in the rumen epithelium, which will guide our future efforts in exploiting potential beneficial effect of butyrate in animal well-being and human health.
Introduction
Short-chain fatty acids (SCFAs, also known as volatile fatty acids or VFAs) are produced in the gastrointestinal tract by microbial fermentation of carbohydrate substrates of both exogenous (dietary fiber) and endogenous origin (mucus). SCFAs contribute up to 75% of the total energy requirement in ruminants and ~10% for humans. 1 A broad range of biological functions have been ascribed to SCFAs, specifically butyrate, in addition to their value in energy and nutrition metabolism.1,2 While as a preferred energy source for ruminal epithelial cells, butyrate plays a critical role in the development of the rumen epithelium. 3 As an indirect factor, butyrate is able to affect blood flow in the gastrointestinal (GI) tract as well as insulin and glucagon secretion. 1 Furthermore, butyrate reinforces intestinal barriers and modulates motility and visceral sensitivity of the intestine. 4 Butyrate modulates cell differentiation and motility, induces apoptosis, and inhibits cell proliferation in vitro5,6 in contrast to the observed effects on cell proliferation documented in vivo 7 Butyrate is known to be anti-inflammatory and anti-tumorigenic 4 Recently, butyrate has been shown to reduce bacterial translocation and internalization resulting from metabolic stress in human colon-derived cells. 8 Beneficial effects of butyrate on human health and animal well-being have been extensively reviewed.4,9
Steady-state butyrate concentration in the rumen represents a balance between butyrate biosynthesis by ruminal microorganisms and absorption and utilization by the rumen epithelium. Among factors that affect butyrate output of the gut microbial ecosystem, such as redox potential and pH, gut turnover and motility, and mucosal transport, 10 substrates in the gut play an essential role in butyrate production, possibly due to their influence on microbial population composition and dynamics.10–12 The community-level response of rumen microorganisms to exogenous butyrate has recently been characterized. 12 Dietary supplements, such as butyrogenic resistant starch, and probiotic administration of butyrate-producing bacteria have been exploited in human medicine to boost gut butyrate concentration for its potential health benefit.13–15 In ruminants, butyrate produced by gut microbes is rapidly removed by the rumen or gut epithelium, and subsequently metabolized to ketone bodies (acetoacetate and β-hydroxybutyrate) or oxidized to CO2 prior to being released into circulation such that only 25% of the butyrate enters the systemic circulation. 16 While substantial amounts of butyrate are absorbed across the rumen epithelium via passive diffusion, either trans- or para-cellularly, 17 other forms of butyrate transport may exist. Indeed, a butyrate transporter, SLC5A8, has been identified. 18 Much of our knowledge relating to the transcriptional effects of butyrate is derived from in vitro studies. 2 However, butyrate has long been known to have an opposite effect in vivo, especially on cell proliferation. In the present study, we quantified the changes in the rumen epithelial transcriptome of dairy cows in response to butyrate infusion using RNA-seq technology and bioinformatic tools.
Materials and Methods
Animal experiment
Four ruminally-cannulated Holstein cows used in this study were previously described. 12 Briefly, the cows in their mid-lactation were fed ad libitum standard lactation rations with 50% corn silage and 50% concentrate on a dry matter basis. All animal care and handling were conducted according to the guidelines approved by the USDA Beltsville Area Institutional Animal Care (Protocol # 09-008). Cows were moved to a tie stall barn for adaptation and acclimation 7 days prior to the experiment. Ruminal infusion of butyrate was initiated immediately following 0h sampling (baseline controls) and thereafter continued for 168 h at a rate of 5.0 L/day of a 2.5 M solution (representing >10% of daily anticipated metabolizable energy intake to support lactation) in a buffered saliva solution (pH 7.0; 3.8% KHCO3, 7.3% NaHCO3) as a continuous infusion. Following the 168 h infusion, infusion was stopped and cows were maintained on the basal lactation ration for an additional 168 h for sampling. Rumen epithelial samples were serially collected via biopsy through rumen fistulae at 0, 24, 72, and 168 h of infusion, and 24 and 168 h post infusion (post 24 h and post 168 h, respectively). Ruminal pH was monitored using a standard pH meter and recorded at every sampling. Rumen epithelial samples were saved in RNAlater and stored in –80C until RNA extraction. Additionally, a bovine epithelial cell line treated with 10 mM of sodium butyrate (N = 4) and PBS, respectively, for 24 h was used as an in vitro model for comparison. 2
RNA extraction and sequencing using RNA-seq
Total RNA from 24 rumen epithelial samples and 8 cell line samples was extracted using Trizol (Invitrogen, Carlsbad, CA, USA) followed by DNase digestion and Qiagen RNeasy column purification (Qiagen, Valencia, CA, USA) as previously described.19,20 The RNA integrity was verified using an Agilent Bioanalyzer 2100 (Agilent, Palo Alto, CA, USA). High-quality RNA (RNA Integrity number or RIN > 9.0) was processed using an Illumina TruSeq RNA sample prep kit following the manufacturer's instruction (Illumina, San Diego, CA, USA). After quality control procedures, individual RNA-seq libraries were pooled based on their respective sample-specific 6-bp adaptors and sequenced at 50 bp/sequence read using an Illumina HiSeq 2000sequencer as described previously. 21 Approximately 25.7 million sequences per sample (Mean ± SD = 25,746,641 ± 7,637,237.4) were generated.
Data analysis and bioinformatics
Raw sequence reads were first checked using our quality control pipeline. Nucleotides of each raw sequence read were scanned for low quality and trimmed using SolexaQA. 22 Trimming removed ~24.9% of the raw reads; and mean length of resultant input reads were 48.96 bp (±0.46, SD). Input reads were then aligned to the bovine reference genome (UMD3.1) using TopHat. 23 Approximately 96.68% of input reads were aligned to the bovine genome whereas 71.58% of input reads were uniquely mapped to the gene space in the bovine genome. Each SAM output file from TopHat alignment, along with the GTF file from ENSEMBL bovine genebuild v65.0, were used in the Cuffdiff program in the Cufflink package (v1.3.0) as input files 24 to test for differential gene expression. Mapped reads were normalized based on upper-quartile normalization method. Cuffdiff models the variance in fragment counts across replicates using the negative binomial distribution as described. 25
Differentially expressed genes in the transcriptome identified were further analyzed using Gene Ontology (GO) analysis (https://github.com/tanghaibao/goatools). Enrichment of certain GO terms was determined based on Fisher's exact test. A multiple correction control (permutation to control false discovery rate, FDR) was implemented to set up the threshold to obtain the lists of significantly over-represented GO terms.
Co-regulatory gene networks were analyzed using Algorithm for the Reconstruction of Accurate Cellular Networks (ARACNE). 26 Raw mapped sequence reads from 32 samples, including 24 rumen epithelial samples and 8 samples from a bovine epithelial cell line were first normalized (per million mapped reads) and log2 transformed. Only 15,469 genes with mean mapped reads greater than 10.0 across all 32 samples were used for subsequent analysis. Relative expression values of these genes were used as input files to infer global regulatory networks.
Results
A snapshot of the rumen epithelial transcriptome
Collectively, a total of 20,371 genes were detected at least once in at least one of the 24 rumen epithelial samples. The number of genes expressed per sample was 17,323.63 ± 277.20 (Mean ± SD). The number of genes with mean hits ≥ 5.0 were 15,015 whereas the core transcriptome of the rumen epithelium consisted of 15,025 genes, ie, genes represented by at least one sequence hit in each of the 24 samples tested.
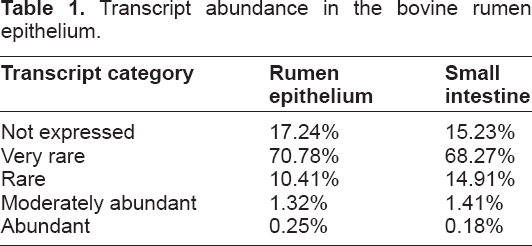
According to the transcript abundance classification described previously, 21 approximately 70.78% of genes transcribed in the rumen epithelium can be classified into “very rare” with a relative abundance ≤15 molecules per cell (Table 1), followed by “not expressed” (0 molecule per cell) at 17.24% and “rare” (16–99 molecules per cell) at 10.41%. “Moderately abundant” genes accounted for 1.32% while the abundant transcripts with ≥500 molecules per cell accounted for only 0.25% of genes detected in the transcriptome. Unlike what was observed in the bovine muscle tissue where the transcriptome was dominated by a handful of genes (Baldwin et al 2012, personal communication), the most abundant gene in the rumen epithelial transcriptome was a mitochondrial gene, cytochrome c oxidase subunit I, represented by ~6.23% of sequence reads. The 20 most abundant genes in the rumen epithelial transcriptome, which accounted for ~23.8% of sequences, included 6 genes of mitochondrial origin, such as cytochrome b, and 3 keratin genes, such as keratin, type I cytoskeletal 17 (Ensembl ID: ENSBTAG00000006806) and keratin, type II cytoskel-etal 59 kDa, component IV (ENSBTAG00000039425). This is in contrast to the bovine small intestine transcriptome, 21 in which the 20 most abundant genes accounted for ~13.3% of sequences. Among the 20 most abundant transcripts, only 3 genes were shared in the transcriptome of both the small intestine and the rumen epithelium, including cytochrome c oxidase subunit I (ENSBTAG00000043561), elongation factor 1-alpha 1 (ENSBTAG00000014534), and a novel protein-coding gene (ENSBTAG00000034185).
Transcript abundance in the bovine rumen epithelium.
Genes significantly impacted by butyrate
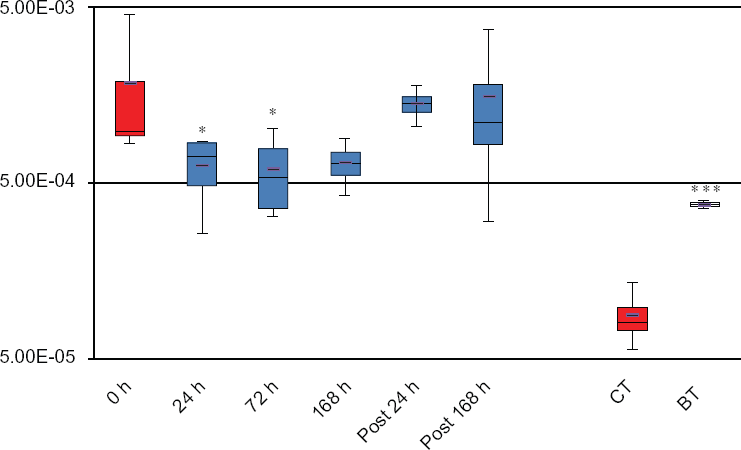
A total of 80 genes were found to be affected in the rumen epithelium by butyrate infusion at ≥ one time point at a stringent cutoff, FDR < 5% (Table 2). Compared to pre-infusion at 0h, 24 h infusion affected 15 genes, including down-regulation of solute carrier family 5 (iodide transporter), member 8 (SLC5A8), leukocyte surface antigen (CD47), lipopolysaccharide binding protein (LBP), immunoglobulin lambda-like polypeptide 1 (IGLL1), and lactoperoxidase (LPO). The maximal effect of butyrate was observed at 72 h infusion when 59 genes were influenced, including lymphocyte antigen 6D (LY6D), keratin 75 (KRT75), and tubulin beta-3 chain (TBB3). While the impact on some genes, such as a novel protein (ENSBTAG00000039035), which was strongly induced by butyrate at only the 24 h infusion sampling, was seemingly transient, transcriptional responses of butyrate on many genes were long-lasting. The ruminal butyrate concentration returned to its pre-infusion basal level 168 h after the infusion withdrawal (Fig. 1). However, as many as 13 genes remained significantly affected at 168 h post-infusion, compared to 0h, and these included cadherin 26 (CDH26), desmoglein 1 (DSG1), and kallikrein-related peptidase 10 (KLK10). 53 of the 80 differentially expressed genes were also significantly impacted by butyrate in the in vitro model. However, the remaining 27 genes were only significantly regulated by butyrate in the rumen epithelium, such as dual oxidase maturation factors 1 and 2 (DUOXA1 and DUOXA2) and keratin 36 and keratin 75 (KRT 36 and KRT75). Additionally, of the 80 genes affected by butyrate, a majority were down-regulated by butyrate treatment, which is consistent with the effect of butyrate observed in bovine epithelial cells in vitro (Wu et al 2012, personal communication). Eight genes up-regulated by butyrate at ≥ one time point were heat shock 70 kDa protein 6 (HSPA6, 24 h), transglutaminase 2 (TGM2, 72 h and 168 h), alcohol dehydrogenase 1C (class I), gamma polypeptide (ADH1C, 72 h and post 168 h), small nucleolar RNA SNORA31 (SNORA31, 168 h), farnesyl pyrophosphate synthase (FPPS, post 124 h), keratin 36 (KRT36, post 168 h), ornithine decarboxylase (ODC, post 168 h), and peptidoglycan recognition protein 2 (PGLYRP2, post 168 h).
Genes significantly impacted by butyrate in the rumen epithelium detected by RNA-seq technology.
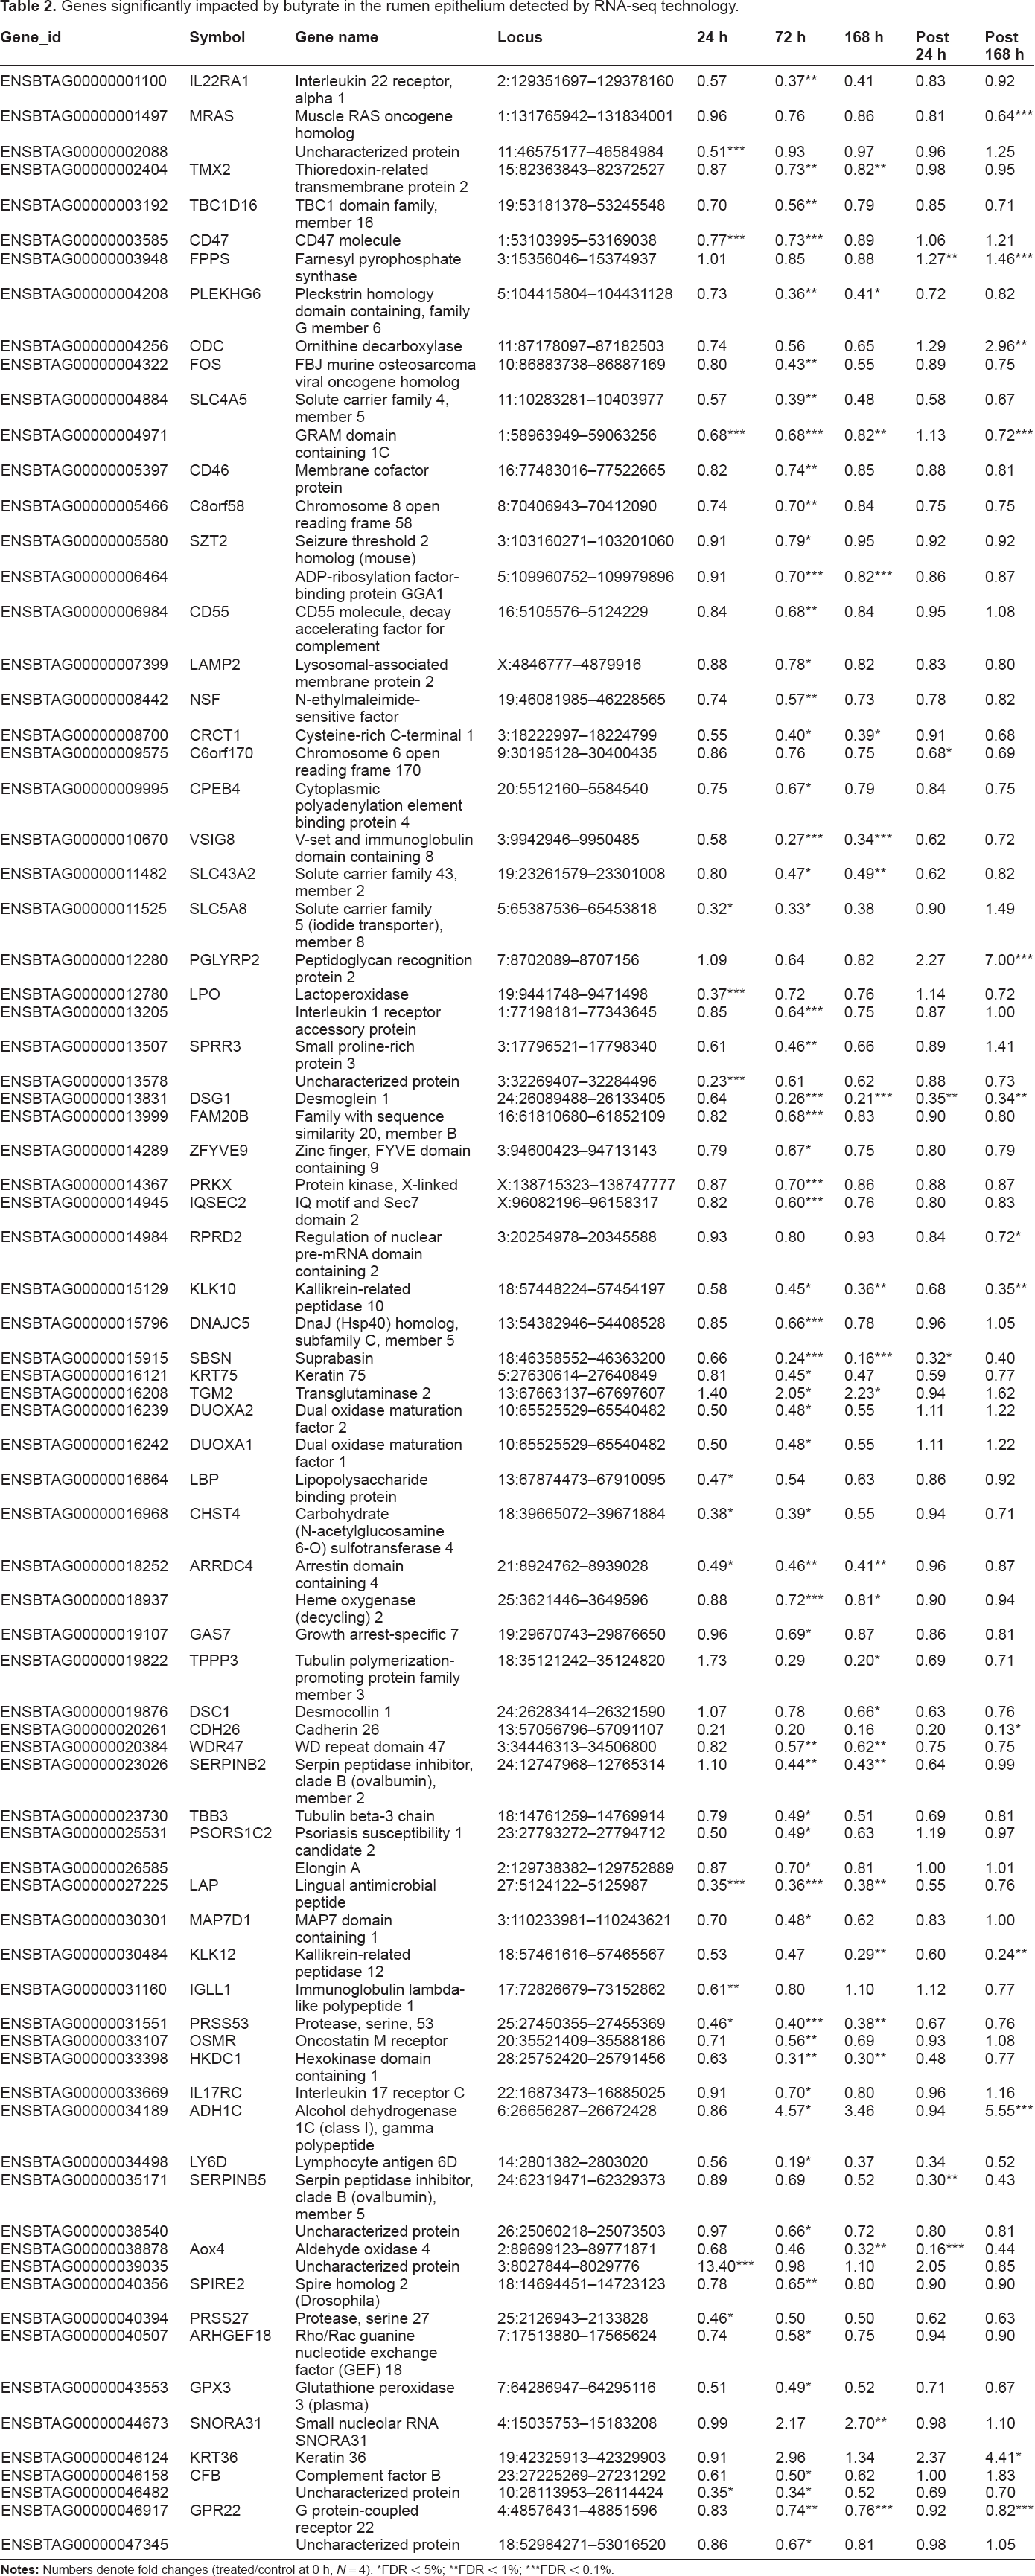
FDR < 5%;
FDR < 1 %;
FDR < 0.1 %.
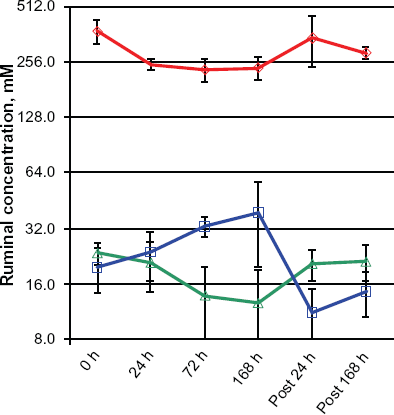
Ruminal concentrations (mM) of short-chain fatty acids in response to butyrate infusion.
Gene Ontology (GO) analysis
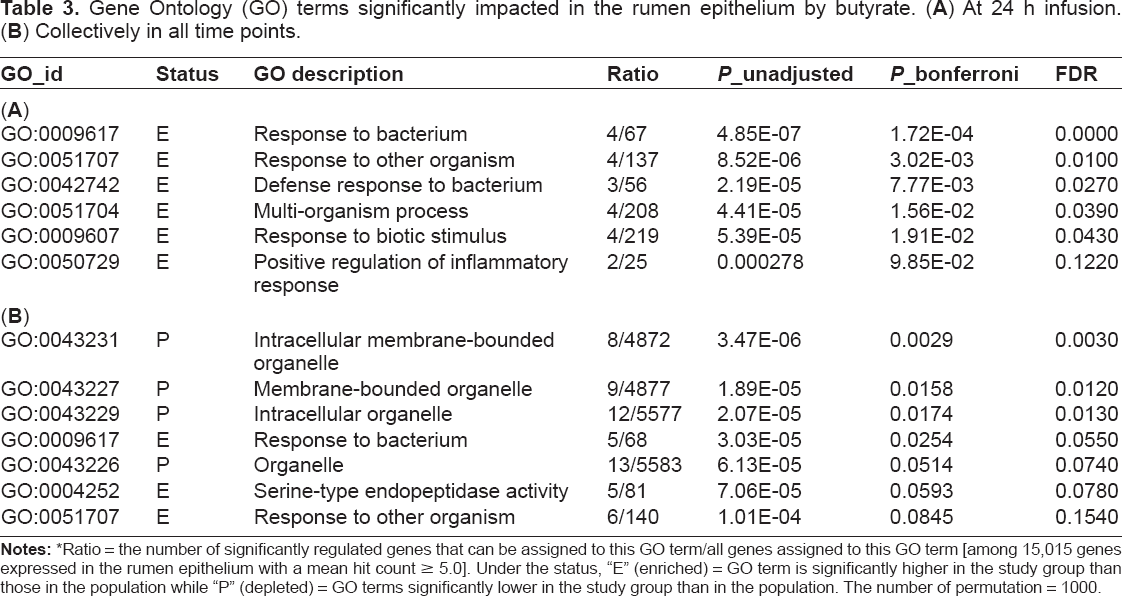
GO terms significantly enriched in the rumen epithelium in response to butyrate infusion were identified using GOATOOLs. At 24 h infusion, five biological processes were significantly enriched at a Bonferroni-corrected P value < 0.05 (Table 3A), including responses to bacteria and biotic stimuli. When all 80 genes significantly impacted by butyrate at one or more time points were analyzed, biological processes such as responses to bacteria and other organisms were enriched, consistent with the 24 h observation. In contrast, cellular components related to “organelle” were significantly depleted by butyrate infusion when assessed relative to all 15,015 genes expressed in the rumen epithelium with mean mapped reads ≥ 5.0 (Table 3B).
Gene Ontology (GO) terms significantly impacted in the rumen epithelium by butyrate. (A) At 24 h infusion. (B) Collectively in all time points.
Regulatory gene networks
Using a combined stringent cutoff of an error tolerance ε = 0.10 and a P-value threshold of mutual information (MI) at 5.0 × 10⁻¹¹, ARACNE inferred global gene networks with 113,738 direct interactions in the butyrate-epithelium interactome. Top 67 genes controlling >5% of all direct interactions and can be considered as hubs or master regulators (Supplementary File 1). Among these genes, 46 were impacted by butyrate in in vivo and/or in vitro models. Of the 46, 7 were known transcription factors or translation regulators, including CREB binding protein (CREBBP), eukaryotic translation termination factor 1 (ETF1), hypoxia inducible factor 1, alpha (HIF1A), lysine (K)-specific demethylase 5A (KDM5A), regulatory factor X, 2 (RFX2), transcription elongation factor A (3TCEA3), and transcription termination factor, RNA polymerase II (TTF2). The master regulator with the greatest number of direct interactions (or the first neighbors) was ETF1 (ENSBTAG00000011415). The product of this gene acts as an omnipotent protein release factor (RF) and directs the termination of nascent peptide synthesis (translation) in response to termination codons. ETF1 was down-regulated by butyrate in vitro
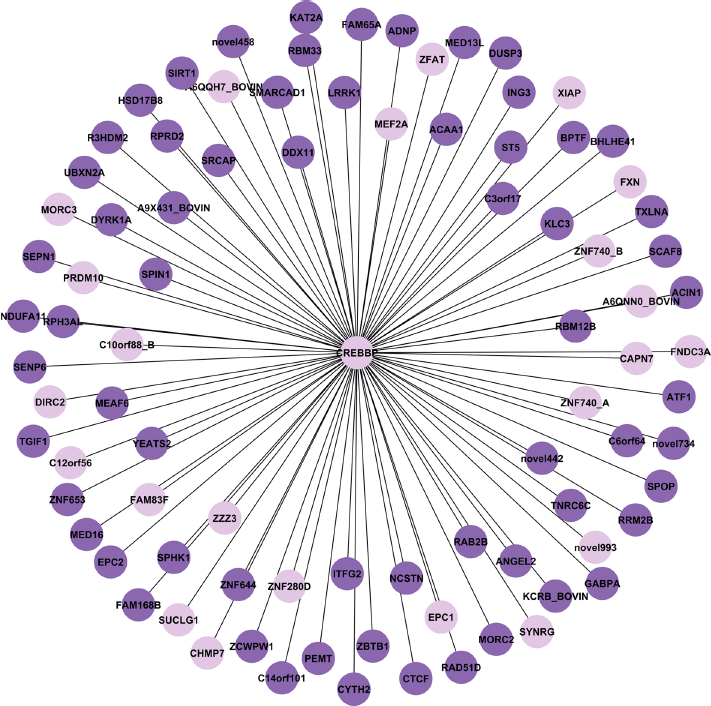
A regulatory gene network controlled by CREB binding protein (OREBBP).
Discussion
Multiple effects of butyrate on local (intestinal) and systemic physiological function are presumably due to its actions as a potent regulator of gene expression.4–6 Butyrate metabolism, both biosynthesis by gut microorganisms and utilization in the gut, is tightly regulated and thus, imbalance could play a critical role in the pathology of humans and animals. Typically, increased production of SCFA, especially butyrate, results in lower luminal pH, which, in turn, creates favorable niche for and stimulates proliferation of butyrate-producing bacteria. 12 In modern intensive production systems used for ruminants, especially during physiologically critical stages, such as weaning and the transition or periparturient period in dairy cattle, high concentrate rations are fed which can result in abrupt increases in SCFA production. This circumstance often results in production in excess of the utilization capacity, subsequently leading to the development of ruminal acidosis, a prominent digestive disorder with a significant economical impact.27,28 Individual variation in the capacity for uptake of acetate and butyrate among animals fed the same rations can explain the degree of acidosis observed. 29 In fact, considerable effort has focused on development of practical nutritional intervention strategies for use during transition periods to enhance rumen epithelial surface area prior to the introduction of high VFA producing rations to facilitate better absorptive capacity and mitigate negative effects of acidosis. 30 To date, these strategies have yielded mixed results with respect to increasing papillae surface area and total absorptive capacity (Andersen, personal communication). The development of a better understanding of the regulation of both rumen epithelial growth promotion and VFA transport capacity remains a concern to the industry. 29 In this study, we assessed the rumen epithelial transcriptome dynamics when butyrate concentration was elevated due to direct ruminal infusion with buffered butyric acid in order to assess transcriptional effects of butyrate and its potential role in regulating butyrate transport in cattle.
The majority of our knowledge on regulatory impact of butyrate on global gene expression is derived from in vitro studies and observations.6,31,32 However, caution in interpretation of in vitro data and application of knowledge gained in vitro to in vivo models is warranted. SCFAs, such as butyrate, are known to promote rumen development and stimulate the proliferation of rumen epithelial cells in vivo. 33 However, butyrate inhibits the proliferation of epithelial cells of the large intestine, rumen and kidney by down- regulating genes controlling cell proliferation in vitro.2,32 Butyrate also induces apoptosis and differentiation of tumor cells.34,35 Moreover, an in vitro study of epithelial cells of different origin (rat small intestine vs. human colon) has demonstrated that the cell type affects butyrate uptake characteristics. 36 In fact, opposite effects of butyrate are observed for many cellular processes, such as cell proliferation and division, between in vitro and in vivo models and are clearly reflected in transcriptome characteristics.33,37 A number of genes related to cell proliferation and cell cycle progress were significantly down-regulated by a 24-h 10 mM butyrate incubation of established bovine rumen epithelial cells in long-term culturing (Wu et al 2012, personal communication). In contrast, expression of these same genes in the rumen epithelium in the present data set was not altered despite a 2-fold increase from 19.5 mM to 38.5 mM in intraruminal butyrate concentration (Fig. 1). Interestingly, the abundance of a butyrate transporter, SLC5A8, in the rumen epithelial transcriptome was significantly reduced concomitant with intra-ruminal butyrate concentration increases. However, SLC5A8 expression at the mRNA level was significantly increased ~21 fold by butyrate exposure in vitro (Fig. 3). This apparent opposite effect of butyrate on the expression of its transporter is suggestive of alternative regulatory mechanisms relating to butyrate uptake control and transport by the intact rumen epithelium and cells in culture. Moreover, cellular butyrate metabolism may be different between in vivo and in vitro models due to changes in the rate of removal of end product as well as changes between cell-cell interactions and micro-environments present in vivo, but disrupted in vitro. To this point, epithelial metabolism of butyrate, especially the pathways leading to ketogenesis, helps to maintain a butyrate concentration gradient in vivo, which in turn facilitates butyrate uptake and affects butyrate intracellular concentrations. 30 Rate-limiting enzymes in the ruminal ketogenic process, such as acetyl-CoA acetyl transferase (ACAT) and 3-hydroxy-3-methylglutaryl CoA synthases (HMGCS) 1 (cytoplasmic) and 2 (mitochondrial), play an important role in regulating butyrate metabolism at the substrate level. As depicted in Table 4, key enzymes in butyrate metabolic pathways exhibited a different expression pattern between the cell line and the rumen epithelium. As expected, HMGCS2 of mitochondrial origin was significantly up-regulated by butyrate in vitro, in response to increased butyrate concentration. However, expression of HMGCS2 remained unchanged in vivo.
Relative expression of a butyrate transporter, solute carrier family 5 (iodide transporter), member 8 (SLC5A8).
Expression levels of key enzymes involved in butyrate metabolism in the rumen epithelium detected by RNA-seq technology.
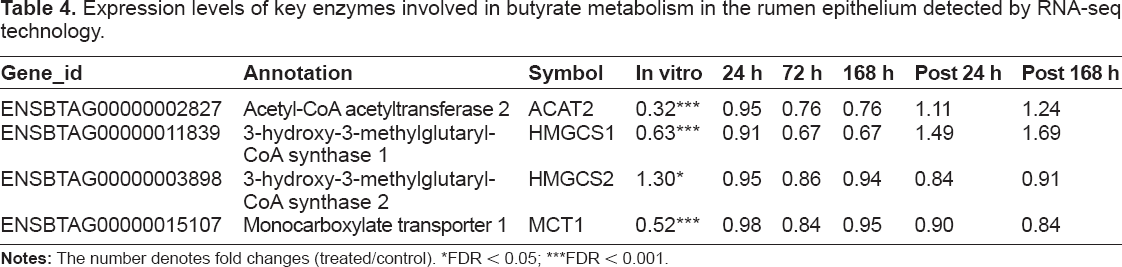
FDR < 0.05;
FDR < 0.001.
The biological interpretation of high-throughput expression data generated using microarrays or RNA-seq technology requires both differential expression and differential network analyses. 38 Many transcriptional regulators exert their impact on biological functions via post-transcriptional mechanisms with subtle or no apparent changes at mRNA expression level detectable by tools for assessing differential expression alone. However, differential network analysis relies on powerful computational tools to extract accurate regulatory gene networks reflecting causal interactions underlying biological processes or phenotypes. Of several algorithms available, those based on information theory, including estimating mutual information values, such as ARACNE26,39 perform well in inferring global gene networks, especially for smaller sample sizes.40,41 ARACNE is based on the assumptions that the expression level of a given gene is a random variable and the mutual relationships between them can be derived by statistical dependences. 42 Our results provided further support for the utility of this approach in constructing regulatory gene networks that depict phenotypes and regulation of biological processes. An example from this current study is the regulatory network controlled by FBJ murine osteosarcoma viral oncogene homolog, or c-fos (FOS), which was significantly down-regulated by butyrate in both in vitro and in vivo models. As a transcription factor, FOS dimerizes with another oncogene JUN to form the AP-1 complex, which regulates transcription of a diverse range of genes and is implicated in many biological processes including cell proliferation and differentiation as well as tumor transformation and progression. In the current data set, ARACNE inferred a network of four direct interactions (1st neighbors) for FOS and 32 indirect interactions (Fig. 4). All four direct interactions, cingulin (CGN), heparin-binding epidermal growth factor-like growth factor (HBEGF), intermediate filament family orphan 2 (IFFO2), and jun proto-oncogene (JUN), were up-regulated by butyrate (at both P < 10–6 and FDR < 10–5). Moreover, of 24 genes in the 2nd neighbors category, all were also regulated by butyrate, including three transcription factors, JUN, upstream transcription factor 2, c-fos interacting (USF2), and REST corepressor 1 (RCOR1). GO analysis identified GO terms significantly enriched in this network, including SMAD binding (GO:0046332 and GO:0070412), SMAD protein signal transduction (GO:0060395), and transforming growth factor (TGF)-β receptor signaling (GO:0007179). FOS binding at the TGF-β1 promoter proximal AP-1 site is required for TGF-β1 production by colon carcinoma cells. 43 Indeed, previous studies have shown that SMAD proteins cooperate with FOS/JUN complex to mediate TGF-β-induced transcription. 44 Thus, ARACNE correctly inferred a direct interaction between FOS and JUN (Fig. 4) as well as interaction between JOS and HBEGF. HBEGF plays a pivotal role in mediating the early cellular response to intestinal injury by serving as a potent cytoprotective factor. 45 Other experimental evidence also provides a strong support of a direct interaction between FOS and HBEGF.45,46
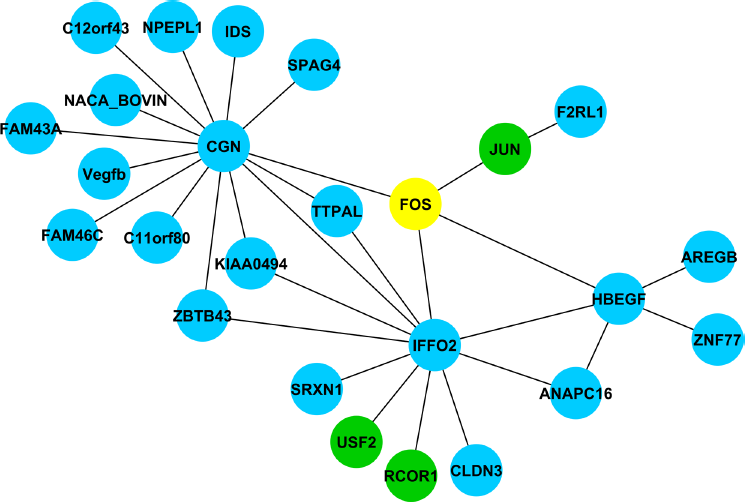
A regulatory gene network controlled by FOS.
Tight junctions between epithelial cells regulate the permeability of molecules via para-cellular pathways as well as bacterial translocation across the gut epithelial layer, thus having the potential to strengthen intestinal barrier function and being involved in intestinal pathology. 47 In addition to cingulin that was induced by butyrate, at least 16 other tight junction related genes were regulated by butyrate in vitro. A strong up-regulation of the major macromolecular components, such as claudins (CLDN1, CLDN3, CLDN4, CLDN7, CLDN12, and CLDN23), tight junction protein 3 (TJP3), and junctional adhesion molecules 2 and 3 (JAM2 and JAM3), by butyrate supports the contention that these genes may play an important role in maintaining and/or restoring intestinal barrier function. Indeed, evidence indicates that probiotics, such as Lactobacillus plantarum MB452, enhance intestinal barrier function via increasing expression of genes encoding proteins involved in tight function formation. 48 It is known that elevated ruminal butyrate results in a profound change in the ruminal microbial composition, including a potential stimulating effect on butyrate-producing bacteria. 12 It is foreseeable that an elevated concentration of butyrate in the lumen of the gut could play a regulatory role in the maintenance of intestinal barrier function via the expression of genes involved in tight junctions. Our future work will include experimental verification of the global regulatory gene networks inferred by computational tools.
Author Contributions
Conceived and designed the experiments: RB, RL. Analysed the data: RB, SW, WL, CL, RL. Wrote the first draft of the manuscript: RB, RL. Contributed to the writing of the manuscript: RB, SW, WL, CL, BB, RL. Agree with manuscript results and conclusions: RB, SW, WL, CL, BB, RL. Jointly developed the structure and arguments for the paper: RB, RL. Made critical revisions and approved final version: RB, SW, WL, CL, BB, RL. All authors reviewed and approved of the final manuscript.
Footnotes
Acknowledgements
SW and WL were supported by Award R01HG005978 from the National Human Genome Research Institute (NHGRI), Award R01RR025030 from National Center for Research Resources (NCRR), and CAMERA project funded by Gordon and Betty Moore Foundation. The content is solely the responsibility of the authors and does not necessarily represent the official views of the NHGRI, NCRR or the National Institutes of Health. Mention of trade names or commercial products in this publication is solely for the purpose of providing specific information and does not imply recommendation or endorsement by the U.S. Department of Agriculture.
As a requirement of publication author(s) have provided to the publisher signed confirmation of compliance with legal and ethical obligations including but not limited to the following: authorship and contributorship, conflicts of interest, privacy and confidentiality and (where applicable) protection of human and animal research subjects. The authors have read and confirmed their agreement with the ICMJE authorship and conflict of interest criteria. The authors have also confirmed that this article is unique and not under consideration or published in any other publication, and that they have permission from rights holders to reproduce any copyrighted material. Any disclosures are made in this section. The external blind peer reviewers report no conflicts of interest.