
Abstract
Much is known regarding the structure and logic of genetic regulatory networks. Less understood is the contextual organization of promoter signals used during transcription initiation, the most pivotal stage during gene expression. Here we show that promoter networks organize spontaneously at a dimension between the 1-dimension of the DNA and 3-dimension of the cell. Network methods were used to visualize the global structure of
Introduction
In prokaryotes, one of several sigma (σ) factors binds to a promoter upstream of a gene and helps position RNA polymerase during transcription initiation. Though consensus and canonical promoter motifs are frequently referenced in textbooks and the literature, genome-scale surveys have forced a reconsideration of the specific role played by these idealized sequences.1–3 Actual promoters can vary in sequence considerably while still binding the same a, though efficiencies vary several-fold. 4 Collectively these promoter sequences form a footprint in promoter space, defining a regulon of genes responsive to a particular environmental cue or cellular need. Each σ represents a hub, or highly connected node, in the overall gene regulatory network. Our concern in this study is with the structure of promoter variation, specifically the topology of a hub footprint.
Our use of networks to visualize promoter diversity departs from their traditional use in gene regulation research. Putting aside protein interaction networks (PINs), transcriptional interdependencies are visualized using two main approaches: (1) Most common is the gene regulatory network (GRNs), often generated using gene expression data, which conveys information on the realized interdependencies among genes.5–8 Nodes represent genes, and certain of the protein products act as regulators of one or more of the genes in the network. Regulatory relationships are denoted by directed edges between nodes, and global studies of the transcriptome are now commonplace. (2) Studies that explicitly consider promoter diversity focus more on the nature and pattern of variation in the
Here we explore the structure of promoter networks from
We consider the following specific questions: (1) What is the apparent role, if any, of the consensus promoter motif? What is the frequency of predicted promoters in the genome? (2) What is the topological structure of variation across promoter sequences in a regulon of genes, and does this structure vary across regulons? How does the organization of predicted promoter networks compare to that of networks built from random sequence promoters? (3) Do the results suggest a mechanism for promoter evolution?
Experimental Procedures
Promoter sequences
Promoter sequences were obtained from RegulonDB. The RegulonDB database
11
(http://RegulonDB.ccg.unam.mx/) is the primary reference database for the transcriptional regulatory network of
Predicted promoter data files (accessed 5.26.09) contained the base sequence of both boxes (–35 and –10 boxes) and the size in bp of the intervening spacer region, along with promoter positions in the genome. We studied three regulons in detail: σ 24 (799 genes), σ 28 (122 genes), σ54 (151 genes). The large housekeeping regulon σ70 (4010 genes) was added later in the study. Base sequence information included: σ 24 and σ54, 11 bp (6 bp of –35 box, 5 bp of –10 box); σ 28 , 15 bp (7 and 8 bp, respectively); and σ70, 17 bp (9 and 8 bp, respectively). Alignments used were as provided by RegulonDB.
Power-law scaling of promoter abundances
We used Perl script to survey the
where
and the scaling exponent as γ = α + 1 such that

Predicted promoter networks
Sequence and spacer information were used to calculate
Random promoter networks
Random promoter networks were generated for Monte Carlo tests by forming a set of
Network extractions using thresholding
Subgraphs were extracted using serial thresholding, or affiliation-based extraction,
16
performed as follows. For
Monte Carlo tests
We used Monte Carlo randomizations to compare the node and edge counts of the LCCs obtained from the predicted promoter networks with their random counterparts through a series of
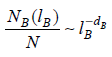
Estimating the fractal dimension
Song et al
17
showed how to measure the fractal dimension in a network by implementing the standard box covering method as a network coloring problem. In brief, for a given box length
Results and Discussion
Power-law scaling of promoter abundance
Consensus sequence promoter motifs were not present in the predicted promoter sets from RegulonDB, and were rare or absent in the
A subsequent survey of the full predicted promoter sets against the
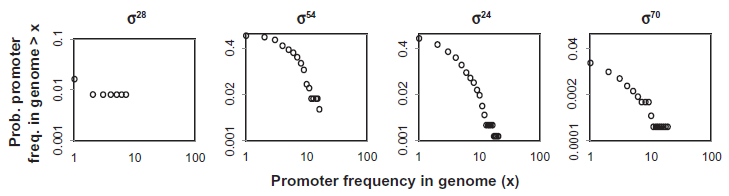
Promoter frequencies in genomes: Log-log plots of complementary cumulative distribution functions for occurrences of promoter motifs in the full genome: σ
28
(
These findings support the growing view that consensus and canonical promoter motifs generally play an indirect role in genome evolution. That they rarely participate directly in transcription has been attributed to the fact that they bind σ too firmly, preventing promoter clearance and elongation, and that there is functionality in a weak promoter that can be modulated with compensatory regulators.1,2,4,19–21 And in many cases promoters appear to be chimeric combinations of canonical and non-canonical binding sites.1,22 supporting the view that ‘perfect promoters are not biologically relevant’. 1 We accept this sentiment insofar as it conveys the fact that consensus promoters actually perform little of the transcriptional work in the cell. We nuance this perspective by suggesting that the ideal consensus promoter represents the optimal DNA-protein binding chemistry and therefore serves as an organizing principle for the evolution of the transcriptional grammar and of the resultant topologies seen in the promoter networks described in this study.
Phase transitions in promoter networks
Serial extractions revealed phase transitions in the promoter networks (Fig. 2) at positions predicted by percolation theory (Fig. 3). The unreduced promoter networks were highly dense (> 0.999), occluded by numerous weak edges representing the sharing of few bases. Thresholding provided targeted windows of lowered edge density through which we examined attributes of the LCCs.
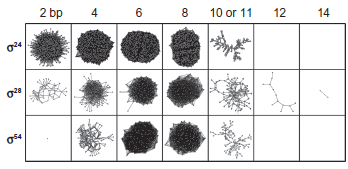
Largest connected components following extractions of x-section by thresholding of three
A phase transition is an abrupt change in the state of a system associated with incremental change in a system parameter, such as the shift with temperature between liquid and gas phases described by van der Waals.
23
In networks, as edges are added (removed) randomly to a graph, there is a sudden increase (decrease) in global connectivity with emergence (fracture) of a giant component, a connected component containing at least half of the nodes.
24
In a random graph of
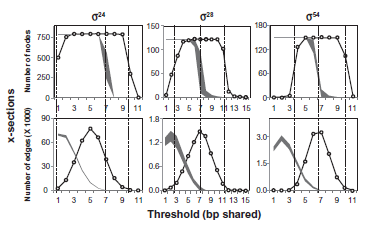
In Figure 3, we indicate the positions of the phase transitions expected from percolation theory in our plots of node and edge numbers. In each case, an expected phase transition is marked as a vertical dashed line positioned at the edge density
Topology of promoter networks
Whereas the LCCs from lower thresholds were fairly homogeneous and dense, containing numerous edges representing low-value bp-sharing, the LCCs emerging from the upper phase transition displayed considerable structural complexity. These network nuclei represent a significantly constrained limiting similarity among promoters as they contain information on high levels of bp-sharing among many of the promoters in the regulon. Monte Carlo tests showed that LCCs built from RegulonDB promoter sets contained significantly higher-valued edge weights than those of random promoter networks (Fig. 3).
The network nuclei have a fractal topology, as implied by their self-similar appearance (Fig. 4). LCCs captured from the upper phase transition were evaluated using the method of Song et al
17
who showed how to measure the fractal dimension of a network by implementing the standard box covering method as a network coloring problem. In the regulons we examined, the average fractal dimension was
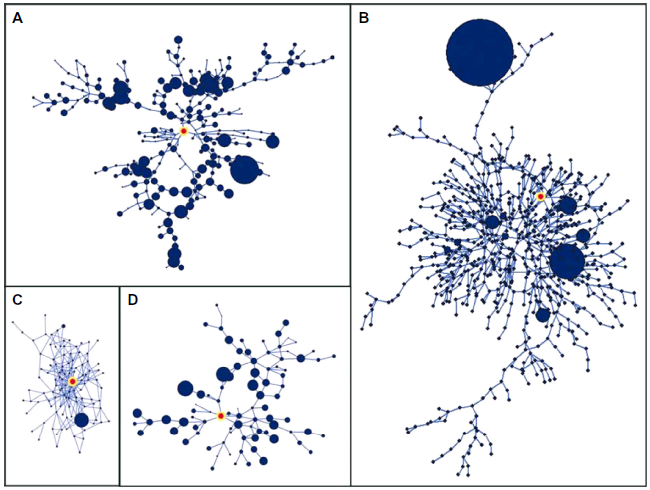
Fractal nuclei of the four regulons captured at upper phase transitions. A) σ
24
,
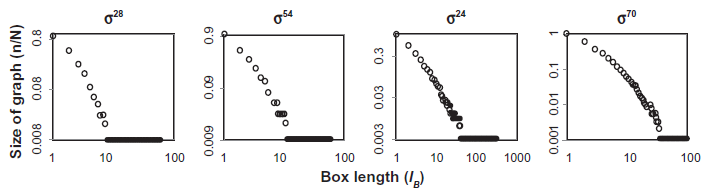
Fractal analysis of the upper phase transition nucleus for the four
Regulons with a highly fractal nucleus did not utilize their consensus promoter in the
DLA model of promoter evolution
These findings, including the mean fractal dimension of
A promoter network growing by DLA would be regulated by both repulsive and attractive forces, mediated on the micro-scale through DNA-protein binding chemistry, and on the macro-scale by population-level fitnesses, all organized around the consensus promoter. The consensus would form an attractor in transcriptional promoter networks because it represents the optimal binding chemistry for a, and departures from the consensus would weaken and eventually eliminate this binding capacity. 4 Yet it appears that the consensus and canonical motifs rarely participate directly in transcription perhaps because they bind a too firmly.2,4,19–21 The resulting lowered population-level fitness would repulse additions from the network center.
These dynamics are analogous to the interatomic attractive and repulsive forces that include the van der Waals interactions. 23 Our interpretation comports with the recent generalization that repulsion is a critical prerequisite to fractal development in most complex networks.27,28
Concluding Remarks
Our results suggest a link between the development of scaling relations in genome structure and function. This correspondence is in part anticipated by the Zipf-Mandelbrot law,29,30 though genome work to date has emphasized frequency (structural) scaling without integrating topological (functional) scaling.
Disclosures
This manuscript has been read and approved by all authors. This paper is unique and not under consideration by any other publication and has not been published elsewhere. The authors and peer reviewers report no conflicts of interest. The authors confirm that they have permission to reproduce any copyrighted material.
Footnotes
Acknowledgements
Thanks to J. Collado-Vides and RegulonDB for use of their promoter resources; NetworkX for its computational tools; C. Song and colleagues for their fractal method; J. Nadolski and L.A. Smith for comments; T. Mikesell for Perl advice; and Benedictine University for computer resources.