
Abstract
Functionalities which may be genetically programmed into a bacterium are limited by its range of possible activities and its sensory capabilities. Therefore, enhancing the bacterial sensory repertoire is a crucial step for expanded utility in potential biomedical, industrial or environmental applications. Using microarray and qRT-PCR analyses, we have investigated transcription in
Introduction
Programming complex behavior in bacteria requires the construction of synthetic sensory, logic and effector circuits.1–3 The ability of genetic logic circuitry to compute interesting and useful behaviors is limited by the sensory repertoire of the cell, which historically has been restricted to molecular sensors such as those for nutrients, nutrient analogs, metals and selected small molecules. Noticeably missing from this list is the bacterial equivalent of an “attachment” sensor that might be activated upon binding to a recognizable substrate.
Fimbriae are long, thread-like surface structures present on several bacteria which enable them to adhere to and colonize specific host tissues. Many gram negative bacteria, including a majority of
A substantial amount of literature suggests that sensing systems are activated when individual
Differential display analysis of the related PapG-mediated fimbrial adhesion of a uropathogenic
We have used both microarray analysis and quantitative RT-PCR (qRT-PCR) to analyse the
Earlier studies pertaining to fimbrial-mediated
Experimental Procedures
Bacterial strain and growth conditions
Expression of the
Small scale binding assay and microscopy
Approximately 250 µl of cells from a mid-log phase culture was added to 40 µl of mannose agarose beads (Sigma Cat. no. M6400) in a 1.5 ml microfuge tube and these tubes containing the bacterial culturebead suspension were rotated at 360 degrees for 30–40 minutes at 25 °C using a Barnstead Labquake tube rotator (Thermo Scientific Inc.). The microtubes were allowed to stand for a minute (to let the beads settle under gravity) followed by removal of the supernatant (consisting of cells that were either unattached or loosely attached to the beads). The settled beads were washed twice with 1 ml LB before resuspending in 200 µl LB. Forty microlitres of the bead suspension was transferred onto a slide and visualized by phase contrast microscopy at 20 X magnification (Olympus IX81 inverted microscope). Images were collected using Image Pro Plus software (Media Cybernetics). Preliminary experiments revealed that pretreatment of CSH50 cells with 10–20 mM D-mannose was sufficient to block the FimH-mediated binding to mannose agarose beads. Also, addition of mannose to CSH50 cells attached to mannose-functionalized agarose beads resulted in detachment of the bound cells from the beads. These two experiments clearly confirm that the CSH50 cells were specifically attached via the FimH adhesin to the mannose moiety of the agarose beads.
Adhesion assay
Mannose agarose beads were used to bind CSH50 cells while Ni2+-NTA agarose beads (Qiagen Cat. no. 30210) were used as the corresponding negative control. Large-scale adhesion assays were performed in disposable Econo-Pac chromatography columns (BioRad, Cat. no. 732–1010; 1.5 × 12 cm). These columns are pre-fitted with a porous 30 µm filter that helps retain the beads and any attached cells, while allowing unattached cells to flow through. Approximately 8 ml bead slurry was poured into a column to give a settled bead volume of 4 ml.
Cell cultures for each assay were initiated by inoculating 50 ml of LB plus appropriate antibiotic with 1 µl of a saturated CSH50 culture and grown overnight at 37 °C with 50 rpm to an A600 of 0.4 prior to being added to columns containing beads. Specifically, 10 ml aliquots from the same culture were added either to a column containing mannose agarose beads (the bound condition) or to a column containing Ni2+-NTA agarose beads (the unbound condition) and incubated at room temperature (approximately 22 °C) with gentle rotation for one, four or eight hours. Following incubation, the column containing mannose agarose beads was drained of LB medium under gravity to remove unattached cells prior to elution of the bound cells. The unbound cell fraction was eluted from the other column (with Ni2+-NTA agarose beads) by draining. In order to elute cells bound to the mannose-agarose beads, 5 ml of plain LB medium was added to the column, vortexed for 30 sec and drained. Eluted cells from each condition were immediately collected in 1.25 ml of cold stop solution (5% water-saturated phenol, pH 7.0, in ethanol) for RNA isolation.
CSH50(WMHis6) cells were treated similarly except that they were incubated with Ni2+-NTA agarose beads (bound condition) and Ni2+-NTA agarose beads treated with NaOH-EDTA solution to remove coordinated Ni2+ (unbound condition). Cells bound to Ni2+-NTA agarose beads were detached by addition of 5 ml LB medium supplemented with 500 mM imidazole, following which the cells were immediately eluted. The corresponding unbound cell fraction was obtained by simply draining the column with stripped NTA agarose under gravity. Eluted cells were immediately treated with cold stop solution as above and RNA was extracted as below.
RNA extraction
A three ml aliquot of eluted cells was centrifuged at 13,000 rpm for 1 min and the supernatant was discarded. RNA was extracted using the MasterPure RNA purification kit MCR 85102 (Epicentre Technologies, Madison, WI) according to the manufacturer's instructions, with slight modifications to optimize yield and purity. Prior to treating with DNasel, total nucleic acid was quantified by spectrophotometry on a NanoDrop ND-100 (NanoDrop Technologies Inc. Wilmington, USA) and 20 µg of nucleic acid from each sample was treated with 20U of DNasel for one hour. RNA integrity was assessed using the Agilent 2100 Bioanalyzer (Agilent Technologies, CA). The A260/280 for all RNA samples was in the 2.0–2.15 range while the 23S/16S RNA ratios were between 1.2 and 1.4 with RNA integrity numbers (RINs) between 7.8 and 8.3. RNA from all samples was diluted to 500 ng/µl before being used for microarray or quantitative real time PCR.
Microarray analysis
Custom microarrays were printed at the University of Alberta Molecular Biology Services Unit (MBSU) microarray facility using Corning Epoxide slides (for more information, see http://www.biology.ualberta.ca/facilities/mbsu/). The Operon
A Genisphere Array 900MPX Expression Array Detection Kit was used to produce Cy3 or Cy5 labelled cDNA as per the manufacturer's instructions. Briefly cDNA was produced by reverse transcription of 2–3 µg total RNA using random hexamers (included in the kit), then poly T-tailed with terminal deoxy-transferase. A bridge oligo was used to associate and then ligate specific capture sequences to the T-tailed cDNAs. Different bridge oligos are associated with a sequence that is complementary to either Cy3- or Cy5-labelled dendrimers. Thus one of the cDNAs (e.g. for “bound” cells) was ligated to a Cy3-specific capture sequence while the other (e.g. for “unbound” cells) was ligated to a Cy5-specific capture sequence. The two cDNA: capture sequence fusions were mixed, placed on a BSA-blocked microarray, covered with a 54 mm LifterSlip (Erie Scientific Company, Portsmouth, USA) and hybridized overnight at 60 °C in a humidified chamber. Separately, cDNAs with dye-swapped capture sequences were also prepared and similarly hybridized to another microarray.
The next day the LifterSlip cover slip was gently removed in 2X SSC, 2% SDS and successively washed for 5 min. in 2X SSC, 2% SDS then 2X SSC and finally 0.2X SSC by serial transfers in disposable Coplin jars. Slides were dried by placing label-side down in a disposable Coplin jar with an absorbent disc in the bottom and spin-dried at 3000 rpm for 3 min. A Cy3/Cy5 dendrimer mixture was then hybridized to each array for 4 h at 60 °C followed by washes and spin-drying as above. Microarrays were scanned at 5 µm/pixel resolution in an ArrayWorX biochip reader (Applied Precision) using GenePix 6.0 (Molecular Devices Corporation). Independent microarrays conducted after different time intervals using the original RNA and RNA samples extracted from independent biological replicates gave us similar results indicating that microarrays and the binding assays were performed under reasonably reproducible conditions.
Statistical analysis of microarray data
Separate GAL files were used to process each repeat block on a microarray. This gave a maximum of 12 data points for each gene (2 experiments X 2 arrays for each dye orientation X 3 replicates per array). Negative control (empty, buffer only or random negative control oligos) and poor-quality spots were filtered from the data and result files were transferred to Excel (Microsoft Inc.). The data were scaled so that the average Median of the Ratios for the total spots in a single replicate block was 1.000. A two-tailed, unequal variance Student's t-test was performed comparing the distribution of the data points for a single gene to that of all genes. The data set was then sorted in order of ascending
Quantitative RT-PCR
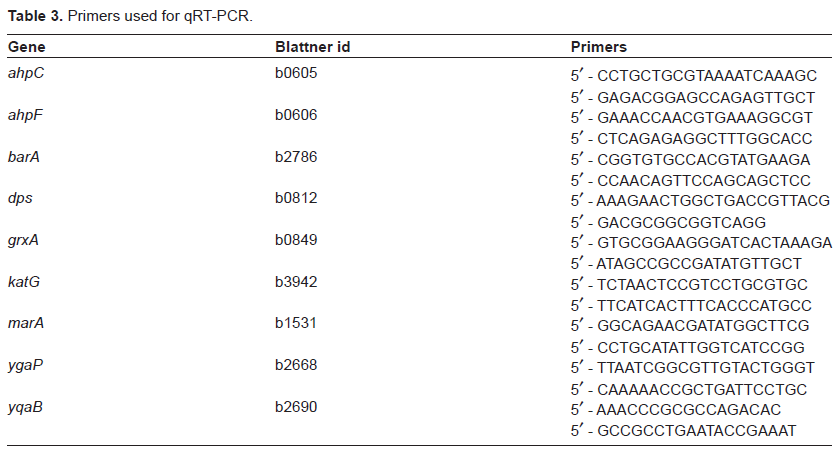
cDNA was synthesized from 4 µg total RNA using Superscript III and random hexamer primers (Invitrogen). Gene sequences were obtained from the Regulon DB V5.7 database (http://regulondb.ccg.unam.mx/index.html) and were used to design qRT-PCR primers (amplicon size 70–80 bp) using Primer Express 2.0 (Applied Biosystems, USA). Primers were purchased from Integrated DNA Technologies, Canada. The genes that were validated as well as the primers used in these experiments are listed in Table 3. The qRT-PCR was performed with 1X SYBR Green master mix [Tris (pH 8.3), KCl 50 mM, MgCl2 3 mM, 0.8% glycerol, 0.01% Tween 20,2% DMSO, 0.2 mM dNTPs, ROX (passive reference dye), SYBR Green, 0.03 units/µl Platinum Taq] in a 10 µl reaction volume. The reactions were carried out in 96-well plates using the ABI 7500 detection system (Applied Biosystems) according to the manufacturer's instructions. Each reaction comprised 2.5 µl cDNA, 2.5 µl of primer (1.6 µM each) and 5 µl of 2X SYBR Green master mix. The initial denaturation time was 2 min at 95 °C, followed by 35 cycles of 95 °C for 15 sec, 60 °C for 1 min. Following PCR amplification, a dissociation curve was run to examine the amplification specificity. A portion of the cDNA was diluted to 1/4, 1/16, 1/64, 1/256, 1/1024 and 1/4096 and 2.5 µl of each dilution was used for primer validation and determination of optimal template dilutions. Relative expression levels were estimated using the comparative critical threshold (∆∆Ct) method (RTT = 2(∆Ct sample – ∆Ct reference condition)). 15 The gene (
Construction of histidine tagged versions of FimH
pBSDelZ is pBluescript KS(+) with the 18 N-terminal residues (from the start of LacZ translation to the
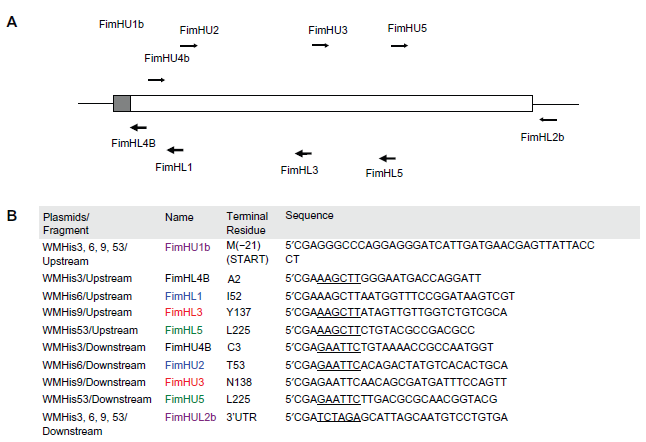
Cloning histidine-tagged
Each plasmid was constructed by first cloning the “upstream” fragment into pBSDelZ between the
Constructs were verified by sequencing, before mobilizing them into CSH50 chemically competent host cells. Single colonies were picked to initiate cultures in LB medium and 200 µl of early log phase cultures (OD600 = 0.3) tested for their ability to bind Ni2+-NTA agarose beads. Glycerol stocks were made from cultures verified to be able to bind to the beads and were used for subsequent microarray and qRT-PCR experiments.
Results and Discussion
The desire to identify the response mechanism used by
Microarray analysis of the transcriptional response to fimbrial-mediated adhesion
A single CSH50 mid-log phase culture was subdivided into two aliquots. One aliquot was incubated with LB-equilibrated mannose-agarose beads for one hour (bound cell fraction) while the other aliquot was similarly incubated in an equal volume of LB-equilibrated Ni2+-NTA agarose beads (unbound cell fraction). Comparative microarrays were prepared from concentration-normalized RNA extracted from the bound and unbound cell fraction. Following filtering of negative control points and poor quality spots, median of ratio data within each replicate were normalized to a mean of 1.0 and a two-tailed Student's t-test was calculated comparing data for each gene to the entire microarray set.
At a 0.01 level of significance and a 1.5 fold cut-off for change in transcript ratio, 42 genes were found to be differentially expressed (Table 1). Twelve genes were up-regulated by 2-fold or more while, of the remaining 30 affected genes, 22 were up-regulated by 1.5–-less than 2 fold and the rest were down-regulated. All the members of three operons (
Differentially expressed genes (≥1.5-fold) in

Gene names according to Regulon DB V5.7 database (http://regulondb.ccg.unam.mx/index.html).
Rank position; 1 = most up-regulated gene in attached cells, –- 1 = most down-regulated gene in attached cells.
Function description according to EcoCyc and Cybercell databases, supplemented by specific literature searches.
Changes in genes related to protective metabolism were analyzed using the Biocyc Pathway Tools version 11.5 (http://biocyc.org/expression.html). Genes belonging to three pathways (assimilatory sulfate reduction I, glutathione-dependent formaldehyde degradation, and removal of reactive oxygen species) exhibited increased transcription, suggesting that cells increase their anti-oxidant and related activities significantly upon fimbrial adhesion.
A total of five transport-related genes (
Redox responsive regulons were affected
In order to determine the underlying pathways that may be responsible for the changes in gene expression in cells bound to mannose-agarose beads, we analyzed the total set of 42 affected genes using regulatory data from RegulonDB V6.3.
20
The results are shown in Figure 2. Of the twelve genes that were up-regulated 2-fold or more, the regulation of only six has been studied in detail. Three of these (
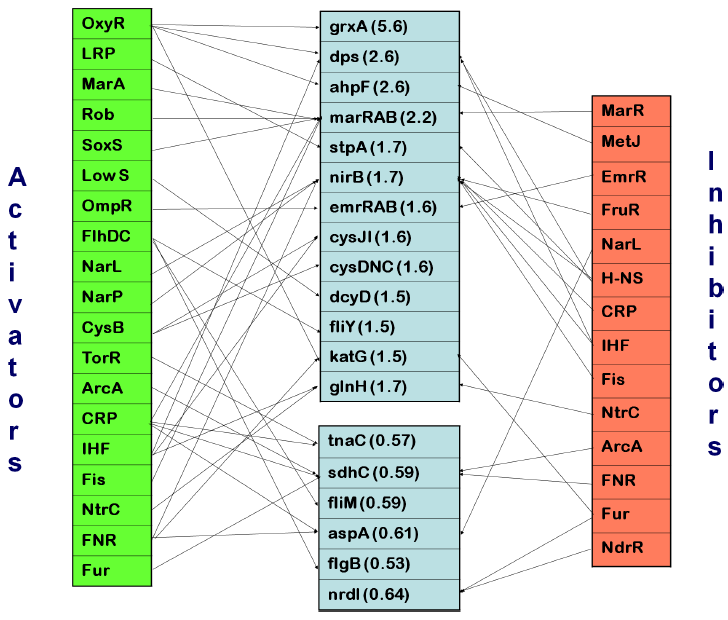
Regulation of genes affected by fimbrial adhesion. Genes with altered transcription levels are shown in center boxes with average fold-increase or decrease (according to microarray analysis following one hour of binding) shown in parentheses. Regulators are connected by arrows to genes which they regulate; activating regulatory factors are shown on the left while inhibiting factors are shown on the right. The differentially altered genes were analyzed using regulatory data from RegulonDB V6.3.
The OxyR regulon also includes
The regulation of 14 of the remaining 22 upregulated genes has been well studied so far. Six of these are activated by low levels of cytoplasmic sulfur;
The regulation of 6 of the 8 down-regulated genes has also been well documented. Four of these are regulated by one or more of, CRP, FNR and ArcA, which are all responsive to the cellular redox state. The remaining two down-regulated genes are flagellar components and are governed by the flagellar master regulator, FlhDC.
It was somewhat unexpected that the fimbrial adhesion response seemed to activate or alter genes associated with metabolic activities as opposed to cell surface or cell structure genes. However, tight attachment of cells to a substrate results in their relative immobilization and shields a substantial part of their surface area, likely having some metabolic consequences. Also, a partial loss of cell mobility and the reduction in accessible surface area possibly reduces the cellular capacity to absorb nutrients and oxygen from the media. These events are likely to be the reason that most of the differentially expressed genes were mapped to metabolic pathways which may mediate downstream events following attachment.
Transcriptional changes verified by qRT-PCR
In order to verify our microarray results, we performed quantitative RT-PCR (qRT-PCR) for selected transcripts. RNA was isolated from bound and unbound cell fractions of three independently performed binding assays and used to amplify cDNA using a set of random hexameric primers that was different from the one used for microarray experiments. The fold-changes for selected transcripts obtained using qRT-PCR were in agreement with those obtained previously with our microarray experiments and the induction ratios derived from qRT-PCR assays generally exhibited higher magnitudes (Table 2).
Comparison of transcript fold ratios analyzed by qRT-PCR and microarray.
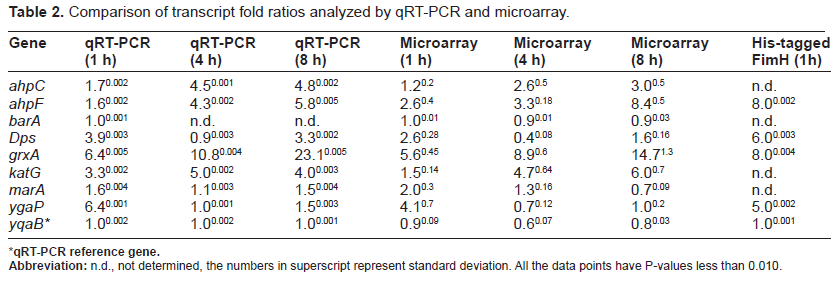
qRT-PCR reference gene.
Primers used for qRT-PCR.
Time series analysis of response
In a separate experiment, we also measured the transcriptional responses after one, four or eight hours of fimbrial attachment to mannose-agarose beads using both microarrays and qRT-PCR. Transcriptional responses at each interval were analyzed independently using two microarrays, containing three replicate blocks each and incorporating dye swaps between the arrays. Identical filtering and statistical analysis was carried out as for the one-hour interval. Both qRT-PCR and microarray data reflect similar changes in expression levels of affected genes over these intervals (Table 2). The consistency of the transcriptional data over several time points suggests that we have correctly identified the primary responses. However, after four and eight hours, a number of secondary responses were also engaged and will be analyzed separately (manuscript in preparation).
Genes under the direct control of OxyR (
Comprehensive DNA microarray studies have been previously performed to generate an insight into processes accompanying
CSH50 cells with His-tagged FimH bind robustly and specifically to Ni2+-NTA agarose beads
The X-ray crystal structure of the FimH-FimC complex, elucidated first by Choudhury et al [1999] and later corroborated by Hung et al 17 provided definitive evidence of a carbohydrate-binding pocket at the FimH lectin domain. Specifically, residues N46, D47, D54, Q133, N135, D140 and the NH2-terminal amino group of FimH are hydrogen bonded to D-mannose, while 113, Y48, I52 and F142 form a hydrophobic ridge in close association with the mannose-binding pocket.
Based on these studies, we constructed two histidine-tagged versions of FimH, namely WMHis3 (with a hexa-histidine tag inserted after A2 near the amino-terminal) and WMHis53 (with a hexa-histidine tag inserted after the permissive position Q224 near the C-terminal). However, CSH50 cells transformed with either WMHis3 or WMHis53 were unable to bind to Ni2+-NTA agarose beads. We therefore constructed three additional tagged versions of FimH, namely WM2XHis3 (which had two hexa-histidine tags following A2), WM2XHis53 (which had two hexa-histidine tags following Q224) and WMHis6 (wherein a single histidine tag was inserted following residue I52). We observed that CSH50 cells transformed with WM2XHis3, WM2XHis53 and WMHis6 bound to Ni2+-NTA agarose beads, although fewer CSH50(WM2XHis3) and CSH50(WM2XHis53) cells were found to bind as compared to CSH50(WMHis6) cells (Fig. 3a). An average of only 18 cells of CSH50(WM2XHis53) or 55 cells of CSH50(WM2XHis3) bound to every Ni2+-NTA agarose bead. On the other hand, 325 cells of CSH50(WMHis6) bound to every Ni2+-NTA agarose bead which was very close to the positive control treatment (CSH50 cells incubated with mannose-agarose beads), wherein 422 CSH50 cells were found to attach to every mannose-agarose bead (Fig. 3b).
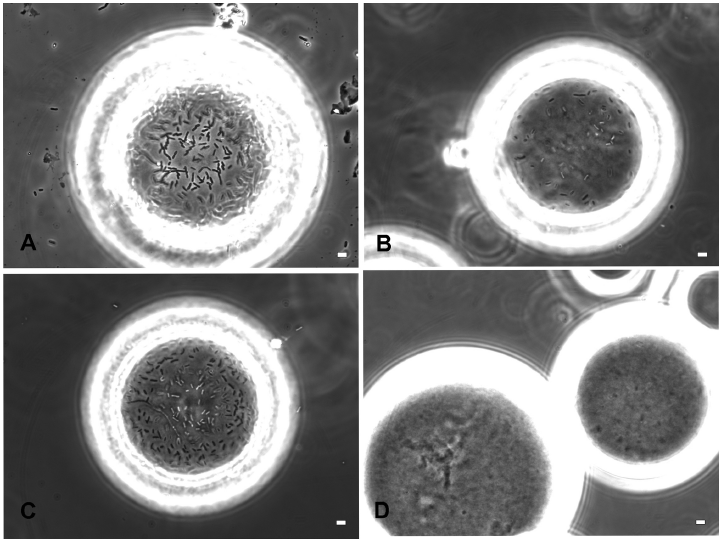
Phase contrast microscopy demonstrating binding of CSH50 cells containing plasmids expressing histidine-tagged versions of FimH. A) CSH50 host cells mixed with mannose agarose beads B) CSH50(WM2XHis3) and C) CSH50(WMHis6) cultured in LBamp50 were mixed with Ni2+-NTA agarose beads for 1 h. D) same as C) followed by incubation with 0.5 M imidazole for 30 sec. These images are representative of the entire population and a total of at least 100 beads were microscopically observed in 4 independent experiments for calculating the efficiency of binding. The scale bar represents 2 µm.
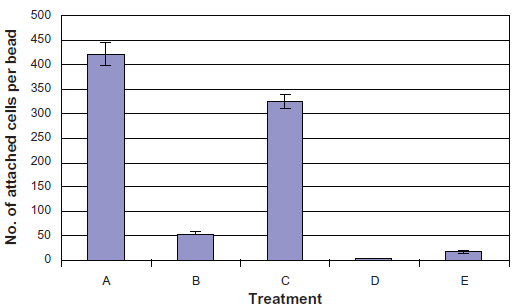
Statistical representation of treatments depicted in figure 3a. Cells bound to mannose/Ni+2-NTA agarose beads were counted using the Image Pro Plus software. Treatments: A) CSH50 host cells mixed with mannose agarose beads, B) CSH50(WM2XHis3) and C) CSH50(WMHis6) cultured in LBamp50 were mixed with Ni 2 -NTA agarose beads for 1 h. D) same as C) followed by incubation with 0.5 M imidazole for 30 sec, E) CSH50(WM2XHis53) mixed with Ni2+-NTA agarose beads. The error bars represent standard deviation.
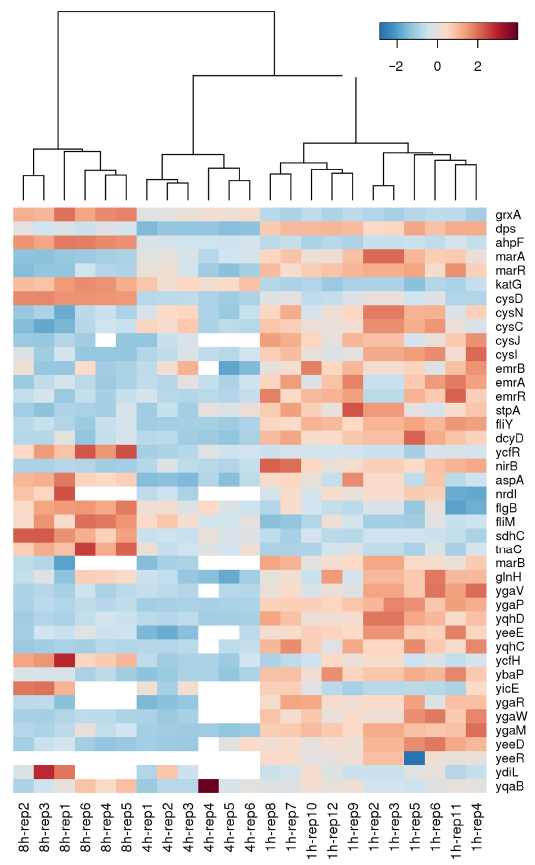
Heat map generated via hierarchical clustering analysis showing differentially altered genes in a temporal manner during
To demonstrate that the binding of CSH50 (WMHis6) expressing a nickel-binding version of FimH was specific, we pretreated these cells with 100 mM free histidine for one hour before incubating them with Ni2+-NTA agarose beads. Binding of histidine-treated cells to Ni2+-NTA agarose beads was abolished. In addition, CSH50(WMHis6) cells bound to Ni2+-NTA agarose beads could be displaced by incubating them for 30 seconds with 500 mM imidazole, a competitive Ni2+ binding agent. Both these experiments demonstrated that the recombinant cells were specifically bound to the Ni2+-NTA beads.
Several reasons could be responsible for the inability of the histidine tags at A2 or Q224 to mediate FimH binding to Ni2+-NTA beads, such as presence of the histidine tags interfering with the correct folding of the binding domain of FimH or significantly altering the number of fimbriae on the cell surface. However, we did not quantify the production of transgenic fimbriae nor the amount of transgenic FimH since our primary objective was to identify permissive positions in FimH for histidine tags that would enable robust binding of transgenic cells to their cognate Ni2+-NTA agarose substrate. Moreover, in previous studies, binding assays were performed under gentle agitation with cells resuspended in defined M63 salts, unlike ours wherein the cells were resuspended in relatively complex LB media and rotated at 360 degrees. Cells transformed with doubly His-tagged versions of FimH could bind much better than single His-tagged versions at the same residues (i.e. A2 and Q224), suggesting that an extra His-tag improved the accessibility of the binding residues in the modified FimH.
Binding of E. coli via His-tagged FimH activates the same transcriptional cascade as observed with FimH binding to mannose
Using qRT-PCR, the transcriptional response of CSH50(WMHis6) cells bound to Ni2+-NTA agarose beads for one hour was compared to that of an unbound fraction of the same cells for a selected set of genes (namely
Fimbrial adhesion and biofilm formation- is there a link?
Biofilms are a community of microorganisms attached to a surface and can form on virtually any biotic or abiotic surface. 29 An integral step in the complex process of biofilm formation is the irreversible attachment to target surfaces and is known to be mediated by adhesive organelles like curli fimbriae and type 1 fimbriae. 30 A wealth of literature has accumulated about transcriptomic changes associated with biofilm formation, primarily on abiotic surfaces.31–34
However, relatively few studies have comprehensively analyzed the transcriptional response of
Although the expression pattern of only a small proportion of the genome was perturbed in our current study, there were several interesting parallels with the expression profiles previously observed during biofilm formation. For example, strong induction of OxyR-regulated genes (such as
Our study also identified several genes with unknown functions to be differentially altered. Microarray analysis of biofilm formation has identified
An important subset of activated genes identified by our study included those with a role in assimilatory sulfur metabolism (i.e.
While early studies on bacterial biofilms suggested that gene expression within these communities is substantially different from a non-biofilm mode of growth,
38
recent DNA microarray based studies24,25,27 suggest that biofilms arise due to a unique overall pattern of gene expression instead of a smaller set of biofilm-specific genes. The similarities in gene expression patterns between FimH-mediated adhesion of
To summarize, this study offers a dynamic glimpse of transcriptomic changes triggered upon subjecting
We compared the transcriptional responses of attached and unattached fimbriated cells and found that the profile of selected genes investigated was similar whether wild-type FimH was bound to a mannose ligand or modified FimH was bound to a Ni2+-NTA ligand. Results obtained using these independently performed experiments gave us enough confidence to believe that the identified genes were indeed altered in response to fimbrial binding and were independent of the particular immobilized substrate. Because we employed two different protocols to dissociate bound cells from the beads (brief vortexing in case of cells attached to mannose-agarose beads versus imidazole displacement for cells attached to Ni2+-NTA agarose beads), we believe that the observed transcriptional response was a result of attachment of cells to the beads and was not due to their detachment.
Our study revealed down-regulation of general metabolism and nutrient import accompanied by upregulation of genes encoding transport systems for antibiotics and drugs, together with induction of a number of genes related to stress responses, specifically those governed by OxyR. A temporal analysis of cells binding to mannose-functionalized surfaces revealed that the transcriptional response was magnified upon prolonged adhesion. We are currently working on further dissecting the response by analyzing the transcriptome at shorter time intervals post-adhesion and functionally validating various genes identified.
Our experiments to engineer recombinant versions of FimH also identified a new permissive position in the FimH sequence (I52) which could be used to insert short peptide sequences without loss of FimH fimbrial assembly and which endowed the transgenic cells with the ability to bind a novel ligand in a complex medium. Similar studies wherein we have engineered another surface protein, OmpA, to bind to novel targets have revealed the presence of a transcriptional response which is distinct from and more pronounced than that observed with FimH-mediated binding (manuscript in preparation). This may partially be explained by the fact that there are only 300–500 fimbriae per cell as compared to over 100,000 copies of OmpA. These results offer exciting possibilities to engineer
Disclosures
This manuscript has been read and approved by all authors. This paper is unique and is not under consideration by any other publication and has not been published elsewhere. The authors and peer reviewers of this paper report no conflicts of interest. The authors confirm that they have permission to reproduce any copyrighted material.
Footnotes
Acknowledgements
The authors would like to thank Tracy Raivio and Graham Banting for their helpful readings of the manuscript and Jeff Xia for his valuable expertise with