
Abstract
Biological network models offer a framework for understanding disease by describing the relationships between the mechanisms involved in the regulation of biological processes. Crowdsourcing can efficiently gather feedback from a wide audience with varying expertise. In the Network Verification Challenge, scientists verified and enhanced a set of 46 biological networks relevant to lung and chronic obstructive pulmonary disease. The networks were built using Biological Expression Language and contain detailed information for each node and edge, including supporting evidence from the literature. Network scoring of public transcriptomics data inferred perturbation of a subset of mechanisms and networks that matched the measured outcomes. These results, based on a computable network approach, can be used to identify novel mechanisms activated in disease, quantitatively compare different treatments and time points, and allow for assessment of data with low signal. These networks are periodically verified by the crowd to maintain an up-to-date suite of networks for toxicology and drug discovery applications.
Introduction
Chronic obstructive pulmonary disease (COPD) is a progressive chronic inflammatory lung disease characterized by persistent limited airflow caused by various environmental exposures such as cigarette smoke (CS), occupational hazards, and air pollution. 1 Mechanisms underlying the disease include a complex interplay of inflammation, proliferation, oxidative stress, tissue repair, and other processes driven by various immune, epithelial, and airway cell types.2,3 Understanding the molecular mechanisms associated with COPD is important for preventing disease onset, slowing down disease progression, and managing treatment. Biological network models offer a framework for understanding disease by describing the relationships between the molecular mechanisms involved in the regulation of a particular biological process. Kyoto Encyclopedia of Genes and Genomes (KEGG) and Reactome are open access pathway databases widely used by the scientific community.4–7 They describe signaling in various areas of biology and can be used to interpret large-scale molecular data through integration and overlay on pathways to assess pathway overrepresentation. In contrast to these general pathway databases, we have developed a set of networks within defined boundaries relevant to COPD that are available to the public on the Bionet website at https://bionet.sbvimprover.com, where they can not only be viewed and downloaded but can also be actively commented on and edited.8,9 These networks can also be used to interpret large-scale molecular data to a fine-grained degree, due to their construction in Biological Expression Language (BEL), a human-readable computable language with the ability to capture precise biological information and associated context (www.openbel.org). The networks were based on a set of previously published lung-relevant healthy biological networks, which along with the most current network versions are available for download at http://www.causalbionet.com/.10–14
To ensure a comprehensive and up-to-date set of biological network models that cover a wide range of biological signaling, crowdsourcing can be used to gather input from the scientific community. Crowdsourcing is a powerful tool to efficiently gather feedback from a wide audience that covers expertise in many biological areas. Crowdsourcing efforts in biology are useful in the collection of creative solutions to challenging problems in various fields of biology such as signaling networks, protein folding, RNA design, and sequence alignment.15–18 Crowdsourcing has also been harnessed to accomplish a large amount of manual work in annotation projects including disease-related genes, interactome pathways, and PubMed abstracts.19–21 We have previously reported the creation of a set of biological networks describing COPD processes that were improved by the scientific community during the first Network Verification Challenge (NVC).8,9 In this study, we show that the networks were further improved during a second NVC (NVC2), in which the crowd added mechanistic details in the form of new nodes and edges.
We illustrate possible network applications for the crowd-improved set of networks using network scoring by TopoNPA, a method to infer mechanism and network perturbation based on transcriptomics data and known activators and inhibitors of gene expression reported in the literature. 22 Quantitative scoring of networks is enabled by BEL, an open platform technology, where cause and effect relationships from the literature are described and annotated using a precise language and collected in a knowledgebase. This knowledgebase is used to predict upstream regulators of measured transcriptomics data. 23 This backward reasoning approach differs from other gene set enrichment approaches using gene sets defined as KEGG pathways or Gene Ontology (GO) classes for example, 24 which make the assumption that RNA expression is equivalent to protein activity. Another limitation of methods such as gene set enrichment analysis (GSEA) 25 is that they do not take direction into account for each gene within the gene set. TopoNPA scoring of networks allows for quantitative scoring of inferred mechanisms and networks based on signed fold changes in the dataset. Using TopoNPA on a set of networks enables quantitative comparison between different compounds, disease subtypes, or other perturbations of interest. 22 We describe here one application for how the improved set of 46 computable BEL-encoded NVC network models can be used by the scientific community for toxicology and drug discovery applications.
Materials and Methods
Biological expression language
BEL is a triple-based language, where statements consist of two biological entities connected by a relationship (for causal statements: cause, relationship, and effect). The BEL framework, including a database of BEL statements and other tools to be used with BEL, is an open-platform technology available for download at http://www.openbel.org/. BEL captures specific entities from chemicals to proteins to biological processes and relationship links that are directional, providing information on activation or inhibition. Statements within BEL are derived from the published literature and are compiled together to express the existing causal knowledge in a graph-based, computable format. These entities connected by relationships are represented as nodes and edges within a BEL graph network and are linked to metadata such as literature support, which contains PubMed ID, tissue, disease, cell type, and species. A BEL node consists of a function, namespace, and entity. The function gives information about the type of entity (eg, abundance and activity), and the namespace is a standardized ontology that defines the entity that each node represents (eg, MeSH, ChEBI, GO, and HGNC). See Supplementary File 1 for a list of BEL functions and namespaces. Just as the networks are continuously improved by the crowd, the BEL language evolves based on suggestions made by the OpenBEL community. Namespaces in the NVC networks version 2.0 reported here were updated from v1.0 BEL Namespaces to the most recent version (v20150611), which includes additional and refined namespaces.
Network Building
Networks were constructed in a three-phase process, as described previously. 8 Briefly, networks were built using data and literature during Phase 1, enhanced with lung- and COPD-relevant mechanisms (represented by nodes in the networks) by the crowd during Phase 2 on the Bionet website (https://bionet.sbvimprover.com/), and discussed during a jamboree meeting during Phase 3 in which the best performers were invited based on their point totals from the online phase. Networks with high crowd activity or interest were selected for discussion during the jamboree. Phases 2 and 3 were repeated in NVC2. Fifteen networks were discussed during the NVC1 jamboree (apoptosis, cell cycle, dendritic cell signaling, growth factor, hypoxic stress, macrophage signaling, neutrophil signaling, NFE2L2 signaling, nuclear receptors, oxidative stress, response to DNA damage, mechanisms of cellular senescence, Th1 signaling, Th2 signaling [Th1-Th2 signaling were merged as a result of the jamboree], and xenobiotic metabolism response) and nine networks were discussed during the NVC2 jamboree (calcium, epigenetics, macrophage signaling, necroptosis, neutrophil signaling, oxidative stress, senescence, Th1-Th2 signaling, and xenobiotic metabolism response). After the NVC2, it was decided to merge the four senescence-related models (mechanisms of cellular senescence, regulation of CDKN2A expression, regulation by tumor suppressors, and transcriptional regulation of the SASP) into one model called senescence. In both NVC1 and NVC2, changes were implemented by the organizers and new versions were uploaded to the Bionet website. The latest versions edited after the NVC2 jamboree are the version 2.0 networks.
Network Statistics
Network statistics and metrics were calculated on the networks presented to the crowd at the start of the NVC (v1.1) and on the most recent networks containing the outcomes of NVC1 and NVC2 (v2.0). Basic network metrics such as number of nodes, edges, activation edges, inhibition edges, and the proportion of inhibition edges were calculated. In addition to these basic network characteristics, the following metrics were computed:
Mean degree: the average of node degrees. This metric informs the overall topology of the network. A low average degree (<2) is typically observed in linear networks.
Max degree: the maximum degree in the network, representing the size of the largest hub.
Mean node betweenness (MNB) or betweenness centrality: the number of shortest paths between pairs of other nodes that go through that node. Nodes with high betweenness centrality are considered as high trafficking nodes. This metric characterizes the centrality of the nodes and hence the topology of the networks (for example, bottlenecks for the paths in the network). A complete graph has a vanishing (=0) MNB.
Largest clique size: the number of nodes in the largest complete undirected subgraph in a network. This number is expected to be low because complete subgraphs that are not triangles are not expected to be biologically meaningful.
Mean path length (MPL): the average of the shortest path length between all pairs of nodes. This metric gives an indication of the density of the network. A low MPL characterizes networks for which the shortest path of causal statements, from one node to another, are made of few edges; for example, in a complete graph, this equals 1. It does not necessarily imply that the mean degree is high. A typical cascading signaling pathway with little feedback would be expected to have a high MPL.
Frustration: the minimum number of edges that should be removed to make the network balanced. Balance in a signed graph is characterized by the property that every path between two nodes has the same sign (the sign of a path is the product of its edge signs). Equivalently, a graph is balanced if and only if every cycle is positive. A negative feedback loop contributes to the network frustration. For example, tightly regulated processes such as cell cycle or apoptosis are expected to have a high frustration metric.
# connected components: number of connected components, that is, the number of disjoint (ie, not sharing any edge) subnetworks within the network.
For all of these network metrics, the differences between the pre-NVC networks (v1.1) and post-NVC2 networks (v2.0) were calculated to understand crowd contribution effects on the networks. For the Th1-Th2 signaling and senescence networks, both of which were integrated from separate networks following jamboree discussions, the individual pre-NVC networks (v1.1) were combined for comparison with the already combined post-NVC2 networks (v2.0).
Datasets Analysis
The three datasets that were analyzed are shown in Table 1.
Dataset overview.
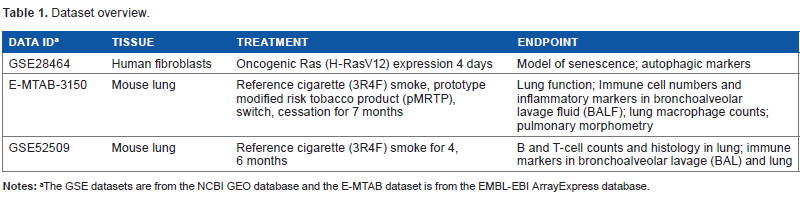
The GSE datasets are from the NCBI GEO database and the E-MTAB dataset is from the EMBL-EBI ArrayExpress database.
Network perturbation amplitude
The Network Perturbation Amplitude (NPA) methodology aims at contextualizing high-dimensional transcriptomics data by combining gene expression (log2) fold-changes into fewer differential node values (one value for each node of the network), representing a biological entity (mechanism, chemical, biological process).22,26,27 A node can be inferred as increased or decreased based on gene expression data, because there are signed relationships (increase or decrease) between the node and downstream mRNA abundance entities.23,27 The differential node values are determined by a fitting procedure that infers values that best satisfy the directionality of the causal relationships (positive or negative signs) contained in the network model, while being constrained by the experimental data (the gene log2-fold-changes, which are described as downstream effects of the network itself).
The differential values of the network are then used to calculate a score for the network as a whole, called the TopoNPA score.
22
For these network scores, a confidence interval accounting for the experimental variation and the associated
Leading nodes are the main contributors to the network score, making up 80% of the TopoNPA score. These nodes can be useful for interpreting the data to predict mechanisms that might be driving the biological process that the network represents. 22
To increase the specificity and relevance of node scores and network scores, we consider only the nodes in the network that are bounded by experimental evidence in the following sense: for any given node, at least one ancestor node (ie, a node from which a directed path to the node under consideration exists) and at least one child node (ie, a node to which a directed path from the node under consideration exists) in the directed graph must have downstream RNA abundance nodes: their values can be directly inferred based on experimental mRNA data. After removing the nodes that do not satisfy the above criteria, the largest connected component is kept (if the resulting network is not connected). Finally, the “causeNoChange” edges are disregarded for scoring. Selections of these simplified networks that have been scored using these criteria are shown in the results.
Results
Network resource comparison
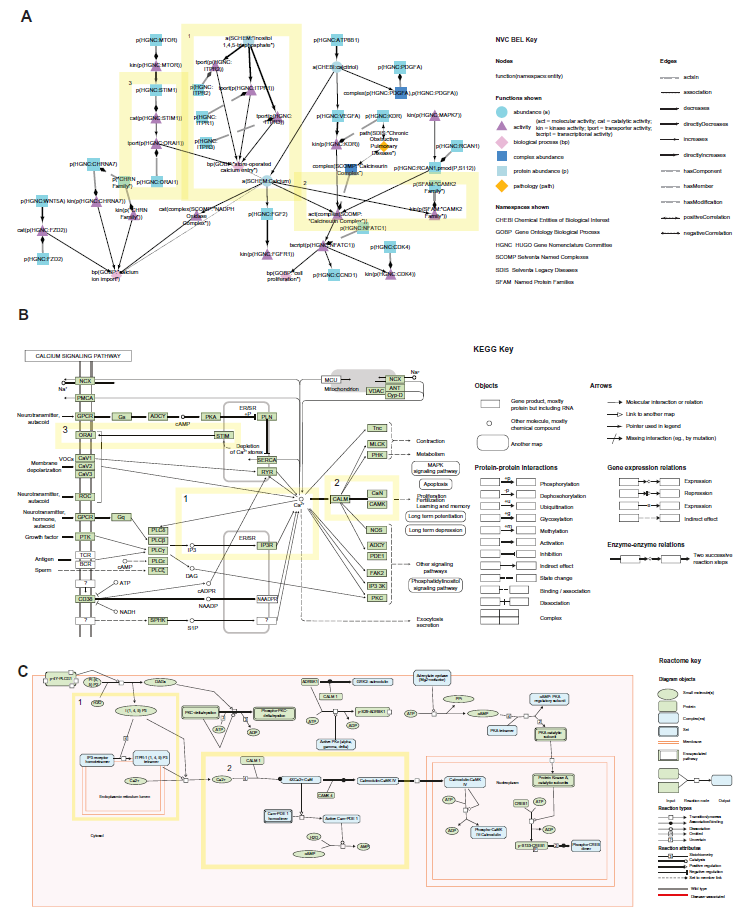
We previously described novel aspects of the NVC networks compared with other network resources.8,9 Herein, we select a particular network, calcium signaling, to further illustrate the differences between the NVC networks constructed using BEL (https://bionet.sbvimprover.com) and the pathways available in the KEGG (http://www.genome.jp/kegg/pathway.html) and Reactome Pathway Databases (http://www.reactome.org) (Fig. 1).
Comparison of the NVC (
Network boundaries
The NVC Calcium Network (v2.0) is an example of a network with similar content and size as the KEGG Calcium Signaling pathway map (map04020) and Reactome Calmodulin pathway (R-HSA–111997.1). All three networks describe the increase of calcium as a result of inositol 1,4,5-triphosphate activation (Fig. 1, box 1 highlighted in yellow) and the role of calcium in activating calmodulin kinase (CAMK) (Fig. 1, box 2 highlighted in yellow). However, the BEL network was constructed specifically to describe calcium signaling that leads to cell proliferation in the lung, while the KEGG and Reactome pathways describe calcium signaling in a more general manner that is tissue agnostic and can lead to proliferation as well as, for example, contraction, metabolism, apoptosis, and exocytosis in the KEGG pathway.
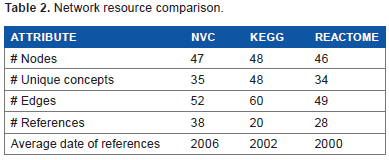
Network resource comparison
The NVC Calcium Network (v2.0) contains 47 nodes (35 unique concepts when genes, proteins, and activity nodes are flattened together) and 52 edges, the KEGG pathway map contains 48 nodes/unique concepts and 60 edges, and the Reactome pathway contains 46 nodes (34 unique concepts) and 49 edges (Table 2). The NVC2 network is supported by 38 unique literature references for specific edges, while there are 20 references for the KEGG pathway and 28 references for the Reactome pathways. There is no overlap in references between the three resources and the average date of publication for the NVC2 references is 2006, whereas the KEGG and Reactome average dates are 2002 and 2000, respectively. The NVC2 and Reactome references support a particular edge, whereas the KEGG references are not specific to a particular edge. The NVC2 network contains multiple node functions such as abundance, activities, and phosphorylations that have been specifically tested in the literature, while the KEGG pathway depicts a single layer of gene symbol nodes that could represent RNAs, proteins, modified proteins, or protein activities. Reactome contains nodes that reflect activities and phosphorylations that can be repeated throughout the diagram to indicate location.
Network resource comparison.
The cellular localization graphics in KEGG and Reactome give a second layer of information, with inositol 1,4,5-triphosphate (IP3 in KEGG, I(1,4,5)P3) in Reactome activating inositol 1,4,5-trisphosphate receptor (IP3R) depicted on the endoplasmic reticulum (ER) membrane, increasing calcium in the cytoplasm (Fig. 1, box 1 highlighted in yellow). From the KEGG and Reactome diagrams, IP3R/IP3 receptor can be inferred to be a calcium channel transporting calcium across the ER, although it is not explicitly stated. In BEL, this relationship is described explicitly in the NVC network as three different family members defined by the HUGO Gene Nomenclature Committee (HGNC) database (http://www.genenames.org/) with transporter activities (tport): tport(p(HGNC:ITPR1)), tport(p(HGNC:ITPR2)), and tport(p(HGNC:ITPR3)) that activate the bp(GOBP:“store-operated calcium entry”) node defined by the GO biological process database. 28 The nodes in the NVC network have more granularity than the Reactome and KEGG networks, specifying the type of activity and particular residues that are phosphorylated.
Along with the IP3 receptor, another process that is described by all three network resources is CAMK activation by calcium (Fig. 1, box 2 highlighted in yellow), although the NVC2 network describes CAMK2 while KEGG and Reactome pathways describe CAMK4 (only obvious for the KEGG pathway after clicking on the node within the online pathway). The final group of overlapping nodes between NVC and KEGG networks include stromal interaction molecular 1 (STIM1) and calcium release-activated calcium channel protein 1 (ORAI1), describing store-operated calcium entry (Fig. 1, box 3 highlighted in yellow), a concept that the Reactome network does not cover due to its focus on calmodulin signaling. Despite the differences in biological content, these networks illustrate the similarities in causal, computational formats and differences in detail and visualization features in the NVC, KEGG, and Reactome networks. The edges in the NVC, KEGG, and Reactome networks are similar in that they can represent causal increase or decrease relationships and can be downloaded for computational use. However, the NVC networks contain more layers of information, with direct causal, indirect causal, correlative, and other noncausal relationships (eg, member, biomarker, and component).
Network crowd verification
Participant feedback
Scientists had many options for engagement during the NVC, including commenting on networks, voting for or against the validity of evidence for specific edges, adding evidence to existing edges, or adding new edges (in order of easiest to most challenging according to a participant survey). The most impactful, but most challenging (and highest point value), action was to add new edges that represented missing biology in the networks. This action required participants to perform a sophisticated set of tasks beyond identifying relevant papers, namely, identify the correct network to include the paper and translate the biology to correct BEL statements in a format that contained direct, mechanistic biology relevant to the boundaries of the particular network. Most participants had expertise in identifying relevant papers that included biology that was missing in the network and overall, participants were able to easily learn BEL and construct correct statements that depicted the biology from the papers they identified. The most challenging task was assembling these statements into direct, mechanistic edges to integrate into the boundaries of a particular network. Participant feedback indicated that improved ways were desired to view networks, particularly to highlight areas of the networks that needed more development. Feedback also indicated that clearer network boundaries were necessary, highlighting the challenges that working with networks entails. With regard to participant engagement, feedback showed that participants were motivated by learning about biology in the networks, the BEL language, and about biological networks in general.
Network changes
The latest version of the NVC networks edited by the crowd during the NVC2 is available as version 2.0 at www.bionet.sbvimprover.com. These networks were changed in various ways throughout the two NVC challenges, as summarized in Figure 2. Networks before the NVC (v1.1) were compared with networks changed at the end of NVC2 (v2.0). Network statistics for each network version are available in Supplementary File 2. The largest amount of new biology in terms of new nodes that was added during NVC2 by the crowd and resulting from the jamboree was to the epigenetics, xenobiotic metabolism response, and calcium networks (Fig. 2). COPD- and lung-relevant contexts were added to the epigenetics and xenobiotic metabolism response networks, and cancer and liver-related contexts, respectively, were removed. In the calcium network, growth factors and smoke-relevant mechanisms that lead to calcium signaling were added, as well as mechanisms of store-operated calcium entry.
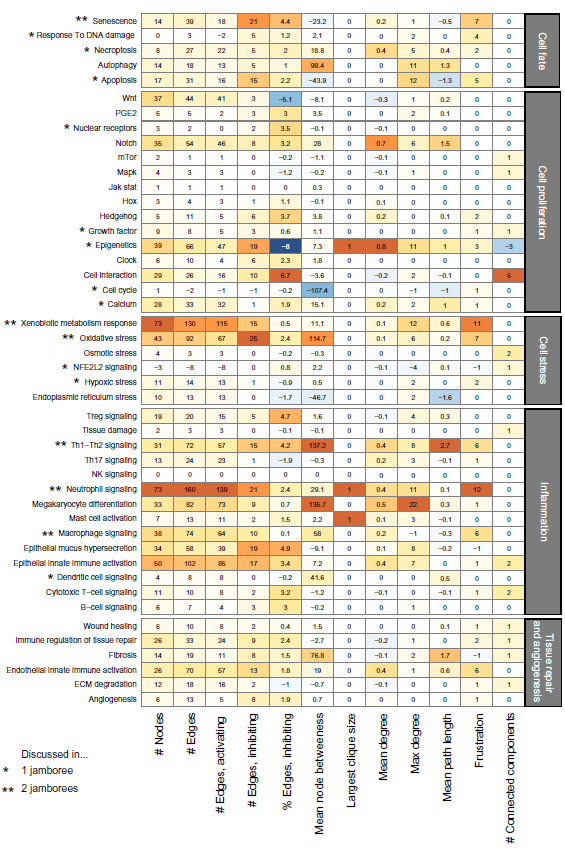
Changes in network statistics as a result of NVC activity. Differences between the latest version of the networks and the original networks have been posted to the Bionet website.
Overall during the NVC1 and NVC2, the size of the networks (number of nodes and edges) grew, as seen in the four left columns of the heat map (Fig. 2). While the total number of edges increased, the proportion of negative edges also increased slightly, with a few exceptions such as Wnt and epigenetics signaling. This increase may reflect the addition of regulatory mechanisms to the networks.
Mean node betweenness (MNB) did not change substantially, with noticeable exceptions for the cell cycle, autophagy, and Th1-Th2 signaling networks. For both cell cycle and autophagy, the number of nodes and edges stayed relatively constant. A difference in MNB may be indicative of a reorganization of the network topology. These networks were all discussed during the jamborees where network topologies could more easily be changed than on a per user basis during the open phase. For Th1-Th2 signaling, MNB went up tenfold from 15 to 152. This may be because these networks were originally two separate networks with linear (tree-like) structures that were then integrated after the jamboree.
The sizes of the largest cliques did not change, which suggests that the crowd did not add feedback loops. A clique of size 3 is a triangle that may be a simple positive or negative feedback of the form A-→B→C→A (A-→B→C-|A, respectively). Most of the networks exhibit this property, while only eight networks have a clique of size 4 or more, the maximum being 5 (neutrophil signaling, after verification). A clique between four nodes implies that the set of nodes all regulate each other; for example, in the epithelial mucus hypersecretion network, the nodes A = cat(p(HGNC:ADAM17)), B = kin(p(HGNC:EGFR)), C = p(HGNC:MUC5AC), and D = bp(GOBP:mucus secretion)) are all related to each other as A→B, C, D; B→C, D; C→D.
The mean degree stayed stable while some maximum node degrees increased (ie, some nodes are stronger
The frustration, representing the complexity of autoregulation of a network, increased in half of the networks. After verification, only eight networks have a decreased frustration.
The number of connected components increased in the following networks (usually from one to two components): mTor, Mapk, Hox, growth factor, cell interaction, osmotic stress, NFE2L2 signaling, epithelial innate immune activation, wound healing, fibrosis, and ECM degradation. However, the ratio of the size of the second largest component to the size of the largest is less than 5% (except for cell interaction 12%, cytotoxic T-cell signaling 15%, and Hox 66%), meaning that, except for the Hox network, the largest components comprise almost all the nodes. The extra components added during network verification may be a starting point for further extending the biggest component. However, in the case of the Hox network, two components describing separated processes are described in the context of this network. Besides the metrics discussed above, a scale-free property (ie, the degree distribution follows an exponential distribution) was tested. None of the networks (v1.1. and v2.0) exhibit a significant scale-free property (Supplementary File 2).
Network applications
Because the networks were constructed in BEL, they can be shared within the scientific community and used to understand data through overlay on to specific pathways of interest or implementing a more global process overview using computational inference approaches. We illustrate a few cases of how the networks could be used in toxicity assessment and drug discovery for network computation using the TopoNPA approach. This approach employs the two-layer network model to infer the activation or inhibition of model backbone nodes based on gene expression data. 22 Using these inferences and the network model topology, TopoNPA computes the perturbation of the network as a whole. The approach differs from traditional pathway analyses, because it is quantitative and it uses backward reasoning instead of assuming that changes in gene expression directly imply changes in protein activity. The comparison of TopoNPA with other methods was described in detail by Martin et al. 22
In vitro treatment effects on transcriptomics data are reflected in TopoNPA network scores
The NVC2 networks were scored on the
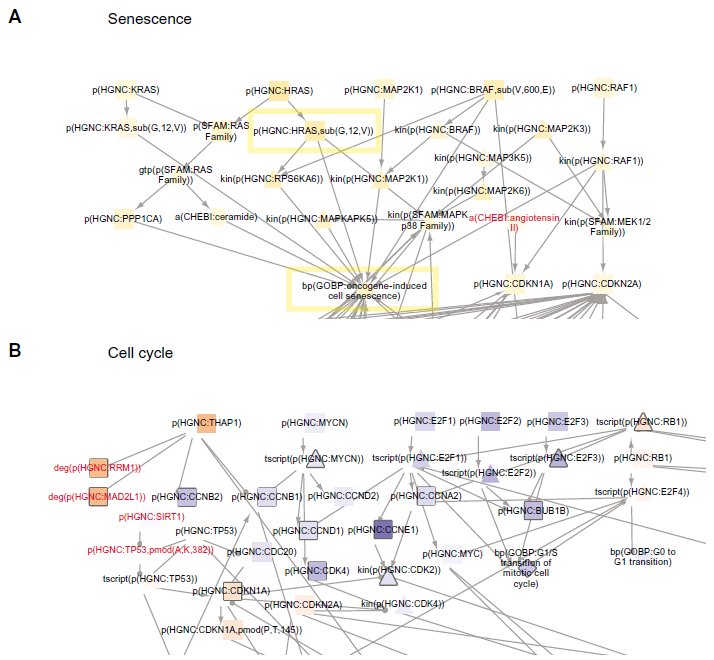
Senescence (
The cell cycle network also had a significant network score with cell cyclins and E2Fs inferred as decreased leading nodes (Fig. 3B, highlighted in yellow), while inhibitors of cyclins and E2Fs (CDKN1A and RB1) were inferred as increased leading nodes (Fig. 3B, highlighted in blue). NVC contributions include RRM1, MAD2L1, SIRT1, and TP53 acetylation, which adds more detail to the role of THAP1 and TP53 in regulating cell cycle. The nodes predicted in the senescence and cell cycle networks are consistent with an expected decrease in cell cycle due to HRASV12 signaling.
Quantification/comparison of toxicity in two related datasets using the network suite
Networks were used to evaluate and compare two recently published mouse lung datasets (E-MTAB-3150 and GSE52509), in order to quantify the effects of different exposures on biological processes at different time points. 30 In the first study (E-MTAB-3150), mice were exposed to CS or aerosol from a prototype modified risk tobacco product (pMRTP). After two months, mice were switched from CS exposure to pMRTP or fresh air (cessation) for an additional five months and compared with mice subjected to CS for the whole duration (seven months). In the study reported in the GSE52509 dataset, mice were exposed to smoke for four or six months. 31
Macrophage signaling is of particular interest in the first study (E-MTAB-3150). The NPA score for the macrophage signaling network significantly increased with smoke exposure for all time points and decreased with switch and cessation (Fig. 4A). This trend matched the measured end points of macrophage count in bronchoalveolar lavage fluid (BALF) and pigmented macrophages in lung tissue (Fig. 4B). 30 Leading nodes within the macrophage signaling network that contributed most to the score are depicted by relative contribution to network scores in Figure 5. The Il1r1 protein and activity were top contributors to the network score for the first four months of smoke exposure, after which Irak4 and Myd88 activity were top scoring contributors. These nodes also contributed most to the five-month pMRTP, switch to pMRTP, and cessation scores. Irak4 and Myd88 act in the TLR pathway that leads to macrophage activation induced by smoke for six months (Fig. 6, boxed in yellow). A number of new nodes were added during the NVC2 process, including detail around the TLR pathway and effects of macrophage activation. Two of these new nodes, prostaglandin E2 and nitric oxide, were leading nodes that contributed highly to the macrophage signaling network score.
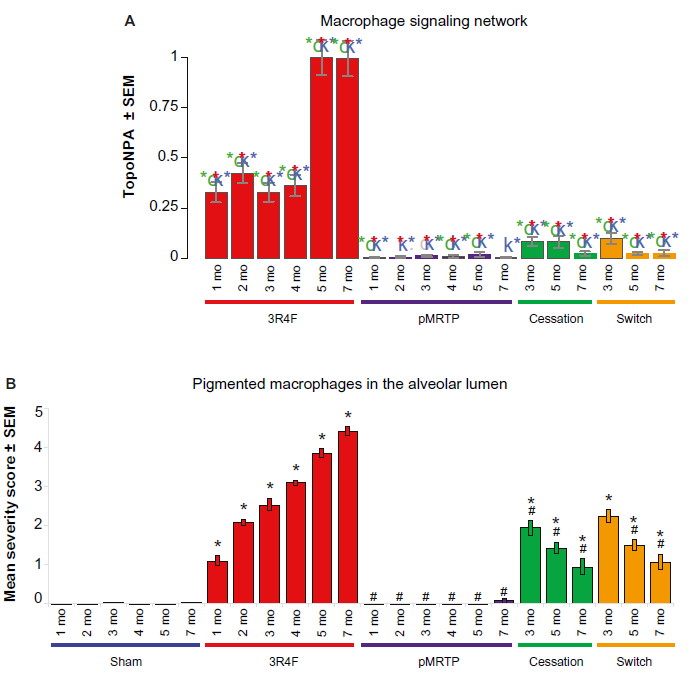
Macrophage signaling network scores in the E-MTAB-3150 dataset and pigmented macrophage counts in the same study. (
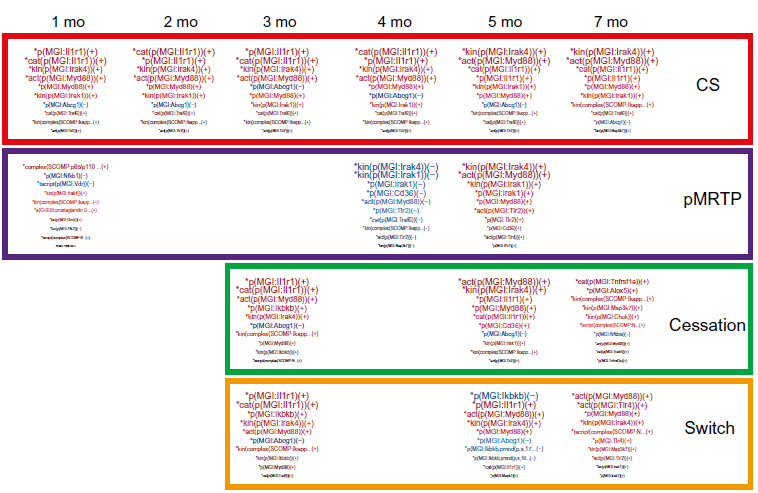
Leading node contribution for macrophage signaling network in the E-MTAB-3150 dataset. Word size indicates relative contribution to network score.
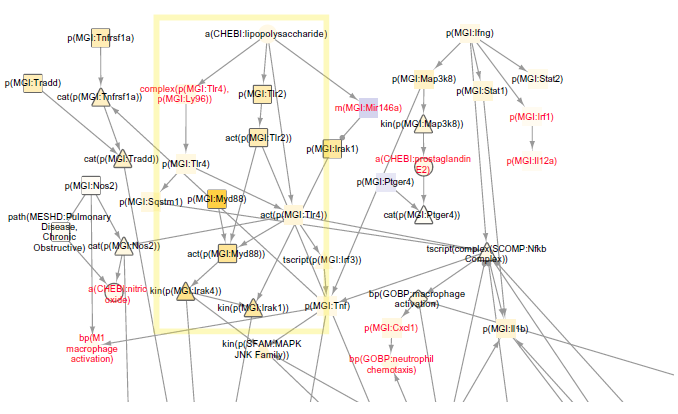
Macrophage signaling network scores for seven-month smoke vs seven-month fresh air using the E-MTAB-3150 dataset. A selection from the TopoNPA-scored version is shown. Arrow edge indicates a positive relationship, while ball and stick edge indicates a negative relationship (includes causal and correlative statements). Nodes are colored by NPA score; yellow indicates inferred increase and blue indicates inferred decrease. Darker colors denote higher magnitude scores. Leading nodes contribute to 80% of the network score and are denoted by their shapes outlined in gray. Nodes added within this section of the network during the NVC process are labeled in red. Nodes boxed in yellow reflect prediction of TLR pathway.
NPA scores can be calculated for the whole suite of networks and also allow to compare different datasets, as the relative signal compared with a control is used. Figure 7 shows that, as expected, most of the networks were predicted to be significantly impacted with CS exposure in the E-MTAB-3150 dataset, with an increasing impact over time. In contrast, most of the networks were predicted to be not impacted significantly with pMRTP exposure. Upon cessation or switch to pMRTP from smoke exposure, the network scores decreased. Interestingly, this approach also proves powerful when applied to a dataset with fainter signal, as judged by the number of differentially expressed genes. Indeed, the number of differentially expressed genes in GSE25209 is low (hundreds) compared with those in the E-MTAB-3150 dataset (thousands) for smoke-exposed mice (Supplementary File 3). Despite the low signal, TopoNPA still detected a signal and predicted activation of key networks known to be involved in smoking, including the inflammatory, cell stress, cell proliferation, and tissue repair networks (Fig. 7). The networks that score significantly in GSE52509 were similar to those in the C57BL6-pMRTP-SW dataset, sharing 24 significant and 11 nonsignificant networks out of the 46 total networks. Note that scores cannot be compared across datasets.
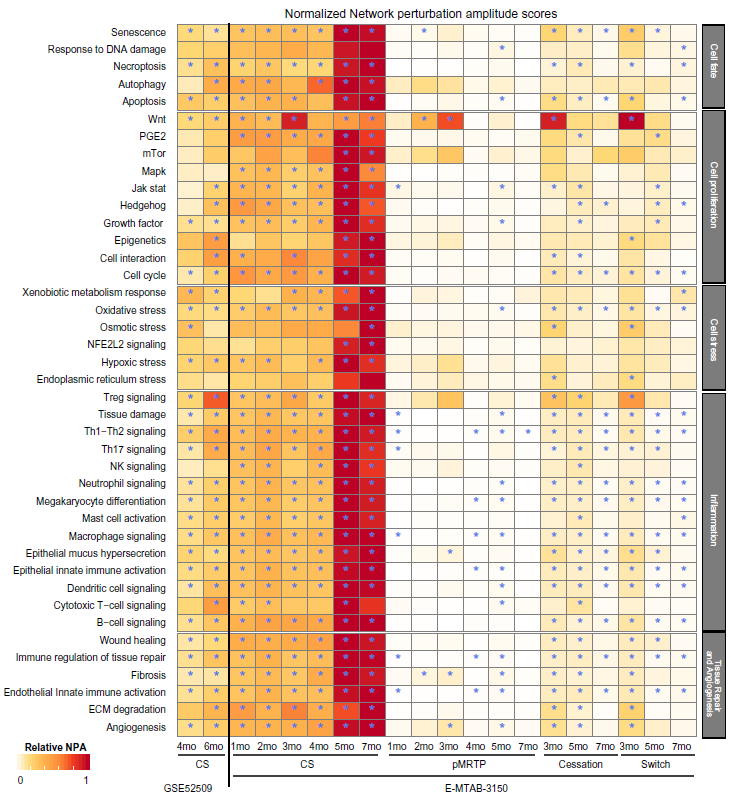
Heat map of network scores comparing the impact of CS exposure, pMRTP, and cessation in the E-MTAB-3150 and GSE52509 datasets. Each treatment is compared to fresh air at the same time point. Scores are normalized to the maximum scores for each network. A network is considered impacted if, in addition to the significance of the score with respect to the experimental variation, the two companion statistics (O and K) derived to inform the specificity of the score with respect to the biology described in the network, are significant.
One of the networks that scored significantly for the impact of six-month smoke was the Th17 signaling network. The network shows mechanisms that can contribute to Th17 signaling and were predicted to be increased or decreased. Il17 differential gene expression was not statistically significant based on the microarray data; however, evidence of Il17a and Il17f activation from the overall transcriptomics signal was inferred and contributed to the significant Th17 signaling network score (Fig. 8, boxed in yellow). These network inferences match measurements from the study, reporting a higher number of Th17 cells and IL17-positive cells in the six-month smoke-exposed lung tissue. 31 Additionally, the study reported enrichment of innate and adaptive immune cell communication pathways by Ingenuity Pathway Analysis of transcriptomics data, which matches the significant network scores in T-cell and other immune networks (Fig. 7).
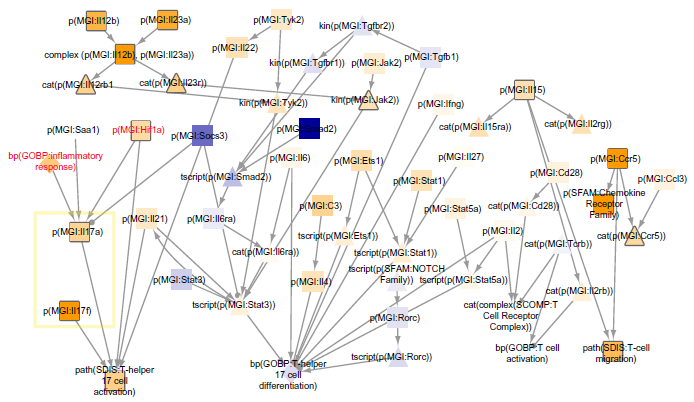
Th17 signaling network scored with GSE52509 mouse lung exposed to 6 month smoke. The whole TopoNPA-scored version is shown. Arrow edge indicates a positive relationship, while ball and stick edge indicates a negative relationship (includes causal and correlative statements). Nodes are colored by NPA score; yellow indicates inferred increase and blue indicates inferred decrease. Darker colors denote higher magnitude scores. Leading nodes contribute to 80% of the network score and are denoted by their shapes outlined in gray. Nodes added within this section of the network during the NVC process are labeled in red. Nodes boxed in yellow reflect prediction of ll17 cytokines.
Discussion
Network resources have different strengths
Many different network resources are available online, with different language formats, visualization, and download application capabilities.32,33 Out of these, we chose to compare two of the most widely used network resources, KEGG and Reactome, to the NVC networks focusing on the calcium signaling network as a point of comparison. BEL networks enhanced in the NVC cover 46 different COPD-relevant processes. The KEGG pathway database is a well-known resource in the scientific community that can be used to interpret data.4,5 Created by a select team of biologists, KEGG contains hundreds of pathways covering a wide variety of processes including metabolism, cellular processes, diseases, and more. Reactome is an open-source, open-access collection of manually curated and peer-reviewed pathways and suite of data analysis tools to support pathway-based analysis.6,7 Similarly, the NVC networks are manually curated by a team of scientists and organized into discrete subject areas. However, unlike the KEGG and Reactome pathways, these network graphs are open to the crowd for editing and each of the edges that make up the network is supported by literature source(s) along with a quotation from the paper that supports the edge and experimental context. The ability for the crowd to edit the networks facilitates a peer-review process, which ensures comprehensive and current networks.
The NVC networks have different edge and node types that describe the relationships between nodes in great detail to reflect exactly what was proven in the experiment the annotated reference describes. Nodes defined by a namespace serve to standardize the language and multiple functions such as abundance, activity, modifications (ie, phosphorylation), biological process, and pathology to describe the biology in a fine-grained manner. Edges are defined by causal, correlative, and other numerous noncausal relationships and each causal/correlative edge is based on a literature reference containing tissue, species, disease, and experimental metadata. Like the NVC networks, KEGG and Reactome describe biological processes in a causal manner, though they have less granular information about the nodes and edges and, for the case of KEGG, no specific literature reference was found for each relationship. Reactome has references by edge in the network downloads but not in an easily viewable format on the graph itself. References for the NVC calcium network were, on average, more recent than the KEGG and Reactome networks, implying that the NVC network contains more up-to-date information, most likely because of the crowdsourcing effort. Among the 86 references used to support the calcium pathways across all three resources, all references were unique. This illustrates the range of literature and boundaries that were used to build the calcium pathways across the three network formats. The visualization of the KEGG and Reactome pathways allows the viewer to easily traverse the networks within a graphical representation that includes cellular localization of the nodes. KEGG and Reactome pathway diagrams have detailed cellular localization information that the BEL networks do not show graphically. However, this information can be described in the edge annotation or the node label.
Many analysis tools are available to use with the KEGG and Reactome pathways to interpret data. NVC networks also support analytics for mapping nodes in a dataset as well as taking into account the relationships between the nodes with the exact edge data. NVC networks can be downloaded in JSON graph format (JGF) and viewed and applied to data using Cytoscape or other JGF-compatible network visualization software. Edge information can be used to filter and compute on the networks.
Other network resources that are geared toward a community-driven approach include WikiPathways 34 and the Cell Collective. 35 These resources do not have a calcium pathway appropriate for comparison, but like KEGG and Reactome, they are limited by less granular information about the nodes and edges compared with NVC networks and, like KEGG, no specific literature reference is given for each relationship. However, they do benefit from the contribution of information from the scientific crowd, where WikiPathway users can edit and contribute to existing pathways and Cell Collective users can contribute information to the Knowledge Base, collaboratively build models and simulate and analyze them in real time. Like KEGG and Reactome, WikiPathways provides a graphical representation, containing cellular localization information.
Each of these network resources offers advantages for viewing and interpreting biology. The NVC networks cover lung- and COPD-relevant processes in a very detailed and granular manner and are open to public feedback, and the data can be computed at the node and edge level. The KEGG and Reactome pathways cover a wide range of biology with many widely used node-centric analysis tools, the Cell Collective allows for quantitative computation of networks, and KEGG, Reactome, and WikiPathways provide a simplified representation for easy visualization.
NVC crowd excels at identifying and encoding literature
A review of the crowd changes and participant survey feedback after two iterations of the NVC allowed for an understanding of aspects that worked well and aspects that can be improved for subsequent challenges. One important finding was that the crowd was able to identify relevant literature that contained COPD mechanisms missing from the networks. Keeping networks up-to-date with the constant stream of published literature is difficult for the small team of scientists who created the networks. Crowdsourcing this effort through the Bionet website allows for a diverse group of international scientists to share in this effort to collect relevant literature and note missing areas in a network using each individual's expertise and biological perspective. This process allows the community as a whole to benefit from up-to-date networks.
The main incentive for participants, according to a survey, was the learning process, and although educating the community about BEL and network biology is an excellent outcome of the NVC, there were many challenges associated with this large, crowdsourced effort to edit the networks. These challenges included clearly defining and communicating rules and boundaries up front in a way that everyone can consistently follow, the follow-up effort required to edit the changes made to the networks to ensure consistency and adherence to the network framework rules, and the creation of accurate BEL statements capturing the biology stated in a publication.
An idea for future challenges is to separate knowledge creation from network construction. Adding new and relevant edges to a network was a heavily incentivized portion of the challenge and is an important mechanism for filling knowledge gaps in the network and maintaining the networks with newer information from the literature. While the crowd participants performed well at identifying relevant literature and representing key ideas in BEL, it was challenging for participants to select and add mechanistic, nonredundant paths that were well integrated with the rest of the network, especially for the larger networks. As seen from the network statistics, the crowd contributed to the number of nodes and edges but not necessarily to changing the topology of the network. Separating the curation and network building portions of the task could provide several advantages. For example, BEL evidences could be voted on by the crowd for accuracy and relevance and refined prior to incorporation into a network. It is difficult to edit evidences and statements once they are connected into a network, as all neighboring edges and all individual evidences supporting the same edge are affected. Moreover, evidences could be more readily shared across networks where applicable, and evidences that are highly relevant, but not the most streamlined, direct connection within a given network, could be omitted from the network but retained for other applications. Making the challenge tasks more manageable and narrowly defined in this manner could potentially attract more participants as well as increase the quality and value of the resulting networks and associated knowledge. Every year, as more biological experts participate in the challenge and more literature is published, the networks can be kept up-to-date with the current understanding of the biology contained in these networks.
Networks can be used in toxicity and drug discovery applications
In addition to application as a tool to understand signaling pathways regulating a disease process, biological networks can be used to predict active mechanisms driving measured biological changes based on a knowledgebase of known regulators of these measured changes. In this study, we use network scoring to infer upstream mechanisms known to regulate measured gene changes applied to three datasets. Networks that contain these mechanisms can then be scored to infer perturbation of biological processes represented by the networks in a quantitative manner. In the GSE28464 study, mutated HRASV12 was expressed in fibroblasts and activation of senescence and cell cycle was inferred by network scoring of the transcriptomics data. These results were consistent with experimental expectations of HRASV12, inducing senescence and cell cycle arrest. 36 This example illustrates the ability of the network scoring approach to infer known active mechanisms using transcriptomics data. Novel mechanisms predicted to be active from transcriptomics data as a result of a treatment could also be identified in biological networks using this approach.
A major advantage of this network-based transcriptomics data scoring approach is the ability to quantitatively compare treatments and time points within a dataset within discrete biological processes. In the E-MTAB-3150 dataset, the effects of smoke, pMRTP, switch to pMRTP, and cessation were quantified on the biological process and mechanistic level through network and mechanism scores. Network scoring indicated that smoke impacted lung biology captured by networks more than pMRTP, switch to pMRTP, or cessation and with a greater magnitude over time. pMRTP appeared to impact lung biology less than smoke, based on the lower pMRTP vs sham network scores and fewer networks scoring significantly. Switching from smoke to pMRTP or cessation showed a decrease in network perturbation compared with sham group over time. Additionally, scoring mechanisms within the network gives insights on which mechanisms are predicted to induce gene expression changes observed in the dataset. Il1 receptor signaling was predicted to impact macrophage activation the most in early time points with smoke treatment, followed by an increased impact of Irak4 and Myd88 activity on macrophage activation in later time points (Fig. 5). Il1r1/MyD88 signaling has been shown to contribute to elastase-induced lung inflammation and emphysema, 37 and although there are no publications implicating Irak4 in emphysema or COPD, a recent conference poster reported MyD88/Irak4 promotion of lung fibrosis in a mouse model of COPD. 38 This network approach can potentially highlight novel mechanisms such as Irak4 that drive disease and increase our understanding of COPD progression. Findings such as these could lead to a list of potential biomarkers or novel targets that could then be confirmed in multiple datasets in the primary disease tissue and narrowed down by aspects of ease of targetability and low off-target effects to identify ideal targets. Additionally, the quantitative aspect to network scoring can be used in toxicity testing to rank the impact of different treatments and study dosing and time effects for a particular perturbation.
Another advantage of the network approach is the ability to glean information from a dataset with a low transcriptomics signal. Similar to the E-MTAB-3150 dataset, GSE52509 contained data from smoke-exposed mouse lungs for four and six months; however, this dataset had a much lower transcriptomics signal. This difference in signal could be attributed to a larger variation in the data, or potentially the lower dosage and duration per day of smoke exposure in GSE52509 compared with the E-MTAB-3150 dataset. In the E-MTAB-3150 study, mice were exposed to smoke 2.4 times longer per day at 1.5 times higher concentration. Similar types of networks and leading nodes were inferred in both studies to be activated in processes relevant to CS exposure, and they matched experimental end points of pigmented macrophage and Th17 counts in E-MTAB-3150 and GSE52509 studies, respectively.
Although the networks focus on lung- and COPD-relevant context and were scored on lung datasets, these networks can apply to other disesases and tissues. The networks include edges that are based on literature from lung-relevant cell types such as fibroblasts, smooth muscle, and immune cells; these cell types are not specific to lung but can apply to many other tissues and disease contexts. The networks to be scored should be evaluated based on the context of the dataset. For the GSE28464 dataset, only the senescence and cell cycle networks were scored, while the immune networks were not scored since the experiment was performed in fibroblasts and not immune cells. Since many of the pathways that the networks describe such as canonical MAPK and NFKB signaling are conserved across tissues, these networks provide an important resource that can be built on to include contextspecific mechanisms according to scientists’ needs.
Conclusion
The computable biological language BEL allows for encoding of scientific literature with high granularity and is well suited for sharing mechanistic biology in a network context. The NVC takes advantage of the well-defined nature and ease of use of BEL to allow the scientific community to verify, enhance, and use these networks. These networks can then be used for toxicological and drug discovery applications. We illustrated one way to use these networks through quantitative network scoring based on transcriptomics data. Mechanisms were inferred from the data and could be quantitatively compared within a dataset, leading to insights in disease-driving mechanisms and toxicity assessment.
Author Contributions
Conceived and designed the experiments: JH, MCP. Analyzed the data: JP, SB, MT, YX, AAN, RAR, GA, MCP, MB, DRB, SD, ND-D, ÁMFL, AFM, DGA, SG, RM, FM, SMA, SM, SN, NR, IS, BS, AT, JVC, MGVR, MBP. Wrote the first draft of the manuscript: JP, SB, FM, MT Contributed to the writing of the manuscript: JP, SB, FM, MT, GA. Agreed with manuscript results and conclusions: JP, SB, MT, YX, AAN, RAR, GA, MB, DRB, SD, ND-D, ÁMFL, AFM, DGA, SG, RM, FM, SMA, SM, SN, NR, IS, BS, AT, JVC, MR, JH, MCP, MBP. Jointly developed the structure and arguments for the paper: JP, SB, FM, MT. Made critical revisions and approved the final version: JP, SB, FM, MT. All the authors reviewed and approved the final manuscript. DGA could not be contacted to approve the final proofs.
Footnotes
Acknowledgments
The authors thank Anouk Ertan, Laure Cannesson, and David Page for their help in organizing the Network Verification Challenge and jamboree, and Michael Maria and David Page for their help in project management and preparation of this manuscript. The project team expresses their gratitude to the subject matter experts and moderators who actively participated in the jamboree: Natalia Boukharov, Norberto Diaz-Diaz, Larisa Federova, Ignacio Gonzalez, Svetlana Guryanova, Anita Iskander, Ulrike Kogel, Marek Ostaszewski, Carine Poussin, Walter Schlage, Justyna Szostak, and Aravind Tallam.