
Abstract
Polyunsaturated (PUFA) long-chain fatty acids (LCFAs) are more potent in eliciting molecular and tissue functional changes in monogastrics than saturated LCFA. From –21 through 10 days relative to parturition dairy cows were fed no supplemental LCFA (control), saturated LCFA (SFAT; mainly 16:0 and 18:0), or fish oil (FISH; high-PUFA). Twenty-seven genes were measured via quantitative RT-PCR in liver tissue on day –14 and day 10. Expression of nuclear receptor co-activators
Introduction
The liver plays a pivotal role in whole-body lipid hemostasis and responds rapidly to changes in dietary fat composition in both rodents 1 and ruminants. 2 Previous data with peripartal dairy cattle have underscored the potential for dietary lipid supplementation as a useful nutritional strategy to prepare 3 and facilitate the hepatic metabolism of non-esterified fatty acids (NEFA) 4 released in high amounts from adipose tissue during early lactation. 5 However, there have been contrasting results with respect to type of dietary lipid and the response in blood hydroxybutyrate (BHBA), liver lipid content, dry matter intake (DMI), milk yield, and changes in body weight and body condition score.2,4,6,7 It is likely that differences across studies are partly due to the specific type (eg, saturated vs. unsaturated) and quantity of lipid supplemented.
In rodent liver, long-chain fatty acids (LCFAs) can bind directly to various nuclear receptors (
There is in vivo and in vitro evidence suggesting that the PPARa gene network might be responsive to dietary lipids and could be used to monitor the functional changes that might occur in the liver during the transition period.4,10,12,13 From that perspective, it is important to evaluate if those responses also are observed during the transition period in cows receiving supplemental lipid enriched in one or more of the main dietary LCFA. The objective of the current study was to evaluate the expression of several genes associated with the PPARa transcriptional network in liver tissue harvested from cows fed supplemental saturated fat or fish oil during the transition period.
Methods
Experimental design
The present study involved the same subset of multiparous Holstein cows used by Schmitt et al. 14 Briefly, a completely random subset of 5 multiparous cows (2nd and 3rd lactation) that were fed no supplemental LCFA (control, n = 12 cows total) or supplemental LCFA from either Energy Booster (SFAT; Milk Specialties Co., Dundee, IL, USA; n =15) or fish oil (FISH; Omega Proteins, Houston, TX, USA; n = 15) were used for hepatic phospholipid (PL) and triacylglycerol (TAG) LCFA analysis and gene expression profiling. The cows from the control, FISH, and SFAT diets were fed the respective diets from –25 (±4), –24 (±3), and –26 (±7) d, respectively, until 10 days post partum.
Biopsies
The liver tissue was harvested via percutaneous biopsy. 15 The average gap between the start of feeding and the first biopsy was 11 ± 3 days. Prepartal liver biopsies were harvested at –14 ± 4, –13 ± 3, and –16 ± 6 days in cows fed the control, FISH, and SFAT diets, respectively. Postpartal biopsies were harvested at 7 ± 4 days in all the groups. Biopsied tissue (1 to 2 g) was weighed and stored in liquid N2 prior to RNA extraction. A portion of liver tissue collected (0.8 to 1.0 g) was used for analysis of PL and TAG fatty acid concentrations as described by Ballou et al. 15
RNA extraction and real-time quantitative PCR (qPCR)
Complete details of the procedure for RNA extraction can be found in Schmitt et al.
14
Briefly, approximately 0.2–0.3 g of liver tissue was weighted and immediately placed in ice-cold TRIzol reagent for homogenization. Genomic DNA was removed from RNA with RNase-free DNase, using RNeasy Mini Kit columns. RNA concentration was measured with NanoDrop ND-1000 spectrophotometer, while the RNA quality was assessed using the Agilent Bioanalyzer system (Agilent 2100 Bioanalyzer, Agilent Technologies, Santa Clara, CA, USA). The average RNA integrity number (RIN) value for liver samples was 8 ± 0.4. Protocols for primer design, testing, selection of internal control genes (ICG) for normalization were as previously described.
14
Briefly, genes selected as suitable ICG based on geNorm analysis included
Genes selected for transcript profiling in this study are associated with fatty acid uptake and transport (
GenBank accession number, gene symbol, hybridization position, sequence and amplicon size of primers.
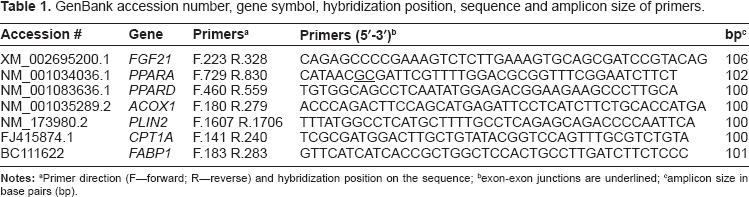
Primer direction (F–-forward; R–-reverse) and hybridization position on the sequence;
exon-exon junctions are underlined;
amplicon size in base pairs (bp).
Sequencing results of PCR primer products.
Fatty acid analysis
Details of these procedures have already been published by Ballou et al. 15 Briefly, a 100 mg liver sample was used to separate both PL and TAG via thin-layer chromatography using hexane-diethyl etheracetic acid (90:30:1, vol/vol/vol) as the elution phase. Methyl esters of fatty acids (FA) were prepared by incubation with 2 M potassium hydroxide in methanol for 15 min at room temperature. The ester mixture was separated using a Hewlett Packard 5890 gas chromatograph (Hewlett Packard, Avondale, PA, USA) equipped with a flame-ionization detector and a Supelco 2560 100-m capillary column (Supelco, Bellefonte, PA, USA). 15
Statistical analysis
After normalization with the geometric mean of the ICG, the qPCR data from all treatments (prepartum and postpartum) were log-2 transformed prior to statistical analysis. 14 A repeated measures model was fitted to gene expression, FA, NEFA, and DMI data using Proc MIXED in SAS. The model consisted of time, treatment, and time × treatment interaction as fixed effects, as well as cow as the random effect. An autoregressive covariate structure was used. All means were compared using the PDIFF statement of SAS.
Results
Dry matter intake and blood NEFA
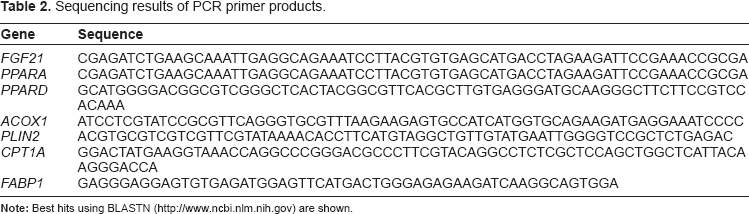
The DMI was significantly (
Dry matter intake (A) and blood NEFA concentration (B) during the peripartal period in cows fed (n = 5/treatment) control, fish oil (FISH), or saturated lipid (SFAT). There was a significant (
Hepatic fatty acid composition
Phospholipids
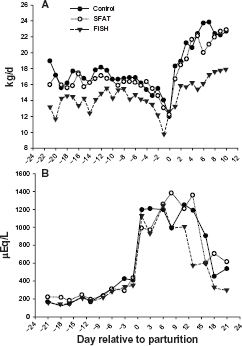
Mean concentration of palmitic acid (16:0) increased (
Percentage of long-chain fatty acids in liver phospholipids during the peripartal period in cows fed (n = 5/treatment) control, fish oil (FISH), or saturated lipid (SFAT).
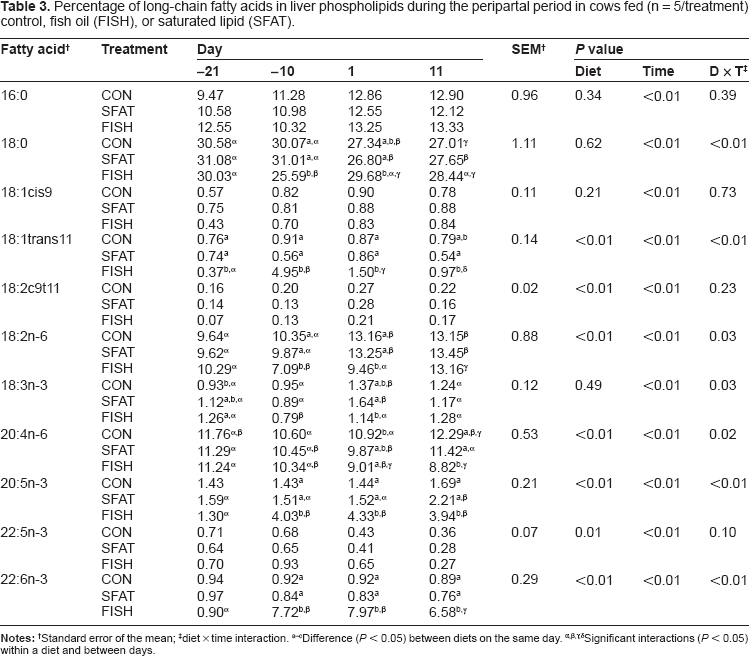
Standard error of the mean;
diet × time interaction.
Difference (
Significant interactions (
SFAT and FISH-supplemented cows had greater (diet × day
Triacylglycerol
Concentration of 16:0 was greatest (
Percentage of long-chain fatty acids in liver triacylglycerol during the peripartal period in cows fed (n = 5/treatment) control, fish oil (FISH), or saturated lipid (SFAT).
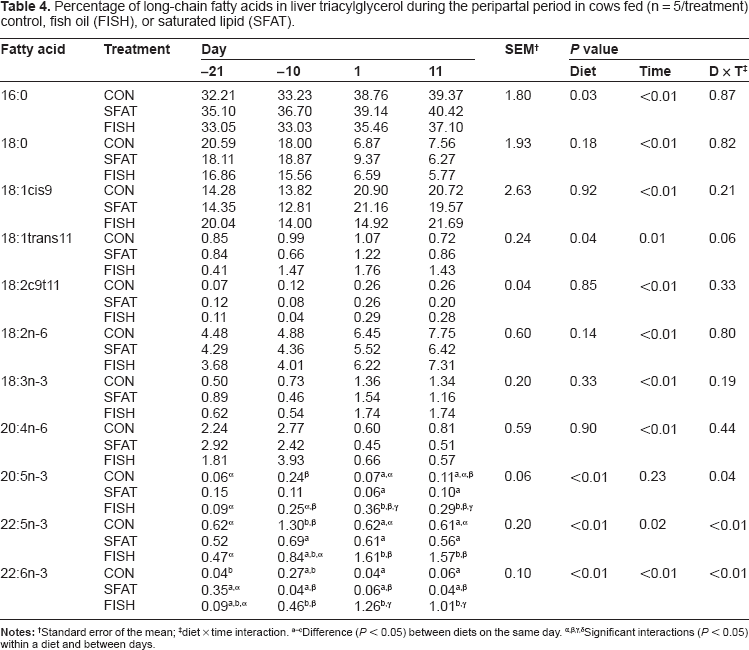
Standard error of the mean;
diet × time interaction.
Difference (
Significant interactions (
Compared with the PL fraction, supplementing lipid was not effective (diet
Hepatic gene expression
Fatty acid transport and LD formation
The expression of genes involved in fatty acid uptake/transport, storage, and oxidation changed in a different fashion with lipid supplementation as compared to the control cows. The expression of the LCFA-uptake protein
Relative expression (treatment means, log-2 scale) of genes involved in fatty acid uptake, esterification, desaturation, lipid droplet formation, fatty acid oxidation, gluconeogenesis and cellular energy during the peripartal period in cows fed (n = 5/treatment) control, fish oil (FISH), or saturated lipid (SFAT).
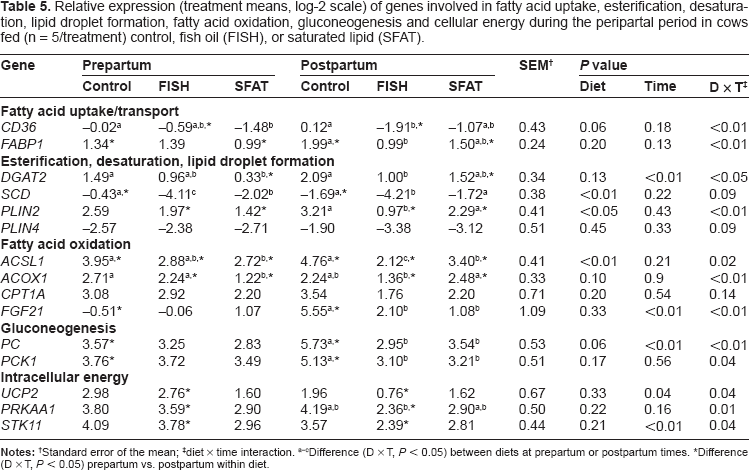
Standard error of the mean;
diet × time interaction.
Difference (D × T,
Difference (D × T,
Feeding SFAT led to lower (diet x day
Fatty acid oxidation
The expression of
Genes involved in gluconeogenesis and intracellular energy sensing
There was no interaction (diet × day
Transcription regulators and nuclear co-activators and repressors
No obvious pre- and postpartal differences were observed in the expression of
Relative expression (treatment means, log-2 scale) of genes encoding transcription regulators, nuclear receptor co-activators and co-repressors during the peripartal period in cows fed (n = 5/treatment) control, fish oil (FISH), or saturated lipid (SFAT).

Standard error of the mean;
diet × time interaction.
Difference (D × T,
Difference (D × T,
Feeding FISH and SFAT vs. control led to lower expression in the prepartal period of the nuclear receptor co-regulators
Inflammation and apoptosis
The expression of
Relative expression (treatment means, log-2 scale) of genes involved in inflammation and cell growth during the peripartal period in cows fed (n = 5/treatment) control, fish oil (FISH), or saturated lipid (SFAT).
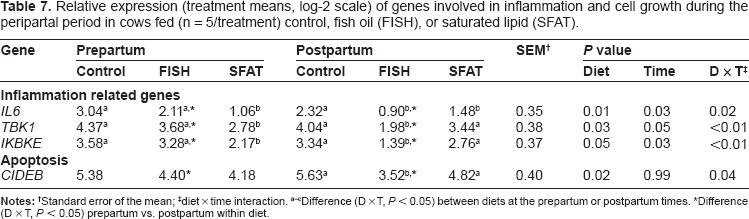
Standard error of the mean;
diet × time interaction.
Difference (D × T,
Difference (D × T,
Discussion
Hepatic PL and TAG fatty acid composition
Changes observed in the hepatic fatty acid profiles of PL and TAG were likely driven by a combination of (1) alterations in LCFA composition of adipose tissue induced by feeding, (2) mobilization of LCFA postpartum in response to lipolytic signals, and (3) biohydrogenation of PUFA in the rumen leading to increases in trans fatty acids. The contribution of adipose tissue LCFA to the PL and TAG fraction of lipids in dairy cattle liver has been demonstrated previously.2,17 Schmitt et al 14 using the same cows from this study, reported that all groups had an increase in liver TAG after parturition, which is a typical response observed due to the increase in circulating NEFA (ie, from mobilization of adipose tissue) (Fig. 1B). Although not measured in these cows, it is likely that the pool of LCFA stored in adipose tissue TAG and also in liver PL during the prepartal period in particular, contributed to the observed changes in gene expression profiles. This idea is supported by the fact that both FISH and SFAT upregulated several genes associated with lipid metabolism and the PPAR pathway namely in the prepartal period. 14
Dietary fat supplementation often produces a pronounced effect on hepatic PL composition. 2 In the present study, the postpartal decrease of 18:0 in the concentration and the increase in 18:1trans isomers (particularly trans11) with FISH was consistent with greater biohydrogenation of dietary PUFA. 15 The postpartal increase in 16:0 and 18:2n-6 regardless of diet likely was associated with increased adipose tissue lipolysis and subsequent transport and storage in the liver. 17 The observed decrease in the PL concentration of γ linolenic acid (18:3n-6) might have been due to allosteric inhibition or transcriptional regulation of the elongases as well as the δ5- and δ6-desaturases or to competition between n-6 and n-3 substrates for incorporation into PL. 18
The observed increase in the hepatic PL and TAG content of a linolenic acid (18:3n-3) likely accounted for the increase in content of 20:5n-3, 22:5n-3, and 22:6n-3 at calving 2 ; α linoleic acid can be desaturated and elongated to 20:5n-3 and 22:6n-3. The decrease in dihomo-γ-linoleic acid (20:3n-6) and arachidonic acid (20:4n-6) with FISH and SFAT after parturition as compared with the control (Table 3) might have been due to a low baseline concentration of linoleic acid (18:2n-6) in hepatic PL 15 as linoleic acid is desaturated and elongated to 20:3n-6 and subsequently to 20:4n-6. 2 Another possibility is that greater supply of 18:2 resulted in competition and displacement of other long chain PUFAs for esterification into PL. 2 Similarly, increased tissue content may inhibit elongation and desaturation of 18:2 and 18:3 as observed in calves. 19 The lower level of γ linolenic acid in FISH could have affected the concentration of arachidonic acid as γ linolenic acid is the intermediate in the conversion of linoleic acid to arachidonic acid. 20
Intracellular metabolism and LCFAs in bovine
The metabolism of specific LCFAs has been studied previously in vitro using hepatocytes isolated from neonatal calves.21,22 Despite the inherent difficulties in comparing in vitro and in vivo studies, in the context of our study, data generated with incubations of 16:0 alone or in combination with 18:0, 18:1, 20:5n-3, or 22:6n-3 are of interest. For instance, greater total oxidation (CO2 and acid-soluble products) of 14 C-16:0 were observed with incubations of 1 mM 16:0 plus 1 mM 20:5n-3 and 18:1 when compared with incubation of 1 mM 16:0 alone. 21 In contrast, the incubation containing 20:5n-3 did not increase use of 14 C-palmitic acid for cellular TAG synthesis, while 18:1 did. Palmitate plus 22:6n-3 did not affect total oxidation of 14 C-palmitic acid or its esterification to TAG. 21 Results from that initial study clearly underscored the differential utilization of LCFA for esterification or fatty acid oxidation in liver cells. Although there were no data on mRNA or protein expression of lipid metabolism enzymes, it would not be unreasonable to suspect (based on data from model organisms) that changes in expression would have been partly responsible for the changes observed. For instance, 18:1 either from exogenous sources or synthesized from 18:0 via SCD, is central for cellular TAG synthesis and LD formation, 23 and is probably an essential step in very-low-density lipoprotein (VLDL) synthesis in the liver.
A second study confirmed the response of 18:1 only in terms of enhancing the use of 16:0 for esterification, but did not confirm the effect of 20:5n-3 on ketone body formation from 16:0. 22 Furthermore, there was an increase in cellular TAG with incubations of 22:6n-3. However, contrary to the first study incubation of 1 mM 16:0 plus 1 mM 18:0 resulted in greater BHBA concentration in culture media as a result of greater oxidation rate of 14 C-16:0. 22 Although we did not detect statistical differences in blood BHBA due to lipid supplementation, 14 the likely fluctuations in BHBA metabolism during lactation, when compared with in vitro systems, would make it difficult to use this marker to discern physiological effects in vivo.
Additional analyses from this second study included rate of gluconeogenesis and concentration of cellular glycogen. Linolenic acid plus 16:0 resulted in the highest rates of gluconeogenesis from 14 C-propionic acid and greatest amounts of intracellular glycogen, along with reduced TAG production. 22 An interesting finding was that 22:6n-3 plus 16:0 incubation, or either plus 20:5n-3, increased cellular TAG content and incorporation of 14 C-palmitic acid into cellular TAG. In addition, 22:6n-3 plus 16:0 decreased metabolism of 14 C-propionic acid to glucose or to cellular glycogen in the medium. 22
The in vitro work with hepatocytes has, by necessity, been short-term compared with the longer-term feeding studies. Furthermore, the above studies used supra-physiological concentrations of each LCFA. Their expected concentration in the circulation of the cow after parturition is unlikely to reach the 1 mM level. In fact, unless the cow is under a ketotic situation, the peak total NEFA concentration after parturition is rarely greater than 1.5 mM. 24 Although the resulting data from these in vitro studies have helped expand our knowledge of the metabolic effects of specific LCFA, the observed results are challenging to place in the in vivo context. Thus, gene expression data obtained over a longer time-frame from cows in field conditions may provide a more physiologically-relevant view of the likely mechanistic effects of enriching diets with specific LCFA.
Hepatic gene expression
Fatty acid transport and metabolism
The expression of
The contrasting response between liver tissue in the present study and bovine kidney cells 10 in the same species is not surprising and obviously is likely related with the different types of cells studied in addition to the endocrine and metabolic environment. The complexity of the LCFA pool that hepatocytes are exposed to also has shown to influence the degree of PPAR gene network activation in rodent liver.25–27 As stated before, feeding FISH led to a large difference in the concentration of 18:1trans11, 18:1trans12, 22:6n-3, and 20:5n-3, all of which could potentially play a role in the activation of the PPARa gene network at least judging from in vitro data. 28
Esterification, desaturation, and LD formation
The enzyme
In rodents,
The lower
Unlike
Fatty acid oxidation
In the liver,
The lack of difference for
In our analysis of adipose tissue gene expression from these cows, we found some evidence that lipid supplementation could influence the production of adipokines by adipose tissue, hence, influence indirectly the hepatic capacity of β-oxidation.
14
It has been proposed in rodents that adiponectin binding to its hepatic receptor (
Recently, it was reported that FISH inhibits de novo lipogenesis and β-oxidation, and decreases insulin resistance in non-ruminants. The improvement in insulin sensitivity is mediated by down regulating the PPARG network,
Peroxisomal oxidation results in the increased production of shorter-chain fatty acyl-CoA that generally are channeled to be completely oxidized in mitochondria.
5
Although
In rodents, the PPARα protein is required for the normal activation of hepatic LCFA oxidation, TAG clearance, and ketogenesis.
57
Despite obvious biological variation in its expression across treatments, the pattern of
Genes involved in gluconeogenesis and intracellular energy sensing
The predominant glucose precursors in dairy cows are propionate and lactate, although the contribution of alanine and glycerol becomes quantitatively more important during conditions of propionate deficit (ie, the early postpartal period).58,59 Partitioning of lactate and alanine towards gluconeogenesis is under the control of
The upregulation of
The exogenous LCFA can enhance the rates of hepatic mitochondrial oxidation by uncoupling oxidation from ATP production.
5
The uncoupling proteins (UCPs) are key players in mitochondrial oxidation, the activity of which can be induced by LCFA. Monounsaturated and PUFA appear more effective than saturated LCFA in activating the liver specific isoform
Armstrong and Towle
66
reported induced expression of hepatic
Nuclear receptor co-activators and co-repressors
The co-activator-associated arginine methyltransferase I (CARM1) is a critical component of glucose metabolism in rodent hepatocytes.
71
There it physically interacts with cAMP-responsive element binding factor CREB before both being recruited to the PCK1 and glucose-6-phosphatase promoters in a cAMP-dependent manner particularly during periods of dietary glucose short-falls (eg, undernutrition, starvation, negative energy balance).
72
CARM1 regulates gene expression by multiple mechanisms including methylation of histones and co-activation of steroid receptor transcription.
73
The observed postpartal decrease of
Mediator 1 (MED1) is required for high-fat diet-induced hepatic steatosis via PPARγ, and loss of MED1 protects rodents against fatty liver.
73
A biologically-similar role for
Nuclear receptor co-repressor 2 (
Transcription regulators of lipid metabolism
In non-ruminants, sterol regulatory element binding proteins
Inflammation and apoptosis
Dietary LCFA can impact immunity through the production of cytokines and molecules involved in the regulation of immune responses.
82
Omega-3 and omega-6 PUFAs are important immunomodulators.
83
The transcription factors interferon regulatory factor 3 (IRF3) and NFkB are the central points of an integrated network of genes involved in the innate immune response, whereas inhibitors of kappa light polypeptide gene enhancer in B-cells, kinase epsilon (
The observed postpartal increase in 20:5n-3 and 22:6n-3 in PL of cows fed FISH likely inhibited 20:4n-6 metabolism directly, via substrate competition, or indirectly, by altering the expression of inflammatory genes through effects on transcription factor activation. 85 Feeding plant or fish oil rich in omega-3 PUFA generally reduces inflammatory reactions and production of interleukin (IL)-1, IL-6, MMP-3 (STR1), and tumor necrosis factor.86,87 Such type of effects might be less pronounced in dairy cattle because of the substantial degree of biohydrogenation of PUFA in the rumen and also because of the substantial uptake of LCFA by the mammary gland during lactation. However, the data provides strong evidence that the enrichment of omega-3 PUFA in liver PL due to feeding FISH likely was important in lowering the expression of inflammatory genes. A possible mechanism for such an effect could have encompassed PPAR8, which was recently shown to be activated in dairy cattle liver during inflammation. 88
The cell death-inducing DFFA-like effector b (CIDEB) protein has a high level of expression in non-ruminant liver, and its deficiency affects energy expenditure, plasma TAG levels,
89
and also alters the expression of genes involved in various metabolic and signaling networks.
80
The
Conclusions
The present study revealed the type of dietary fatty acid which affects the hepatic fatty acid profile of PL and TAG. At the levels supplemented, the change in the profile of metabolic genes after parturition in cows fed saturated fat suggested a greater capacity for uptake of fatty acids and intracellular handling without excessive storage of LD. The lack of difference in liver TAG concentration between lipid-supplemented groups and the downregulation of metabolic genes after parturition in cows fed fish oil suggested that it might not be effective in enhancing oxidative capacity of LCFA. Such response contrasts the effect of very-long chain PUFA in monogastric species. The results highlighted that both saturated and very-long chain PUFA seemed equally effective at helping decrease inflammatory gene expression but FISH had a more potent effect after parturition. Based on the combined data from this study additional studies to better delineate the effective doses of saturated and very-long chain PUFA to feed around parturition seem warranted.
Funding
Partial support for the gene expression work was provided by Section 1433 Animal Health and Disease funds under project ILLU-538-961 (National Institute of Food and Agriculture, Washington, DC).
Author Contributions
Conceived and designed the experiment: MAB, EJD. Conceived and/or performed the analyses: HA, ES, JJL. Wrote the manuscript: HA, ES, MNC, JJL. Agree with manuscript results and conclusions: HA, ES, MAB, MNC, EJD, JJL. Jointly developed the structure and arguments for the paper: HA, ES, JJL. Made critical revisions and approved final version: HA, ES, MAB, MNC, EJD, JJL. All authors reviewed and approved of the final manuscript.
Competing Interests
Author(s) disclose no potential conflicts of interest.
Disclosures and Ethics
As a requirement of publication the authors have provided signed confirmation of their compliance with ethical and legal obligations including but not limited to compliance with ICMJE authorship and competing interests guidelines, that the article is neither under consideration for publication nor published elsewhere, of their compliance with legal and ethical guidelines concerning human and animal research participants (if applicable), and that permission has been obtained for reproduction of any copyrighted material. This article was subject to blind, independent, expert peer review. The reviewers reported no competing interests.
Footnotes
Acknowledgment
Eduardo Schmitt was supported by a fellowship from Coordenação de Aperfeiçoamento de Pessoal de Nivel Superior from the Brazilian Ministry of Education.
Supplementary Tables
Concentration of fatty acids in hepatic triacylglycerol during the peripartal period.
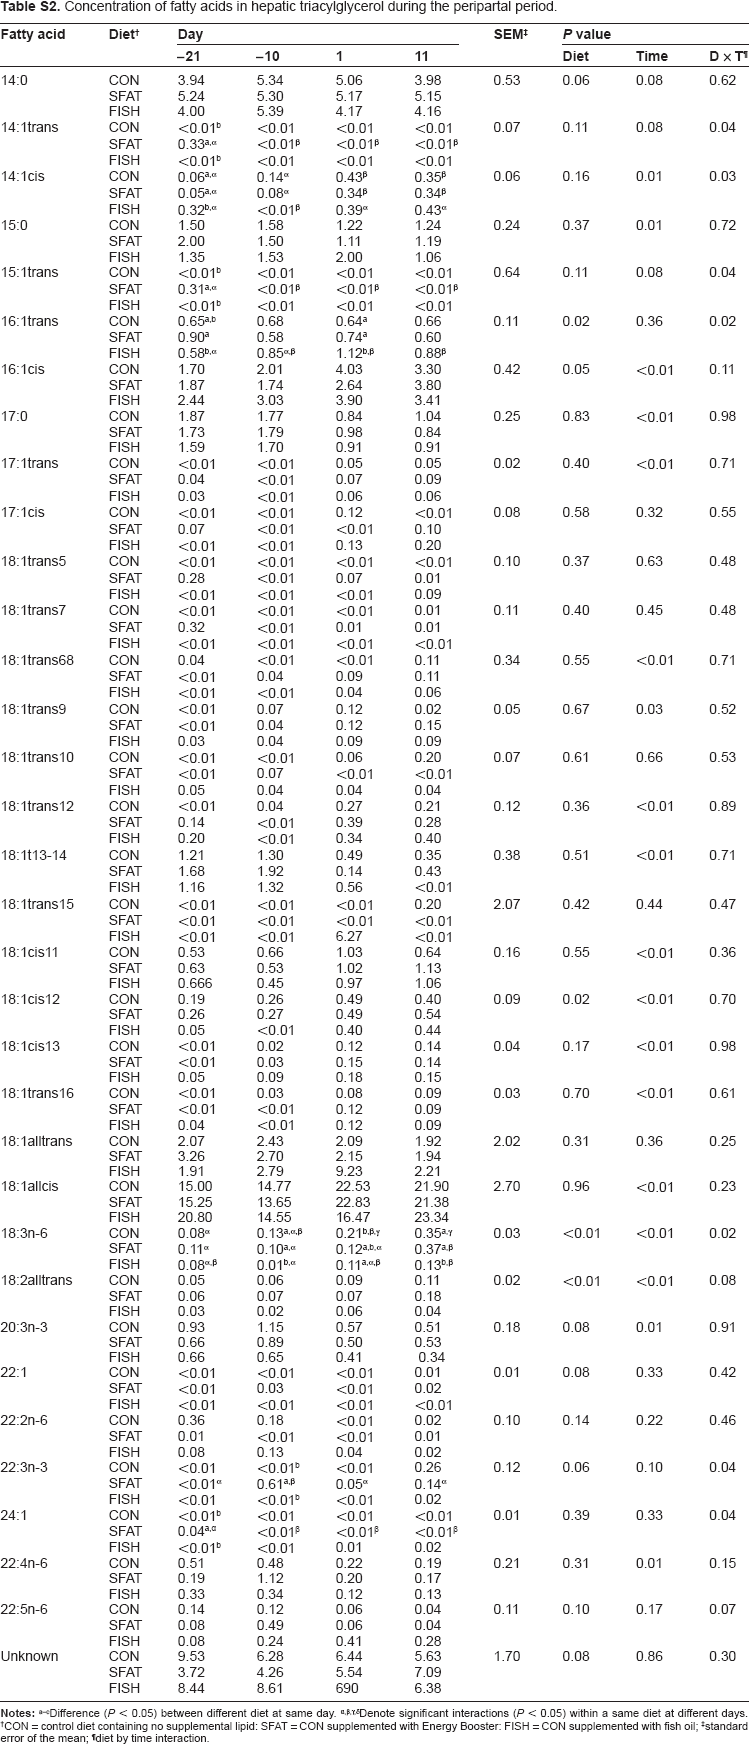
| Fatty acid | DieT † | Day |
SEM ‡ | ||||||
|---|---|---|---|---|---|---|---|---|---|
| –21 | –10 | 1 | 11 | Diet | Time | D ×T ¶ | |||
| 14:0 | CON | 3.94 | 5.34 | 5.06 | 3.98 | 0.53 | 0.06 | 0.08 | 0.62 |
| SFAT | 5.24 | 5.30 | 5.17 | 5.15 | |||||
| FISH | 4.00 | 5.39 | 4.17 | 4.16 | |||||
| 14:1trans | CON | <0.01 b | <0.01 | <0.01 | <0.01 | 0.07 | 0.11 | 0.08 | 0.04 |
| SFAT | 0.33a,α | <0.01 β | <0.01 β | <0.01 β | |||||
| FISH | <0.01 b | <0.01 | <0.01 | <0.01 | |||||
| 14:1cis | CON | 0.06a,α | 0.14 α | 0.43 β | 0.35 β | 0.06 | 0.16 | 0.01 | 0.03 |
| SFAT | 0.05a,α | 0.08 α | 0.34 β | 0.34 β | |||||
| FISH | 0.32b,α | <0.01 β | 0.39 α | 0.43 α | |||||
| 15:0 | CON | 1.50 | 1.58 | 1.22 | 1.24 | 0.24 | 0.37 | 0.01 | 0.72 |
| SFAT | 2.00 | 1.50 | 1.11 | 1.19 | |||||
| FISH | 1.35 | 1.53 | 2.00 | 1.06 | |||||
| 15:1trans | CON | <0.01 b | <0.01 | <0.01 | <0.01 | 0.64 | 0.11 | 0.08 | 0.04 |
| SFAT | 0.31a,α | <0.01 β | <0.01 β | <0.01 β | |||||
| FISH | <0.01 b | <0.01 | <0.01 | <0.01 | |||||
| 16:1trans | CON | 0.65a,b | 0.68 | 0.64 a | 0.66 | 0.11 | 0.02 | 0.36 | 0.02 |
| SFAT | 0.90 a | 0.58 | 0.74 a | 0.60 | |||||
| FISH | 0.58b,α | 0.85α,β | 1.12b,β | 0.88 β | |||||
| 16:1cis | CON | 1.70 | 2.01 | 4.03 | 3.30 | 0.42 | 0.05 | <0.01 | 0.11 |
| SFAT | 1.87 | 1.74 | 2.64 | 3.80 | |||||
| FISH | 2.44 | 3.03 | 3.90 | 3.41 | |||||
| 17:0 | CON | 1.87 | 1.77 | 0.84 | 1.04 | 0.25 | 0.83 | <0.01 | 0.98 |
| SFAT | 1.73 | 1.79 | 0.98 | 0.84 | |||||
| FISH | 1.59 | 1.70 | 0.91 | 0.91 | |||||
| 17:1trans | CON | <0.01 | <0.01 | 0.05 | 0.05 | 0.02 | 0.40 | <0.01 | 0.71 |
| SFAT | 0.04 | <0.01 | 0.07 | 0.09 | |||||
| FISH | 0.03 | <0.01 | 0.06 | 0.06 | |||||
| 17:1cis | CON | <0.01 | <0.01 | 0.12 | <0.01 | 0.08 | 0.58 | 0.32 | 0.55 |
| SFAT | 0.07 | <0.01 | <0.01 | 0.10 | |||||
| FISH | <0.01 | <0.01 | 0.13 | 0.20 | |||||
| 18:1trans5 | CON | <0.01 | <0.01 | <0.01 | <0.01 | 0.10 | 0.37 | 0.63 | 0.48 |
| SFAT | 0.28 | <0.01 | 0.07 | 0.01 | |||||
| FISH | <0.01 | <0.01 | <0.01 | 0.09 | |||||
| 18:1trans7 | CON | <0.01 | <0.01 | <0.01 | 0.01 | 0.11 | 0.40 | 0.45 | 0.48 |
| SFAT | 0.32 | <0.01 | 0.01 | 0.01 | |||||
| FISH | <0.01 | <0.01 | <0.01 | <0.01 | |||||
| 18:1trans68 | CON | 0.04 | <0.01 | <0.01 | 0.11 | 0.34 | 0.55 | <0.01 | 0.71 |
| SFAT | <0.01 | 0.04 | 0.09 | 0.11 | |||||
| FISH | <0.01 | <0.01 | 0.04 | 0.06 | |||||
| 18:1trans9 | CON | <0.01 | 0.07 | 0.12 | 0.02 | 0.05 | 0.67 | 0.03 | 0.52 |
| SFAT | <0.01 | 0.04 | 0.12 | 0.15 | |||||
| FISH | 0.03 | 0.04 | 0.09 | 0.09 | |||||
| 18:1trans10 | CON | <0.01 | <0.01 | 0.06 | 0.20 | 0.07 | 0.61 | 0.66 | 0.53 |
| SFAT | <0.01 | 0.07 | <0.01 | <0.01 | |||||
| FISH | 0.05 | 0.04 | 0.04 | 0.04 | |||||
| 18:1trans12 | CON | <0.01 | 0.04 | 0.27 | 0.21 | 0.12 | 0.36 | <0.01 | 0.89 |
| SFAT | 0.14 | <0.01 | 0.39 | 0.28 | |||||
| FISH | 0.20 | <0.01 | 0.34 | 0.40 | |||||
| 18:1t13-14 | CON | 1.21 | 1.30 | 0.49 | 0.35 | 0.38 | 0.51 | <0.01 | 0.71 |
| SFAT | 1.68 | 1.92 | 0.14 | 0.43 | |||||
| FISH | 1.16 | 1.32 | 0.56 | <0.01 | |||||
| 18:1trans15 | CON | <0.01 | <0.01 | <0.01 | 0.20 | 2.07 | 0.42 | 0.44 | 0.47 |
| SFAT | <0.01 | <0.01 | <0.01 | <0.01 | |||||
| FISH | <0.01 | <0.01 | 6.27 | <0.01 | |||||
| 18:1cis11 | CON | 0.53 | 0.66 | 1.03 | 0.64 | 0.16 | 0.55 | <0.01 | 0.36 |
| SFAT | 0.63 | 0.53 | 1.02 | 1.13 | |||||
| FISH | 0.666 | 0.45 | 0.97 | 1.06 | |||||
| 18:1cis12 | CON | 0.19 | 0.26 | 0.49 | 0.40 | 0.09 | 0.02 | <0.01 | 0.70 |
| SFAT | 0.26 | 0.27 | 0.49 | 0.54 | |||||
| FISH | 0.05 | <0.01 | 0.40 | 0.44 | |||||
| 18:1cis13 | CON | <0.01 | 0.02 | 0.12 | 0.14 | 0.04 | 0.17 | <0.01 | 0.98 |
| SFAT | <0.01 | 0.03 | 0.15 | 0.14 | |||||
| FISH | 0.05 | 0.09 | 0.18 | 0.15 | |||||
| 18:1trans16 | CON | <0.01 | 0.03 | 0.08 | 0.09 | 0.03 | 0.70 | <0.01 | 0.61 |
| SFAT | <0.01 | <0.01 | 0.12 | 0.09 | |||||
| FISH | 0.04 | <0.01 | 0.12 | 0.09 | |||||
| 18:1alltrans | CON | 2.07 | 2.43 | 2.09 | 1.92 | 2.02 | 0.31 | 0.36 | 0.25 |
| SFAT | 3.26 | 2.70 | 2.15 | 1.94 | |||||
| FISH | 1.91 | 2.79 | 9.23 | 2.21 | |||||
| 18:1allcis | CON | 15.00 | 14.77 | 22.53 | 21.90 | 2.70 | 0.96 | <0.01 | 0.23 |
| SFAT | 15.25 | 13.65 | 22.83 | 21.38 | |||||
| FISH | 20.80 | 14.55 | 16.47 | 23.34 | |||||
| 18:3n-6 | CON | 0.08 α | 0.13a,α,β | 0.21b,β,γ | 0.35a,γ | 0.03 | <0.01 | <0.01 | 0.02 |
| SFAT | 0.11 α | 0.10a,α | 0.12a,b,α | 0.37a,β | |||||
| FISH | 0.08α,β | 0.01b,α | 0.11a,α,β | 0.13b,β | |||||
| 18:2alltrans | CON | 0.05 | 0.06 | 0.09 | 0.11 | 0.02 | <0.01 | <0.01 | 0.08 |
| SFAT | 0.06 | 0.07 | 0.07 | 0.18 | |||||
| FISH | 0.03 | 0.02 | 0.06 | 0.04 | |||||
| 20:3n-3 | CON | 0.93 | 1.15 | 0.57 | 0.51 | 0.18 | 0.08 | 0.01 | 0.91 |
| SFAT | 0.66 | 0.89 | 0.50 | 0.53 | |||||
| FISH | 0.66 | 0.65 | 0.41 | 0.34 | |||||
| 22:1 | CON | <0.01 | <0.01 | <0.01 | 0.01 | 0.01 | 0.08 | 0.33 | 0.42 |
| SFAT | <0.01 | 0.03 | <0.01 | 0.02 | |||||
| FISH | <0.01 | <0.01 | <0.01 | <0.01 | |||||
| 22:2n-6 | CON | 0.36 | 0.18 | <0.01 | 0.02 | 0.10 | 0.14 | 0.22 | 0.46 |
| SFAT | 0.01 | <0.01 | <0.01 | 0.01 | |||||
| FISH | 0.08 | 0.13 | 0.04 | 0.02 | |||||
| 22:3n-3 | CON | <0.01 | <0.01 b | <0.01 | 0.26 | 0.12 | 0.06 | 0.10 | 0.04 |
| SFAT | <0.01 α | 0.61a,β | 0.05 α | 0.14 α | |||||
| FISH | <0.01 | <0.01 b | <0.01 | 0.02 | |||||
| 24:1 | CON | <0.01 b | <0.01 | <0.01 | <0.01 | 0.01 | 0.39 | 0.33 | 0.04 |
| SFAT | 0.04a,α | <0.01 β | <0.01 β | <0.01 β | |||||
| FISH | <0.01 b | <0.01 | 0.01 | 0.02 | |||||
| 22:4n-6 | CON | 0.51 | 0.48 | 0.22 | 0.19 | 0.21 | 0.31 | 0.01 | 0.15 |
| SFAT | 0.19 | 1.12 | 0.20 | 0.17 | |||||
| FISH | 0.33 | 0.34 | 0.12 | 0.13 | |||||
| 22:5n-6 | CON | 0.14 | 0.12 | 0.06 | 0.04 | 0.11 | 0.10 | 0.17 | 0.07 |
| SFAT | 0.08 | 0.49 | 0.06 | 0.04 | |||||
| FISH | 0.08 | 0.24 | 0.41 | 0.28 | |||||
| Unknown | CON | 9.53 | 6.28 | 6.44 | 5.63 | 1.70 | 0.08 | 0.86 | 0.30 |
| SFAT | 3.72 | 4.26 | 5.54 | 7.09 | |||||
| FISH | 8.44 | 8.61 | 690 | 6.38 | |||||
Difference (
Denote significant interactions (
CON = control diet containing no supplemental lipid: SFAT = CON supplemented with Energy Booster: FISH = CON supplemented with fish oil;
standard error of the mean;
diet by time interaction.