
Abstract
Ribonucleic acids (RNA) are hypothesized to have preceded their derivatives, deoxyribonucleic acids (DNA), as the molecular media of genetic information when life emerged on earth. Molecular biologists are accustomed to the dramatic effects a subtle variation in the ribose moiety composition between RNA and DNA can have on the stability of these molecules. While DNA is very stable after extraction from biological samples and subsequent treatment, RNA is notoriously labile. The short half-life property, inherent to RNA, benefits cells that do not need to express their entire repertoire of proteins. The cellular machinery turns off the production of a given protein by shutting down the transcription of its cognate coding gene and by either actively degrading the remaining mRNA or allowing it to decay on its own. The steady-state level of each mRNA in a given cell varies continuously and is specified by changing kinetics of synthesis and degradation. Because it is technically possible to simultaneously measure thousands of nucleic acid molecules, these quantities have been studied by the life sciences community to investigate a range of biological problems. Since the RNA abundance can change according to a wide range of perturbations, this makes it the molecule of choice for exploring biological systems; its instability, on the other hand, could be an underestimated source of technical variability. We found that a large fraction of the RNA abundance originally present in the biological system prior to extraction was masked by the RNA labeling and measurement procedure. The method used to extract RNA molecules from cells and to label them prior to hybridization operations on DNA arrays affects the original distribution of RNA. Only if RNA measurements are performed according to the same procedure can biological information be inferred from the assay read out.
Introduction
Activities in cells are partially specified by their respective ribonucleic acid (RNA) content. 1 With respect to mRNA, at any given time, a theoretical human cell would feature the whole or some subset of all of the protein coding gene's transcripts, including all splice variants. With an estimated 21,000 coding genes and an average of 6 splice-variant forms per gene, 2 the set of all messengers a given human cell can hold is at least 100,000 elements. Note, this estimate does not take into account RNA editing and other post-transcriptional RNA modifying events that can potentially increase the number of elements in the theoretical human set of messenger RNA (mRNA) molecules. 3
Due to their biochemical properties, mRNAs can be dosed simultaneously in multiplexed assays. These array-based methods make use of the fact that single strands of nucleic acids will form a duplex with a reverse complementary strand. 4 Multiplexing is enabled by designing a series of probes (ie, reverse complementary strands) specific to their cognate mRNA molecule within the range of hybridization parameter values. In microarray-based approaches, the probes deposited on the solid surface are in excess with regards to the soluble complementary mRNA fraction. Based on the kinetics of hybridization of a homoduplex forming between 2 complementary RNA molecules, the amount of mRNA bound to immobilized probes at equilibrium is proportional to the concentration of mRNA in the assayed sample. 5 This pairing of the mRNA molecule to its cognate probe on the microarray is the basic principle of mRNA quantification. However, the nucleic acid molecules hybridized to the immobilized probes are not the original mRNA molecules extracted from the biosample. The mRNAs whose original quantities need to be dosed undergo some molecular modifications aimed at detecting their respective occurrences on the microarray once the equilibrium has been reached. One way to achieve this is to incorporate a fluorophore, so that colorimetric detection systems can be applied for subsequent quantification. 6
The cartoon in Figure 1 displays the set of steps performed in a generic mRNA quantification assay using an array-based method. This drawing is shown to highlight the fact that an mRNA assay read-out represents the outcome of a long series of steps, each of which potentially contributing to the overall variability of the quantification operation. The fact that RNA abundance is so sensitive to both biological and chemical changes raises the concern that each of these steps could alter the original RNA distribution, no matter which final detection method is applied. Newly introduced RNA quantification technologies, collectively referred to as RNA-seq, are skipping the hybridization step. Yet, they require similar complex molecular transformations, from the initial RNA to the final molecular form used for the measurement. 7
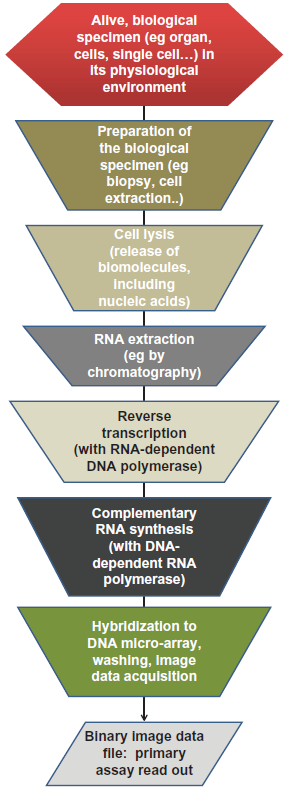
Diagram of an mRNA quantification procedure.
As a reminder, the objective of an mRNA quantification assay is to assess the amount of mRNA in the original biospecimen. Within the biological systems under investigation, mRNAs occur at a given rate according to the status of the system. This level can change according to internal and/or external perturbations, eg, by a treatment with a pharmacologically active compound. One of the common goals of mRNA quantification is to correlate a change in a subset of mRNAs with a change in biological phenotype. Implicitly, the goal of the dosage is to derive the source of the biological variability, and hence to minimize the impact of other sources of change that can confound the variability typically brought on by the quantification procedures themselves. Figure 1 shows the events between the original specimen to be investigated and the RNA assay readout, thus illuminating possible sources of technical variability.
One of these sources is the choice of microarray used for the measurement, with each brand or source featuring its own set of probes. For example, one may use short oligonucleotides produced by in-situ photolithographic synthesis while another relies on long oligonucleotide-spotted arrays.8,9 It is acknowledged that the nature of the probe, ie, its sequence, can affect the hybridization equilibrium. 10 The results of micro-array based assays are usually presented as data matrices with a molecular identifier as observations and biosamples as columns. In its most widely used form, the molecular identifier is a gene identifier, with a 1-to-1 relationship between a gene and a transcript being implicit in this kind of representation. Whether the precisions and accuracies of the measurements of a transcript by means of 2 different probes are close enough to make inter-microarray data analyses relevant is still a matter of legitimate debate. 11
It is common practice in the literature to refer to observed microarray measurements as gene expression levels. Gene expression levels in this context means the steady state level of mRNA, since this is the quantity that is actually measured in the assay. In other contexts, gene expression takes the meaning of de novo transcript initiation. 12 mRNA are not detected directly. A series of mostly enzymatically-based transformations are applied. For example, the RNA is usually reverse-transcribed into a single stranded complementary DNA. 13 The reverse transcription is primed with either an oligo-dT primer that matches the 3'poly-A tail of the mRNAs or with random-hexamers which, as their name indicates, form duplexes at various expectedly random positions in the mRNA template. 14 The incorporation of dye into complementary DNA can be achieved during the reverse transcription by providing modified nucleotides 15 that can be handled by the RNA-dependent DNA polymerase or by means of covalently adding a fluorophore to the 5′ end of the RNA strand. Figure 2A shows the details of the successive steps from the soluble mRNA isolated from the cells to the labeled nucleic-acids hybridized to their cognate probes on the microarray. 2 reasonable questions to ask are whether the various labeling steps alter the original distribution of the mRNAs samples, and if they do, to what extent does this occur? In order to address these questions, an experiment could be designed utilizing a large quantity of RNA from distinct, contrasted biological systems. The molecules would then be aliquoted and those aliquots partitioned further into groups according to the labeling protocol applied. The various labeled nucleic acids would then be assayed in replicates to the same type of microarray, such that the only source of variability is the actual RNA labeling procedure, everything else remaining constant.
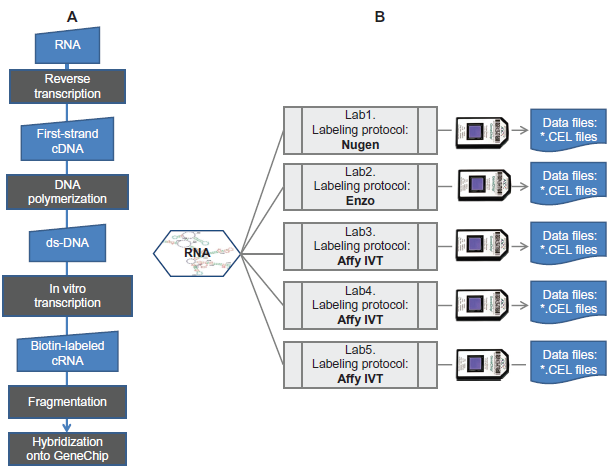
mRNA labeling workflow (
A similar experimental design was implemented in this study (shown in the Fig. 2B). The biological systems consisted of a set of isogenic mice of same gender and age, distributed into groups according to diet These various feeding conditions were known to determine the values of certain physiological phenotypes including body-mass index and blood chemistry. These physiological responses were also known to be specified by the activity of the liver. The scope of the experiment was to assess to what extent the liver cells’ activity, as measured by the level of protein coding RNA, is changing with regards to the perturbation. A corollary question was whether every instance of significant change in the steady state level of a particular mRNA would suggest a correlation between the activity of the cognate gene and the physiological response.
Inferring a bonafide relationship between changes in the level of a given mRNA molecule level with the change in the biological response under study requires providing evidence that the observed variation is explained mainly by the biological factor, and not by a confounding event.
This report shows that where the assay was performed (ie, in which laboratory) and/or which method of RNA labeling was used represent unexpected co-factors that actually mask the source of biological variability. Stated differently, the series of procedures starting from the extraction of RNA out of the biosample up to the microarray readout is not without disturbing the original distribution of RNA occurring in the biological sample. The obvious consequence is that the changes registered at the end of the assay can be attributed as much to the experimental procedure (the confounding factor) than to the biological perturbations.
Material and Methods
All animal procedures were conducted according to National Institute of Health guidelines. Mice were divided into different groups with respect to various feeding treatments. Mice were sacrificed and the liver was homogenized in Trizol. RNA was isolated using the Qiagen RNeasy Mini Kit. The quantity and purity of the RNA was determined by absorbance at 260 nm and 260/280 absorbance ratio respectively. Each of the total RNA preparations was individually assessed for RNA quality based on the 28S/18S ratio and RNA Intergrity Number (RIN) measured on an Agilent 2100 Bioanalyzer system using the RNA 6000 Nano LabChip Kit. 2 micrograms of the total RNA was shipped to five Contract Research Laboratories. Each laboratory received the identical samples. In some laboratories, RNA was labeled according to the Enzo BioArray™ HighYield™ RNA Transcript Labeling System or the Affymetrix GeneChip® 3′ IVT Express Kit or the NuGEN's Applause™ Systems (Fig. 2B). Each laboratory had from five to seven technical replicates par biological condition. The image file, read out from the scanning of the microarray was converted to a numerical value per unit of measurement. The amount of light intensity/unit of measurement in the microarray were converted to a value of relative abundance of a mRNA molecule through the data reduction procedure reported by Izarrzi et al. 17
Data processing and analyses were performed with Affymetrix GeneChip Command Console GCOS (Affymetrix, http://www.affymetrix.com/), Genedata Analyst (Genedata AG, www.genedata.com), TIBCO Spotfire DecisionSite (TIBCO, http://spotfire.tibco.com/), Umetrics SIMCA-P (Umetrics, http://www.umetrics.com/) and R Bioconductor packages (http://www.bioconductor.org/).
Results
Effect of Diet on Physiological Phenotype and Rna Collection from Mice liver
Physiological measurements were performed following the 2-week treatment phase. A significant variation of a series of blood analytes and of some physiological outcomes (eg, BMI) was observed. A large quantity of RNA was extracted from the liver of the mice from the 3 different treatments. The 3 groups of mice, of the same strain, age, gender and growing conditions, differed only by their diet. This was the only ‘controlled’ variable in this experimental design. These 3 feeding conditions alone had some significant impact on physiological output. One could conclude that, with regards to mice of the strain BALB/c, the aforementioned caloric restriction induced a significant change in their respective biological statuses. We attributed these changes to liver activity. To which extent the liver's failure to control the homeostasis of mouse physiological parameters can be correlated with a significant change in the level of discrete RNA represented the scope of the subsequent measurement.
Biological Variability with Respect to Mrna Level in Each Different Laboratory set
When each laboratory data set is considered separately, do all of them return the same answer as to which mRNA level correlates with the biological condition? The data for each set was processed according to the same series of transformations depicted in the Figure 3: (i) extraction of numerical values from the raw image TIFF file with the Affymetrix® GeneChip® Command Consoles® Software, 16 (ii) normalization according to the quantile normalization; and (iii) summarization of individual probes’ values into a single mRNA level value as described by Irizarri et al. 17 This quantile normalization assumes that the overall quantity of mRNA across the whole range of binned values has to be consistent across similar biological systems. The outcome of these data transformation is a data matrix with the 3 conditions, each represented by 5 replicates and ~40,000 observations, ie, the Affymetrix probe sets, representative of their cognate mRNA. This data processing was performed exactly in the same way for each of the 5 data sets, with the same parameters. In other words, there was no variability brought in to each laboratory set with regards to these data operations. Figure 4 shows a series of diagnostic plots commonly used to evaluate the molecular integrity of the mRNA quantified in the assay. There were 3 feeding conditions with 5 replicates for each. For each of these sets, 5 different laboratories have performed the assays. There are consequently 5 different data sets with regards to each laboratory. Each laboratory has initiated the quantification with the same source of RNA. As shown in the Figure 2B, the RNA samples branched out to different experimental paths from the step following the RNA extraction and prior to the RNA labeling procedure. If we conceptually group all the finite experimental steps that span from the end of the RNA extraction up to the image acquisition step into a single experimental event, the data set in hands was associated with 2 factors, the biological factor (ie, the feeding conditions) and the technical factor (ie, the RNA labeling procedure). The RNA degradation plot, for instance, testifies of the extent to which the RNA molecules were starting to be hydrolyzed. There are some chemical and biological (eg, Ribonucleases) mechanisms that potentially remain active during the RNA extraction procedure, which degrade RNA strand from their 5′ ends. The steepness of the RNA degradation plot is therefore used as a Quality Control metric. Assay validation studies 18 concluded that whenever slopes’ values were greater than 3, they would disqualify the data set for downstream analysis since an advanced degradation of the RNA would cause the measurement to be unreliable. The Figure 4 provides a quick overview of the overall quality of the 5 laboratory data sets. It shows that all of them were of high quality and therefore valid for subsequent analyses.
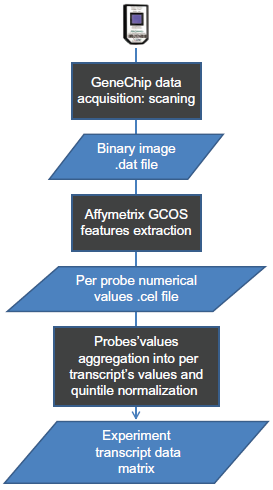
Data transformation procedure.
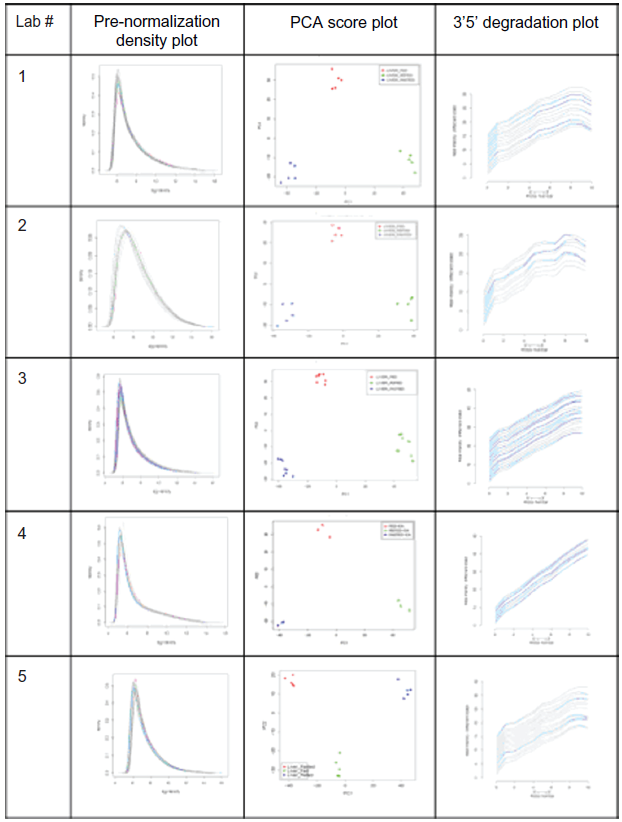
Data Quality across the 5 laboratory data sets.
The Affymetrix GeneChips, and other micro-array based assays, deliver very large data sets, with more than 40,000 variables in this case. The spread of the value of each of these 40,000 variables in the problem space evidently varies. In addition, based on prior knowledge of the regulation of gene expression, it is reasonable to state that the mRNA level data matrix is not made of 40,000 independent events, and that instead there is a fair amount of redundancy. The spread of the data across these 40,000 dimensions was assessed by deriving the principal components. The score plots for the 5 laboratory data sets presented in Figure 4 showed that the biological variability seems to be conserved across the 5 measurement sets. In addition, for every laboratory measurement, the biological conditions clustered within the same area in the scatter plot of the 2 major principal components. Firstly, the information content with regards to the biological input seems to have been maintained. Prior to the inception of the experiment, the mice represented the same biological object, each animal outputting physiological phenotype's values within the range of the biological noise. Secondly, when the animals were divided into 3 subgroups and fed differently, they were not the same at the end of the experiment, based on the observations of the aforementioned physiological values. The different environmental input submitted to the initially homogenous set of animals produced 3 subsets of different animals. The principle components analysis (PCA) plots in Figure 4 suggest that the RNA content of the liver for these 3 groups of animals was also different, and the data itself, which is the output of a series of molecular transformations, has kept that difference. The environmental challenge caused a physiological change as well as a change in the composition of the RNA featured in the liver.
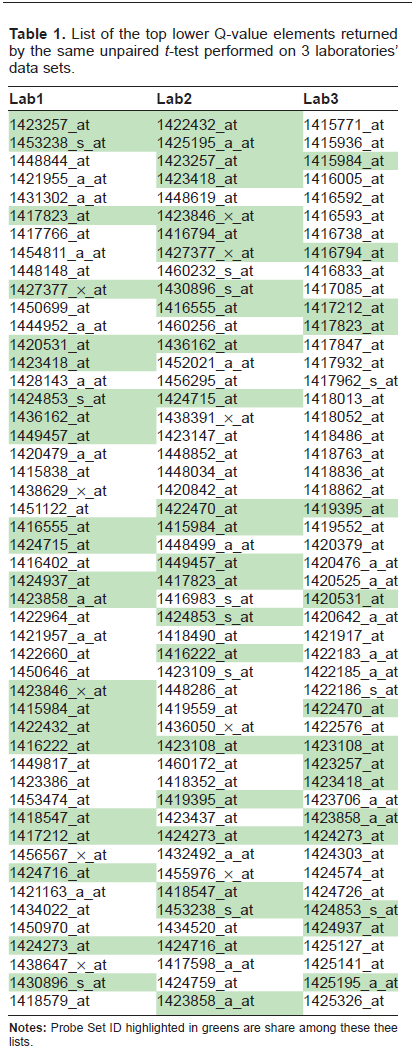
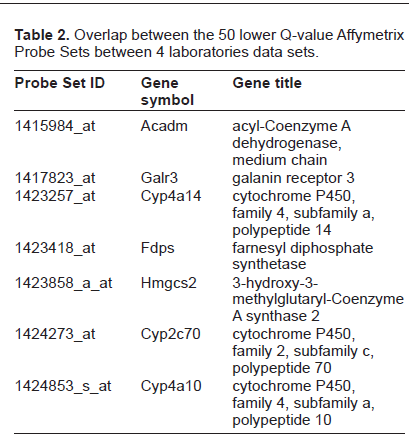
Altogether, these initial explorations allowed for the conclusion that the RNA molecules quantified in this study were not degraded and were suitable for subsequent correlation studies. The density plot of the normalization outcome shown in Figure 4 shows the expected adjustment brought in to the data set distributions. The data sets, regardless of the biological conditions, centered on the same value and exhibited a similar spread. The normalization's scope is to prevent artifactual shift in the mRNA level matrix brought in by some inherent technical variability (eg, with the optical instrument of the Affymetrix scanner). From these series of observations about the data, there was no evidence yet that would have suggested that the source of biological variability was not conserved in any of these 5 data matrices. Therefore, it looked as if one could confidently infer which mRNA molecules exhibited a change correlating with the perturbation brought in by the different feeding conditions. A reasonable approach to identify these elements was to perform a parametric test, assuming a normal distribution of the mRNA-level populations. This assumption might not even been required in this case, given the number of replicates, large enough to rely on the Central Limit Theorem. An independent samples t-test was run to address the question of whether some mouse liver mRNA have their respective level shifted to a different distribution whenever the mice were under high caloric food intake as opposed to low caloric. In other words, 2 conditions out of the 3 of the original design were chosen for further exploration of the data set. Given the large number of elements of the set to be compared (ie, ~40,000), the t-test was followed by a correction for multiple comparisons using a false discovery rate (FDR) analysis in this case. 19 This pairwise comparison was run initially on 1 laboratory data set. Table 1 shows the top lower Q-value Affymetrix Probe Set elements returned from this test. The Q-value is lower than 1.10e-7, which allows us to conclude with fairly high confidence that these 20 elements do not belong to the distribution of reference (ie, the distribution level of mRNA extracted from low caloric fed-mice). Following this test on 1 laboratory data set, the exact same comparison, under the exact same data analyses procedure was run. Table 1 shows the top 20 lower Q-value Affymetrix probe set elements for the 3 of the 5 laboratory data sets. Table 2 shows the overlap between the 5 data sets. Unexpectedly, only 20% of Affymetrix Probe Set elements had common values across the 5 lists.
List of the top lower Q-value elements returned by the same unpaired t-test performed on 3 laboratories’ data sets.
Overlap between the 50 lower Q-value Affymetrix Probe Sets between 4 laboratories data sets.
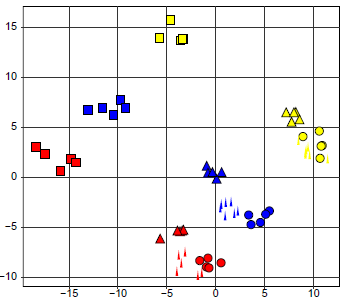
The PCA discussed in the Figure 4 suggested that the mRNA-level data sets maintained sources of the biological variability. The result of Table 1 argued that there is more information content in these data sets, in addition to the biology of liver cells. The whole data set, which included the 5 laboratory measurements, was analyzed as a single data set: the 75 CEL cell intensity files (referred to as CEL files) were used as input for the Robust Multi-array RMA normalization operation and a single normalized data matrix featuring the 75 conditions was created. The PCA score plot in Figure 5 shows that there was 1 source of variability that was not accounted for by the mouse liver cell physiology. The data points clustered with regards to the laboratory where the RNA has been processed. The main difference between the laboratories was how the RNA has been labeled. These differences in the RNA labeling, how subtle they might seem, obviously did modify the final nucleic-acids composition mix applied to the microarray. While the plots of the Figure 4 show that the 5 data sets contained biologically meaningful informational contents, the plots in Figures 5 and 6 and results in Table 1 indicate that any post RNA extraction manipulations potentially modify the original RNA composition. Stated differently, RNA processing operations can cause a loss of biological information. More worrisome is the fact that such a study has never been performed. However, there are ample gene expression studies reported in the literature where the variability in RNA content is attributed exclusively to biological variability.
Principal component analysis score plot of the 5 technical replicates.
Principal Component Analysis score (
Conclusion
Pca Analyses Allow Telling Apart the Rna Composition Differences Due to the Biology Variability Vs. the Technical variability
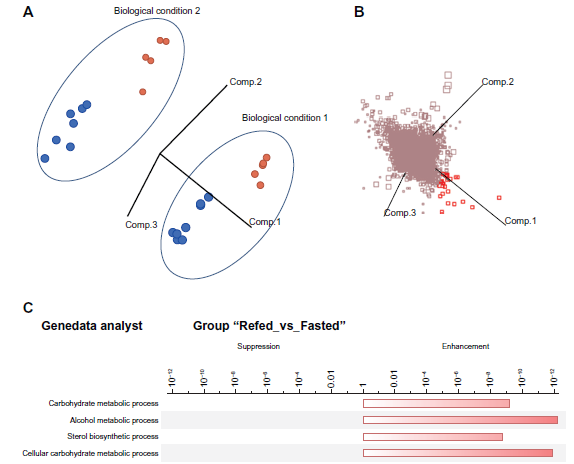
The ease with which RNA content can be measured in a high throughput manner, has made it the biomolecule of choice for a whole range of biological studies where the objective is to correlate a change in a biological factor with respect to a change in discrete RNA molecule content. The assumption of these studies is that the variability of mRNA-level data captured by either micro-array-based and/or PCR-based methodology is uniquely attributable to the change in biology. In this report, we show that this is seldom the case. Therefore, we suggest that revisions to experimental designs be made prior to being confident in any biological knowledge obtained from these studies. The experimental design of this current report is an exception and is thus unlikely to become the norm. However, this data set gave us the opportunity to unravel the extent to which post-extraction RNA processing impacts the final read-out. The alignment of the loading and scoring plot in the Figure 6 allowed us to identify which variable (ie, which Probe Set measurement) actually contributed to the spread of data points on the score plot, due to the biological factor. In the score plot of the Figure 6A, the relative position of each dot corresponds to a sample. This position is specified by the numerical values of Affymetrix Probe Set variables. The samples cluster with regards to the laboratory where the measurement was done, and also to the biological condition. In other words, the data set features two pieces of information. If the original distribution of RNA had been the unique contributor of variability, the samples would have clustered into two groups only. The loading plot (Fig. 6B) is superimposable with the score plot. The clustering of the samples with regards to the biological conditions is specified by the Probe Sets that are co-localized in the two 3-dimensional plots. The loading plot therefore provides the means to interpret the score plot and identify which independent variable (ie, the mRNA) contribute to the biological variability. These Probe Sets, highlighted in red in the loading plot, map to the 25% overlap of the Table 1, as expected. These 25 Probe Sets correspond to the conserved biological variability. These RNA were present in a different quantity in the liver of the mouse cell prior to RNA extraction. The remaining changes in the RNA composition are due to the effect of the RNA labeling procedure.
Lessons from Gene Set Enrichment analyses
As more than 1 high throughput method has been devised since the early days of DNA microarrays almost 20 years ago, legitimate concerns were raised as to the relevance of comparing 1 data set acquired from 1 method (eg, Affymetrix GeneChip) with another method (eg, Agilent microarray). The debate also moved to the comparison between array-based methods with PCR-based methods, exemplified by quantitative real-time PCR. The latest update on that matter, released by the FDA study group called the MicroArray Quality Control (MAQC), advised the research community that overall, data sets collected from various platforms perform relatively in concordance to each other. 10 2 comments might be added to the current recommendations of the MAQC group: (i) no study was performed with respect to the other component of the high throughput RNA measurement, ie, the preparation of the labeled RNA; (ii) despite some overlap between the results return from the same biological sample from 2 distinct assay platforms, there remains a large fraction of observations that are due to the idiosyncrasy of the measurement. These ‘artifacts’ are usually not filtered out by the research community; rather they tend to accumulate in the knowledge based derived from transcriptomic studies. In order to illustrate this latter point, we used the 100 lowest Q-value elements of each of the 5 laboratory data sets as argument for 1 of the implementations of the algorithm, altogether referred to as Gene Set Enrichment Analysis (GSEA). 20 All 5 queries return very similar answers. The scope of the Gene Set Enrichment query is to identify any significant contribution of 1, or more than 1, genes’ classes according the Gene Ontology classification. 20 Genes are grouped into categories, in this case 3, including a biological component, the cellular location and biochemical activity. This classification relies on prior knowledge and falls within the gene ontology classification. 21 The GSEA queried the Gene Ontology database with a query set of 100 elements, assign each element with their cognate attributes’ value and applies a nonparametric test (eg, the Kolmogorov—Smirnov test) to infer the occurrence of gene ontology attributes’ values (carried by the 100-element set) which was significantly overrepresented. The scope of GSEA is to provide a means to interpret the outcome of a high throughput gene expression result as described in this article: it is meant to derive some biological information from a list of genes. There is value in this analysis as exemplified in Figure 6. To some extent, the GSEA result has to be interpreted in the light of the PCA plots shown in Figures 4 and 5. Both analyses provided evidence that this data set, the outcome of a long series of molecular transformation, holds some valuable biological information. The overlap between the 5 data sets, shown in the Table 1, are likely to be the genuinely differential mRNA levels correlating with the environmental challenge submitted to the biological system. These RNA species were identified by the GSEA since they share some common Gene Ontology attributes’ values. There is indeed enrichment for these gene ontology classes. The GSEA, therefore, returned the same answer to the 5 query lists. The fact that no other significant gene ontology classes were retrieved suggests that the remaining subset of different mRNA levels recorded in the data sets are stochastic events, caused by the various methods applied to label the RNA. The biochemical and molecular methods applied to the raw RNA up to the labeled nucleic acids assayed with the microarray disturbed the original distributions of RNA, eventually causing a partial loss of biological information. A matter of concern lies in the inference procedure used with GSEA results: in some instances authors would assign the gene ontology class returned by the GSEA query to all the elements of the query list. The rationale is, given that the GSEA returned an expected outcome, the whole query set is bona fide material that will reliably provide biological knowledge (the GSEA in this scenario is basically used as an additional QC metric). In the case of this study, that would allow us to conclude that the 100 elements of the GSEA query were all involved in carbohydrate metabolism. Our study clearly indicates that this conclusion was unfounded.
The literature is unfortunately populated with a growing number of reports where lists of genes are assigned to particular phenotype by virtue of the aforementioned inference procedure. In accordance with other investigators engaged in genomic research who recently reported the need to be more vigilant and transparent with regards to the documentation and recording of published data, 22 this report reinforces their recommendations: high throughput genomics data sets needs to be recorded in settings that minimize the source of confounding effects.
Author Contributions
Conceived and designed the experiments: VW. Analyzed the data: MD. Wrote the first draft of the manuscript: MD. Contributed to the writing of the manuscript: VW, MD. Agree with manuscript results and conclusions: VW, MD. Jointly developed the structure and arguments for the paper: VW, MD. Made critical revisions and approved final version: MD. All authors reviewed and approved of the final manuscript.
Funding
Author(s) disclose no funding sources.
Competing Interests
Author(s) disclose no potential conflicts of interest.
Disclosures and Ethics
As a requirement of publication the authors have provided signed confirmation of their compliance with ethical and legal obligations including but not limited to compliance with ICMJE authorship and competing interests guidelines, that the article is neither under consideration for publication nor published elsewhere, of their compliance with legal and ethical guidelines concerning human and animal research participants (if applicable), and that permission has been obtained for reproduction of any copyrighted material. This article was subject to blind, independent, expert peer review. The reviewers reported no competing interests.
Footnotes
Acknowledgement
The RNA samples were isolated by Sylvie Perez and Bryan Goodwin using the standard total RNA isolation protocol; we thank their generosity for proving the total RNA that were used in this analysis. The Affymetrix array analysis was performed by external contract research organizations under the fee-for-service agreement.