
Abstract
We present evidence that butyrate induced histone acetylation regulates miRNA expression. MicroRNA expression microarray profiling revealed that 35 miRNA transcripts are significantly (P < 0.05) differentially expressed after cells were treated with 10 mM butyrate. Among them, 11 transcripts are differentially expressed very significantly (P < 0.01). The functional and pathways analysis using MetaCore analytical suite shows differentially expressed miRNAs targeting some very important gene networks and differentially expressed miRNAs may interfere with butyrate induced modulation of gene expression and cellular functions. The data indicates the complicated interaction between miRNA and histone acetylation forms a highly integrated regulatory mechanism.
Introduction
The recognition that nutrients have the ability to interact with and modulate the molecular mechanisms underlying an organism's physiological functions has prompted a revolution in the field of animal and human nutrition. One paradigmatic example of the nutrient-epigenetic-phenotype relationship is that of volatile fatty acids (VFAs) and their gene expression regulation activities. VFAs fulfil up to 70% of energy requirements in ruminant species. Our previous studies revealed that VFAs, especially butyrate, participate in metabolism as nutrients and as inhibitors of histone deacetylases (HDAC), which are one of the most important types of epigenetic regulators. The major biochemical change that occurs in cells treated with butyrate and other HDAC inhibitors is the global hyperacetylation of histones.1,2 Clear evidence is beginning to link modifications in chromatin structure to cell cycle progression, DNA replication, and overall chromosome stability. 3 Data from bovine in vitro experiments shows that as the direct result of hyperacetylation of histones induced by butyrate treatment at physiologic concentration cultured bovine cells are arrested in the early G1 phase, and DNA synthesis is eliminated as assayed by bromodeoxyuridine (BrdU) incorporation and flow cytometric analyses.2,4 At a relatively high concentration, butyrate also induces apoptosis in an established bovine MDBK cell line. In isolated ruminal epithelial cells, DNA replication is also inhibited by butyrate treatment. 5 However, the molecular basis of these effects is poorly defined.
On the other hand, the profound changes in gene expression induced by butyrate in bovine cells elucidate the effects of histone acetylation. 6 At the physiologic concentration, butyrate regulates the expression of individual genes by inhibition of histone deacetylation and attendant chromatin remodelling.7–9 The modulation of genome expression as a consequence of chromatin structural changes is considered a major mechanism. Utilizing global gene expression profiling, our recent studies indicate that butyrate induces significant changes in the expression of genes associated with regulatory pathways critical to cell growth, immune response, and signal transduction.6,10 A majority of these genes were repressed by butyrate and are associated with cell cycle control.
Butyrate is a histone deacetylase inhibitor (HDACi), which theoretically reactivates epigenetically-silenced genes by increasing global histone acetylation. However, our global gene expression profiles of bovine kidney epithelial cells indicate that there are more genes down-regulated than genes are up-regulated by butyrate. Similar results were also reported from human hepatocarcinoma.6,11 Those results are significant for the evaluation of VFAs, as well as for histone acetylation, as such results suggest that previous models of action of histone acetylation may require revision simply because it does not reflect the most recent data.
MicroRNAs are a class of highly conserved, small noncoding RNAs (∼22 nucleotides) that regulate gene expression post-transcriptionally. 12 MicroRNAs (miRNAs) bind to complementary sequences in the three prime untranslated regions (3′ UTRs) of target messenger RNA transcripts (mRNAs), usually resulting in gene silencing. 13 miRNAs are encoded by specific genes in the genome, which are transcribed as primary transcripts called primary miRNA. Histone modification and the miRNA are the two different regulatory pathways of gene expression. However, in recent years, there has been some evidence indicating that two pathways may cross-talk and interfere with each other. 14 In this report, we present evidence that butyrate induced histone acetylation regulates miRNA expression, and in return, miRNAs may interfere with butyrate induced modulation of gene expression and cellular functions, which may be the results of the cross-talking of miRNA and histone acetylation.
Materials and Methods
Cell Culture and Cell treatments
The Madin-Darby bovine kidney epithelial cells (MDBK, American Type Culture Collection, Manassas, VA, and Catalog No. CCL-22) were cultured in Eagle's minimal essential medium supplemented with 5% fetal bovine serum (Invitrogen, Carlsbad, CA) in 25 cm2 flask with medium renewal twice per week. Cell cultures were maintained in a water-jacked incubator with 5% CO2 at 37 °C. Sub-cultivations were performed when cells attained 80 to 90% confluence, according to the product information supplied by American Type Culture Collection. Cells were used for treatment testing at approximately 50% confluence, during the exponential phase of growth. Sodium butyrate (Calbiochem, San Diego, CA) was prepared as 1 M stock by dissolving it in ultra pure, deionized water (tissue culture grade, Advanced Biotechnologies Inc., Columbia, MD). Final concentration of sodium butyrate treatment is 10 mM. Adding up to 10 mM sodium butyrate into cell culture medium did not cause measurable pH change. Duplicated flasks of cells were used for each of treatment. After 24 hours of sodium butyrate treatment when indicated, cells were collected by trypsinization. Viability of cells was determined by Trypan Blue stain exclusion (Invitrogen).
In-Cell Western™ assay and Sapphire700™ and DRAQ5™ stain for cell number normalization.
In-Cell Western kit (Li-COR Biosciences) was used for In-Cell Western assay. The kit provides detection reagents for cell-based In-Cell Western assay. The procedures are detailed in the documentation that comes with the kit. Two cell stain reagents in the IN-Cell Western kit, Sapphire700™ and DRAQ5™, are used for cell stain and cell number normalization. The cell and antibody stain are detected with Odyssey Imager scanning (LI-COR Biosciences). Antibodies against H3 acetyl K18 (Cat# Ab1191), H3 acetyle K9 (Cat# Ab12178), H3 acetyl K27 (Cat# Ab4729), Acetyl lysine, H2A acetyl K5 (Cat# ab1764) are from Abcam (Cambridge, MA) and H4 tetraacetyl is from ActiveMotif (Carlsbad, CA, Cat# 39179). Antibodies against H3 acetyl K23 (Cat# 9674), H3 Acetyl k9/p-Ser10 (Cat# 9711) are from Cell Signaling Technology, Beverly, MA.
Isolation of Total RNA
Total RNA was extracted with TRIzol by following the manufacturer's recommendations (Invitrogen). Trace genomic DNA in the crude total RNA samples was removed by incubation with 4–10 units DNase I per 100 µg total RNA (Ambion, Austin, TX) at 37 °C for 30 min. Total RNA was further purified with an RNeasy Mini kit (Qiagen, Valencia, CA). The concentration of the total RNA was determined with a NanoDrop ND-1000 spectrophotometer (NanoDrop Technologies, Rockland, DE) and RNA integrity was verified with a Bioanalyzer 1000 (Agilent, Palo Alto, CA).
MicroRNA Expression Profiling microarray
MicroRNA microarray service supplied by LC sciences was used for genome-wide miRNA expression profiling. LC Sciences (www.lcsciences.com) provides a genome-wide miRNA (miRNA) expression profiling service using µParaflo® technology and proprietary probe design, which enable highly sensitive and specific direct detection of miRNAs. Standard arrays for mature bovine miRNA in the latest version of the Sanger miRBase database (Release 15) was used for this study. The service is comprehensive and includes sample preparation of total RNA sample, single or dual colour labelling, hybridization, image data processing and in-depth data analysis. Data we obtained includes the analyzed data, representative and original images of the array, and raw data, as well as in-depth analysis for our multiple data sets. The in-depth data analysis includes multi-array normalization, t-test, ANOVA, False Discovery Rate calculation, and clustering analysis. The content of each microarray chip is listed in the Supplement table S1. Multiple redundant regions are included. Each region further comprises a miRNA probe region, which detects miRNA transcripts listed in Sanger miRBase Release 13.0 (http://www.sanger.ac.uk/Software/Rfam/mirna/). Each chip also includes multiple control probes for quality controls of chip production, sample labelling and assay conditions. Three replicates of normal exponential growth cells and three replicates of butyrate treated cells are used for total RNA isolation and miRNA microarray profiling.
qRT-PCR Validation of MiRNA Microarray data
Five differentially expressed miRNAs (miR-20a, miR-184, miR-222, miR-26a and miR-182) were selected for qRT-PCR validation. In addition to no-template control, miR-120 was selected as negative endogenous control. Assay platform is TaqMan® MicroRNA assay (www.lcsciences.com).
Functional and Pathways analysis
To understand the molecular processes, especially the involvement of miRNAs initiated following stimulation by butyrate, the miRNA expression data were input into MetaCore for Enrichment analysis. Enrichment analysis consists of matching gene IDs for the common, similar, and unique sets of the uploaded files with gene IDs in functional ontologies in MetaCore. Enrichment analysis and gene regulatory networks were generated with the MetaCore analytical suite (Version 4.7, GeneGo, St. Joseph, MI). MetaCore is a web-based suite for the functional analysis of experimental data in the context of a manually curated database containing the probability of having the protein interactions, protein-DNA interactions, canonical pathways, and signaling pathways and knowledge base ontologies of cellular processes, diseases, and toxicology. The experimental data in MetaCore can be subjected to enrichment analysis 15 in six functional ontologies: gene ontology processes (GO), GeneGo process networks, diseases, GeneGo diseases, canonical pathway maps, and metabolic processes. Enrichment analysis in GO processes was used in this study. The degree of relevance to different categories in the uploaded datasets is defined by P-values so that the lower P-value gets higher priority. Both enrichment analysis and the calculation of the statistical significance of networks are based on P-values, which are defined as the probability of a given number of genes from the input list matching a certain number of genes in the ontology folder. The P-values can also be defined, as described in the supplementary files of Shipitsin et al 16 as the probability of the network's assembly from a random set of nodes (genes) that are the same size as the input list. The sub-networks were scored and prioritized based on relative enrichment using the data from the input list and saturation with ‘canonical pathways’ while using P-values and z-scores as statistical met-rics. 16 Networks of interest were also expanded by merging different networks.
Results
Butyrate Induces Profound Changes in MiRNA Expression in MDBK cells
In our previous study 2 and prior to the current miRNA microarray experiment, we monitored butyrate induced cell death and cell cycle arrest in MDBK cells in a time/dose-dependent manner using flow cytometry (data not show). Histone acetylation induced by butyrate was confirmed with In-cell Western (Fig. 1). For the purpose of this investigation and for determining the differential miRNA expression induced by butyrate, we selected a single concentration of 10 mM butyrate proven to be able to generate maximum biological impacts in cell cycle arrest and without massive cell death (about 20%). Detached dead cells were removed with medium before collection of cells by trypsinization. Viability of cells was determined by Trypan Blue stain exclusion (Invitrogen).

In-cell Western shown that acetyl sites on H3 and H4 in bovine cells are responding to butyrate treatment in a dose-dependent manner. Red: Sapphire 700 and DRAQ5 stain for cell number normalization; Green antibody stain. Lower panel: antibody stain of cells. Upper panel: overlapping image of cell stains and antibody stains. Cell stain and antibody stain are detected by Odyssey Imaging system, LI-COR Bioscience. Negative control: without primary antibody; mock control: cells without butyrate treatment and anti-H3 acetyl K18 antibody was used as primary antibody.
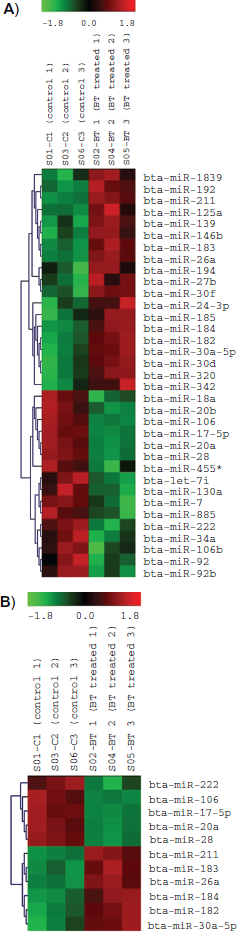
MicroRNA microarray profiling of miRNAs-statistic test and clustering analysis show butyrate induces profound changes in miRNA expression in MDBK cells. All miRNAs (143 transcripts) which are differentially expressed and signal intensity >32 are shown in clustering graph (Fig. 2). After eliminating the transcripts that have low signals (signal <500), there are 35 transcripts that are significantly (P < 0.05) differentially expressed (Fig. 3a). Among them, 11 transcripts are differentially expressed very significantly (P < 0.01) (Fig. 3b).

Clustering graph of all miRNAs with signal intensity >32. C1, C2 and C3: control sample number 1, 2 and 3; BT1, BT2 and BT3: 10 mM butyrate treated sample number 1, 2 and 3.
miRNA microarray data was validated by qRT-PCR on selected transcripts (miR-20a, miR-184, miR-222, miR26a and miR-182). Among 5 miRNAs, miR-20a and miR-222 were down-regulated and miR-184, miR-26a and miR182 were up-regulated in miRNA microarray. qRT-PCR results confirmed the microarray analysis (Table 1). All 5 miRNAs show directional confirmation (either up or down regulated) of microarray results.
qRT-PCR confirmation of expression of 5 selected miRNAs.

Note:
Fold change (real-time PCR): expression in the control group was set at 1.0.
Differentially Expressed MiRNAs Target Important Gene networks
To understand the potential consequences of these differentially expressed miRNA, we apply functional and pathways analysis using MetaCore analytical suite (Version 4.7, GeneGO, St. Joseph, MI). The gene content of the uploaded files is used as the input list for generation of biological networks using Analyze Networks (AN) algorithm with default settings. This is a variant of the shortest paths algorithm with main parameters of 1) Relative enrichment with the uploaded data, and 2) Relative saturation of networks with canonical pathways. These networks are built on the fly and unique for the uploaded data. In this workflow the networks are prioritized based on the number of fragments of canonical pathways on the network. Enrichment analysis consists of matching gene IDs of possible targets for the “common”, “similar” and “unique” sets with gene IDs in functional ontologies in MetaCore. The probability of a random intersection between a set of IDs and the size of the target list with ontology entities is estimated in P-value of hypergeometric intersection. The lower P-value means higher relevance of the entity to the dataset, which shows a higher rating for the entity (www.geneGO.com). The most relevant networks that are targeted by miRNAs that are differentially expressed upon butyrate treatment are listed in Table 2. The first network, in which four miRNA transcripts function as the key object of the network (miR-222 as divergence hubs and miR-222, miR-183 and miR-185 as edges out hubs), is shown in Figure 4. In this network, 6 transcription factors (Androgen receptor, ENO1, ESR1-membrance, ESR1-nuclear, NF-AT1 and RUNX2) are functioned as Edges In transcription factors. Androgen receptor, ESR1-membrane, ESR1-nuclear, RUNX2 and TCF8 function as Edges OUT transcription factors. The term “edge” in GeneGO refers to the definition used in the graphing mechanics in generating a biological network and is used in combination with the term “node”. An edge denotes the association of any biological/chemical component that is annotated in GeneGO's data base to have an effect on another project (a note) and is marked by an arrow (http://www.genego.com/pdf/Website_Glossary.pdf). Edge IN and Edge OUT are the direction of the edge in the network.
The most relevant networks that targeted by differentially expressed miRNAs.


The most relevant biological networks that is regulated by relevant miRNAs. Enrichment analysis consists of matching gene IDs of possible targets for the “common”, “similar” and “unique” sets with gene IDs in functional ontologies in MetaCore. The probability of a random intersection between a set of IDs the size of target list with ontology entities is estimated in P-value of hypergeometric intersection. The lower P-value means higher relevance of the entity to the dataset, which shows in higher rating for the entity (www.geneGO.com). This is a variant of the shortest paths algorithm with relative enrichment and relative saturation of networks with canonical pathways. Key network objects include miRNA-222, miRNA-185, miRNA-211 and miRNA-183. Up-regulated miRNAs are marked with red circles and down-regulated miRNAs are marked with blue circles.
The second network, in which miR-192 functions as Divergence hub and Edges OUT, is shown in Figure 5. Androgen receptor, BMAL1, NF-AT1, SIP1 and TCF function as Edges IN transcription factors and Androgen receptor, BMAL1 and TCF8 are Edges OUT transcription factors. Genes that were down-regulated due to butyrate treatment are marked with a blue dot while the up-regulated genes are marked with a red dot.

The second most relevant biological networks that is regulated by relevant miRNAs. Key network objects include miRNA-192, miRNA-184, and miRNA-205. Up-regulated miRNAs are marked with red circles and down-regulated miRNAs are marked with blue circles.
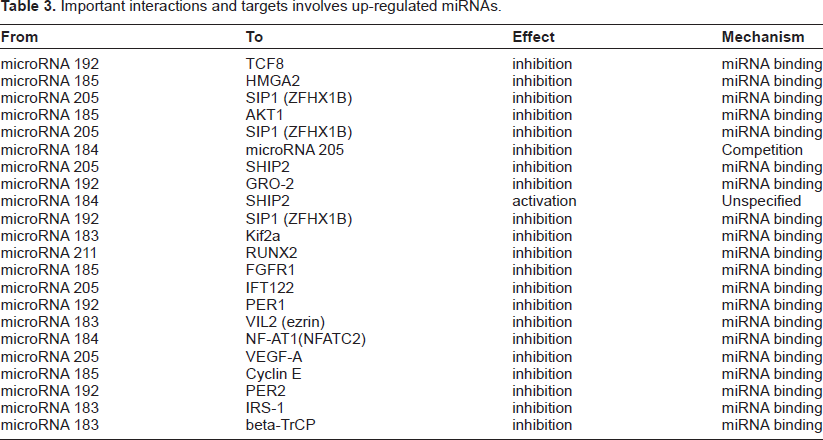
MicroRNAs target messenger RNA transcripts (mRNAs) which usually results in gene silencing. 13 We apply functional and pathways analysis using up-regulated miRNA as input data. The most relevant network (Fig. 6) was generated with a P-value = 9.92e−08. The function of this network is involved in regulation of cell proliferation (52.9%); B cell receptor signalling pathway (17.6%) and prostate gland growth (17.6%). Five up-regulated miRNAs (miR-185, miR-183, miR-192, miR-184, miR-211) play important roles in this network. Among them, miR-192 and miR-185 function as hubs of the network. miR-192 also is the divergence hub of the network. Three transcription factors, Androgen receptor, BMAL1 and CLOCK, also function as the hubs of the network. Eight transcription factors (BMAL1, CLOCK, Androgen receptor, TCF8, RUNX2, SIP1 (ZFHX1B), NF-AT1 (NFATC2) and ENO1) are regulated by the 6 miRNAs in this network. The important interactions between miRNAs and other genes in the network are listed in Table 3.

Functional and pathways analysis using up-regulated miRNA as input data. Five up-regulated miRNAs (miR-185, miR-183, miR-192, miR-184, miR-211) are the key network objects of this network. Up-regulated miRNAs are marked with red circles.
Important interactions and targets involves up-regulated miRNAs.
Discussion
Epigenetics phenomena are defined as changes in phenotype that are heritable but does not involve DNA sequence changes. 17 Three major categories of epigenetic mechanisms including DNA methylation, histone modification and RNA-associated silencing are used to initiate and sustain epigenetic regulation.
Histone modification, especially the posttranslational modifications of ammo-terminal tail domains have been defined as important epigenetic mechanisms in controlling gene expression.18,17 Butyrate, a component of short-chain fatty acids produced by anaerobic fermentation of dietary fibres in the gastrointestinal tract of mammalian species and then directly absorbed at the site of production. Short-chain fatty acids, especially butyrate, are important nutrients and function as signaling molecules. The molecular mechanisms involved in biochemical and molecular actions of these nutrients have been intensively studied in recent years, largely because butyrate's inhibition of cell proliferation and its potentiality for cancer therapy and prevention. There is a wealth of knowledge on butyrate as a histone deacetylase (HDAC) inhibitor.8,19 As the results of such inhibition, histones become hyperacetylated. It is widely accepted that butyrate functions as an epigenetic regulator through its HDAC inhibition activity. Our earlier studies confirmed that butyrate induces profound changes in gene expression related to multiple signal pathways and genomic networks in bovine cells. 20
In spite of increasing evidence for the important roles of miRNAs in transcription regulation, the regulation of miRNA is still poorly understood. MicroRNAs are transcribed from long primary transcripts and generally by Pol II.21–23 Therefore, over and above negatively regulating their target mRNAs, expression of miRNA can be regulated by transcriptional regulation mechanisms such as transcription factors.24,25 Epigenetic regulation mechanisms such as DNA methylation and histone modifications, have been suggested to control the expression of miRNAs.26–29
This evidence indicates that expression of miRNAs, as the regulator can have a profound effect in controlling gene expression, is regulated by epigenetic mechanisms such as histone acetylation and DNA methylation. In this report we show, to our best knowledge for the first time, that butyrate, functions as a HDAC inhibitor, induces profound changes in miRNA expression in bovine cells. However, many questions remain to be answered. For example, why are some miRNAs up-regulated and some of them down-regulated by butyrate? Are these differential expressions of miRNAs the results of interplay between the different epigenetic machineries, eg, DNA methylation and histone modifications? To answer such questions, more systematic approaches are required to elucidate the regulatory mechanisms for miRNA expression. One thing is convincing, however, that epigenetic modification such as histone acetylation induced by butyrate is part of multilevel regulatory machinery.
Understanding the regulatory mechanisms controlling miRNA expression is very imperative because miRNA can have extensive effects through regulation of a variety of genes that are essential for cell functions and are involved in the most crucial cellular processes from development, differentiation, cell cycle regulation as well as metabolism etc. MicroRNA and epigenetic regulation present a very complicated interplay because miRNA can regulate the expression of components of the epigenetic machinery by targeting molecules involved in the methylation or acetylation of DNA and histones. 29 In our case, butyrate-induced epigenetic modulation of gene expression results in profound changes in miRNA expression; in return, miRNA may play an important role in epigenetic regulation induced by butyrate through regulating the targeted gene expression by differentially expressed miRNA. The functional network analysis indicated that differentially expressed miRNAs target some important gene networks. All of those findings indicate that the complicated interaction between two different regulation machineries of miRNA and histone acetylation forms a highly integrated regulation mechanism.
Disclosures
Mention of trade names or commercial products in this publication is solely for providing specific information and does not imply recommendation or endorsement by the US Department of Agriculture.
This manuscript has been read and approved by all authors. This paper is unique and not under consideration by any other publication and has not been published elsewhere. The authors and peer reviewers report no conflicts of interest. The authors confirm that they have permission to reproduce any copyrighted material.
Footnotes
Acknowledgements
We are grateful to Sara McQueeney for careful reading of the manuscript.