
Abstract
Objective
Visfatin is a novel adipokine initially reported to exhibit insulin-mimetic effects that increase insulin sensitivity. Further studies indicate it may also be associated with obesity, serum lipids, and systemic inflammation. At the current time, the role of genetic variation in the visfatin gene
Research design and methods
A total of 1838 subjects (413 men, 1425 women) were recruited from the ongoing CODING Study. All subjects were from the genetically homogenous population of Newfoundland and Labrador, Canada. BMI, waist circumference, waist-to-hip ratio, and body fat percentage (determined using DXA) were measured for all subjects. Serum glucose, insulin, HOMAIR, HOMAβ, total cholesterol, HDL cholesterol, LDL cholesterol, triglycerides and hsCRP were also determined after a 12-hour fast. Ten SNPs in
Results
We observed no significant associations between any of the variants sites and any parameter of insulin resistance, body composition, serum lipids or hsCRP under an additive model with age and gender included as covariates. This was also true when both dominant and recessive models were applied.
Conclusions
Our results do not support a significant role for variations in
Introduction
Visfatin was first reported as a novel adipokine predominantly secreted from visceral adipose tissue however evidence now supports a pro-inflammatory role. Specifically, visfatin is expressed by macrofages infiltrating adipose tissue and is produced in response to inflammatory signals.1,2 Although it was initially suggested that visfatin had insulin-mimetic properties that increased insulin sensitivity, 3 this study was later retracted 4 as a subsequent report could not confirm the insulin-mimetic action of this adipocy-tokine. 5 Despite this, it has been demonstrated that circulating visfatin is elevated in patients with type 2 diabetes6,7 and obesity.8,9 Furthermore, we recently demonstrated that visfatin is positively associated with serum triglycerides and down-regulated by a short-term positive energy balance. 10
Visfatin is a 473 amino acid protein with a molecular mass of 52 kD that is encoded by the gene nicotinamide phosphoribosyltransferase (
Materials and Methods
Subjects
Subjects (n = 1838; 413 men, 1425 women) were recruited from an ongoing, large-scale nutrigenom-ics study (CODING Study25–27). All participants were from the genetically homogenous population of NL, Canada. Inclusion criteria were as follows: 1) at least third generation Newfoundlander; 2) healthy, without any serious metabolic, cardiovascular or endocrine diseases; and 3) not pregnant at the time of the study. The Human Investigation Committee of the Faculty of Medicine, Memorial University of Newfoundland approved the study and all subjects provided written and informed consent.
Measurements of Body composition
All measurements were performed following a 12 hour fasting period. Subjects were weighed to the nearest 0.1 kg in standardized light clothes and without shoes on a platform manual scale balance as previously described by us (Health O Meter Inc., Bridgeview, IL).25–27 Height was measured using a fixed stadiometer to the nearest 0.1 cm. BMI was calculated as a person's weight in kilograms divided by their height in meters squared. Waist and hip circumference were measured while the participant was in a standing position to the nearest 0.1 cm using a flexible metric measuring tape. Waist circumference was measured as the horizontal distance around the abdomen at the level of the umbilicus; hip circumference was measured as the largest circumference between the waist and thighs and waist-to-hip ratio was calculated. In addition to anthropometric measurements, whole body composition measurements including percentage body fat (%BF) and percentage trunk fat (%TF) were measured using dual-energy X-ray absorptiometry (DXA) Lunar Prodigy (GE Medical Systems, Madison, WI, USA). Measurements were performed on subjects following the removal of all metal accessories, while lying in a supine position as previously described.25–27
Serum measurements
Blood samples were taken from all subjects in the morning following a 12-hour fasting period. Serum was isolated and stored at –80 °C for subsequent analyses. Insulin levels were measured on an Immulite immunoassay analyzer (DPC, CA, USA). The homeostasis model assessment (HOMA) was used as a measure of insulin resistance (HOMAIR = insulin (µU/ml) x glucose (mmol/L)/22.5)) and β-cell function (HOMAβ = 20 x insulin (µU/ml)/(glucose-3.5)). 28 Serum concentrations of glucose, triacylglycerols (TG), total cholesterol (Chol), and HDL cholesterol were measured using Synchron reagents and performed on an L x 20 analyzer (Beckman Coulter Inc., CA, USA). LDL cholesterol was calculated using the following formula: (Chol)–-(HDL)–-(TG/2.2) which is reliable in the absence of severe hyperlipidemia. High-sensitivity C-reactive protein (hsCRP) was measured by nephelometry according to the manufacturer's protocol (Beckman Coulter Inc).
Genomic Dna Isolation, Genotyping and Selection of SNPs
Genomic DNA was isolated from approximately 5 ml of whole blood using the Wizard Genomic DNA Purification kit (Promega, WI, USA) according to the manufacturer's protocol as previously described by us.25,27 To assess the reproducibility of genotyping, 5% of samples were randomly selected and re-genotyped; all genotypes matched their initial called genotype. The ten SNPs investigated in the visfatin gene were rs7789066 (A>G 5′ flanking region), rs3801266 (A>G intron), rs6963243 (G>C intron), rs2058539 (A>C intron), rs6947766 (C>T intron), rs4730153 (G>A intron), rs10808150 (G>A intron), rs2098291 (C>T intron), rs10953502 (T>C intron), and rs10953501 (A>G 3′ UTR). Tagging SNPs were selected using a pairwise
Statistical analyses
All statistical analyses were performed using the statistical software R or SPSS version 16.0 (SPSS Inc., Chicago, IL, USA). Hardy-Weinberg equilibrium was tested using
Results
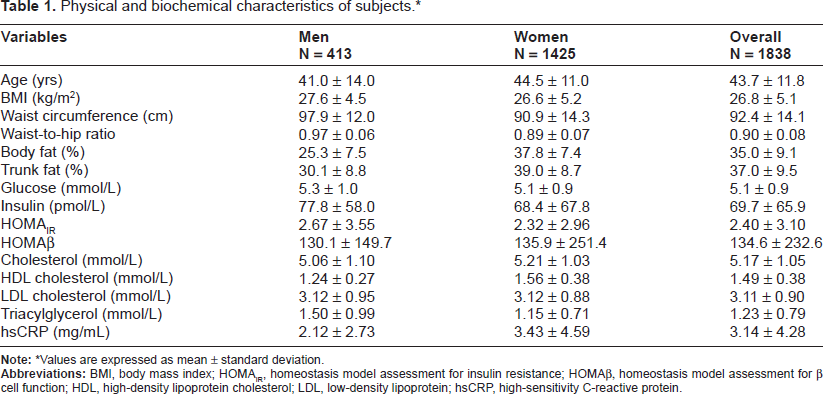
Physical and biochemical characteristics of all subjects are shown in Table 1. The mean age of participants was 43.7 ± 11.8 yrs and the mean BMI was 26.8 ± 5.1 kg/m2. Furthermore, subjects had normal fasting glucose levels as well as serum lipid profiles. Circulating hsCRP was measured to be 3.14 ± 4.28 mg/mL. A description of the ten SNPs genotyped, including location, type of variant, and minor allele frequencies (MAF), is shown in Table 2. All SNPs were fairly common variants (MAF 0.18–0.43) aside from rs7789066 (MAF 0.07) which is located in the promoter region of
Physical and biochemical characteristics of subjects.*
Note:
Values are expressed as mean ± standard deviation.
Summary of single nucleotide polymorphisms, allele frequencies, and Hardy-Weinberg equilibrium.*

Notes:
Hardy-Weinberg was estimated using
Tagging SNPs (SNPbrowser Version 3.5, based on HapMap CEU population).

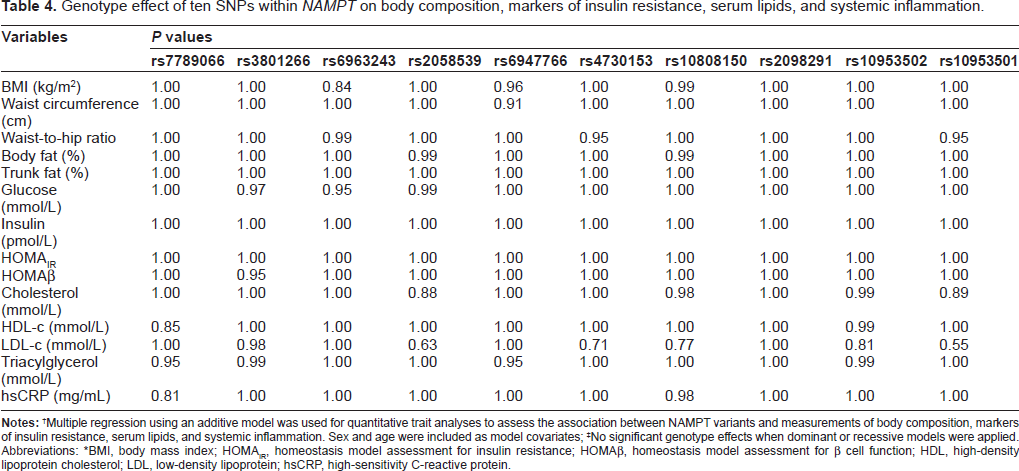
Table 4 shows the genotype effect of the 10 SNPs investigated in this study on measurements of body composition (BMI, waist circumference, waist-to-hip ratio, %BF, and %TF), markers of insulin resistance (fasting glucose, insulin, HOMA-IR, and HOMAβ), serum lipids (total cholesterol, HDL cholesterol, LDL cholesterol, and TG), as well as systemic inflammation (measured as circulating hsCRP). Multiple regression analyses were performed to test for association between the 10 SNPs in
Genotype effect often SNPs within
Notes:
Multiple regression using an additive model was used for quantitative trait analyses to assess the association between NAMPT variants and measurements of body composition, markers of insulin resistance, serum lipids, and systemic inflammation. Sex and age were included as model covariates;
No significant genotype effects when dominant or recessive models were applied.
Abbreviations: *BMI, body mass index; HOMAIR, homeostasis model assessment for insulin resistance; HOMAβ, homeostasis model assessment for β cell function; HDL, high-density lipoprotein cholesterol; LDL, low-density lipoprotein; hsCRP, high-sensitivity C-reactive protein.
Power calculations were carried out for a quantitative trait genetic association study (Fig. 1). Figure 1 illustrates the power profiles as a function of varying coefficients of determination for a range of heritability estimates (

Power profiles as a function of varying coefficients of determination for a range of heritability estimates.
Discussion
The physiological function of visfatin seems to be diverse. Initially, attention was focused on its relationship with type 2 diabetes however recent studies have demonstrated that visfatin may also be involved in the etiology of obesity,8,9 dyslipidemia,
29
systemic inflammation
30
and increased cardiovascular disease risk,
30
although these associations remain controversial. Furthermore, a number of genetic association studies have been performed investigating the effect of variants in
The current status of genetic association studies regarding visfatin is questionable at best. Although Zhang et al report a significant association with
We also sought to investigate the influence of variants within
Recent studies have indicated that visfatin may also be involved in low grade inflammation, as evidenced by associations with circulating markers of inflammation, including monocyte chemoattractant protein 1 and interleukin-6. 30 Recently, Zhang et al found that a SNP in the promoter region of the visfatin gene (–948 G>T) was significantly associated with higher plasma levels of fibrinogen and C-reactive protein in a group of 630 non-diabetic individuals. 16 In addition, carriers of the minor allele of – 1535 C>T had lower hsCRP and inter-leukin-6 levels in a group of patients presenting with either stable or unstable angina pectoris. 32 Contrary to these findings, we found no association between the 10 SNPs genotyped in our cohort and serum hsCRP levels. This is in agreement with the study by Wang et al that showed no association between – 1535 C>T and circulating levels of hsCRP, IL-6, and tumor necrosis factor α in patients with acute myocardial infarction. 32 At present, it appears that the role of genetic variation within the visfatin gene on regulating circulating factors related to systemic inflammation is unclear. Further work is required to address this issue.
In summary, no significant association was observed between 10 SNPs in
Sources of Funding
This study is supported in part by the Canadian Foundation for Innovation (CFI), the Canadian Institute for Health Research (operating grant: MOP-78947 to Guang Sun), and the Newfoundland and Labrador Centre for Applied Health Research (NLCAHR).
Author Contributions
JS assisted in data collection and preparation of the manuscript. JCL-O assisted in data analysis and critical revisions of the paper. GS was responsible for study design and concept, as well as editing the manuscript.
Disclosures
This manuscript has been read and approved by all authors. This paper is unique and is not under consideration by any other publication and has not been published elsewhere. The authors and peer reviewers of this paper report no conflicts of interest. The authors confirm that they have permission to reproduce any copyrighted material.
Footnotes
Acknowledgements
We would like to thank all volunteers who participated in the present study. We would also like to recognize the following members of our lab who contributed to data collection: Dax Rumsey, James Thorburn, Amber Snow, Aihua Ma, Sandra Cooke, Christiane Dawe, Lesley Johnson, Curtis French, Sammy Khalili, Jessica Bishop, Kristian Green, Kristina Sheridan, Farrell Cahill and Hong-Wei Zhang. Guang Sun holds the position of chair of pediatric genetics, which is supported by Novartis Pharmaceuticals.