
Abstract
Current
Keywords
Introduction
Current
All gas pollutants when emitted into the atmosphere are transformed into new secondary pollutants. These secondary pollutants have been shown to increase
Exposures to ambient air are needed to confirm results observed in the laboratory and also to guide new experiments. Bringing an
In this article, we describe the successful deployment of the GIVES in the field, used to expose human lung cells to ambient air found near industrial facilities. These field exposures were part of the February 2015 Benzene and other Toxics Exposure (BEE-TEX) study campaign that focused on pollution sources from the Houston Ship Channel. The GIVES deployment generated the necessary baseline data from negative and positive controls to ensure the quality of results generated in the field. This study demonstrated a real-world test of experimental protocols and exposure technology and generated the data needed to justify further analyses and future deployments.
Methods
Cell culture
The human epithelial lung A549 cell line was used for the field deployment. 18 The A549 cell line is a human pulmonary type II epithelial-like cell line derived from human alveolar cell carcinoma of the lung. The A549 cells are reproducible, culture well on membranes, and provide a robust genomic signal measured in previous laboratory-based pollutant exposures. Therefore, these cells were ideally suited for this study as it allows for a reliable replication of prior experiments. A549 cells were shipped to Baylor College of Medicine (BCM) in Houston, TX. Cells were thawed and transferred into a T75 flask with 20 mL of culture medium (F-12K, fetal bovine serum, and penicillin/streptomycin) and cultured at 37 °C under 5% CO2. The cells were between 73 and 78 passages for the experiments described. For all exposure experiments, 1.2 mL of Bovine Serum Albumin (BSA) starvation medium was used under the basolateral surface of the cells. At confluence (80%), the cells were split into a new T75 flask at a density of 1.8 × 10 6 cells/mL.
For all exposures, a six-well (800 mL) cell culture plate (CORNING, Life Sciences) was used. Cells were plated onto Millicell cell culture inserts with a 30 mm diameter, 5 mm wall height, and a Polytetrafluoroethylene (PTFE) membrane with 0.4 μm pore diameter (PICM0RG50, EMD Millipore Corporation). The Millicell inserts were placed into the plate wells, which allowed the medium to maintain the culture from beneath while the cells were exposed directly to air above the membrane maintaining the ALI. At least 24 hours prior to exposures, 8.5 × 10 5 cells/mL were placed in each well of the culture plate. Four hours prior to exposure, the culture medium was replaced with the starving medium (F-12K, BSA, and penicillin/streptomycin) and then transported from the BCM laboratory to the field site using an insulated cooler to minimize temperature variation and a bubble balance to maintain level. For all exposures, two identical six-well cell culture plates were used. One plate was placed in an incubator and exposed to clean air, while the second plate was placed in the GIVES for exposures to clean air, ozone, or the ambient air. All exposures with the GIVES were reported in comparison with the separate matching set of lung cells retained in the incubator.
Air pollutant exposure site, equipment, and protocol
The exposure equipment needed for the field exposures consisted of: GIVES instrument, humidification system, positive/negative control generators, CO2 supply, and a temperature-controlled incubator. This equipment was housed in a secure temperature-controlled portable field laboratory building bought for the BEE-TEX study, which was situated at 9700 Manchester Street (29°43′00.18′N, 95°15′21.83′W). To the north and northeast of the field site is the Valero Houston petroleum refinery; 450 m to the northeast of the field site is the Buffalo Bayou Park channel, and 545 m to the southeast of the field site is the Sims Bayou channel. Additional air pollution sources include the 610 East Loop Freeway 1.2 km to the east of the field site and a major railway connection 600 m from the field site.
At least four hours prior to exposure, the GIVES instrument was cleaned with ethanol, and the heating system was initiated until temperatures stabilized at 37 °C. At this time, the humidification system was also started and monitored until relative humidity was in the range of 60–90%. A flow rate of 1 L/minute was verified using a Gilibrator flowmeter, and CO2 was also supplied to the instrument at 0.05 L/minute. We have demonstrated in our previous experiments that the GIVES had no biological response in expression of IL-8 mRNA relative to control when sampling clean air with particles.
9
Thus, a filter was not used to remove particles from the sample line. After exposures, the plates of A549 cells from both the
Cytotoxicity measurements
The cellular supernatant was analyzed for the enzyme lactate dehydrogenase (LDH) using a Pierce™ LDH Cytotoxicity Assay Kit (Thermo Fisher Scientific). Lung cells in the incubator and also from the GIVES were analyzed in triplicate and scanned for measuring the absorbance at 492 and 690 nm wavelengths using Thermo/LabSystems 352 Multiskan MS Microplate Reader. The outliers were identified as those with <5% probability of occurrence relative to a normal distribution.
19
LDH data were determined for each of the six wells in the exposed plate from GIVES and for the six wells in the plate in the incubator exposed to clean air. Fold change in LDH was calculated by dividing the six well mean values of the exposed samples in the GIVES by the six well mean values of the samples from the incubator. Percent death was calculated by normalizing to 100% cytotoxic conditions of a 7.5-fold change.
20
Data were analyzed using an unpaired Student's
RNA extraction
Total RNA, including small RNAs with ≥18 nucleotides, was extracted from exposed cells using a modified QIAGEN's miRNeasy protocol. Briefly, the cells stored in TRIzol were allowed to thaw at room temperature and were homogenized using a QIAshredder. The homogenate was incubated at room temperature for five minutes, after which 200 μL of chloroform was added and the mixture was again incubated at room temperature for three minutes, followed by centrifugation at 12,000 ×
Gene expression/mRNA analysis
A total of 50 ng of RNA extracted from A549 cells was evaluated for comparative expression of various gene targets using NanoString's nCounter Inflammation and PanCancer Pathway Panels representing 249 and 730 genes respectively (NanoString Technologies, Inc.). These genes were selected because they represent major biological response categories that we observed to be modified in expression in our previous genome-wide study in lung cells. 13 These panels also include 40 and 6 housekeeping genes. The NanoString Technologies, Inc., employs the specific binding of unique digital barcodes for each target of interest. Probes for each target include a visible reporter probe and a biotinylated capture probe, to which target mRNA is hybridized overnight at 65 °C. Excess probes and nontarget transcripts were washed away, and the remaining probe-bound target transcripts were immobilized on a streptavidin-treated cartridge. The molecules were aligned and fixed using an electrical field, and the cartridge was moved to the nCounter instrument where an epifluorescence microscopy and a Charge-coupled device (CCD) camera were used to capture the images of target-probe complexes. The digital images were processed within the nCounter instrument and counts were tabulated and reported.
mRNA normalization and analysis
mRNA data were normalized and processed separately using the Partek Genomic Suite. Data were normalized in a two-step process as per the manufacturer's specifications.
21
First, positive control normalization was carried out followed by housekeeping gene normalization. The six housekeeping genes used for normalization of the Inflammation Panel were clathrin heavy chain (
Results
Exposure characterization
To characterize the ambient exposure to the A549 lung cells, meteorological data and ambient measurements were collected from nearby Continuous Ambient Monitoring Stations (CAMS) 1029 and 403.22,23 The Texas Commission on Environmental Quality operates these monitors, and their locations relative to the field site are shown in Figure 1. Both monitors report hourly average data and collect pollutant concentrations and metrological data. Ambient measurements were also collected at the field site by the University of Houston (UH) with their Mobile Atmospheric Laboratory for real-time monitoring of ambient pollution. In addition to ozone, NO, NO2, and SO2 measurements, the mobile lab operated a proton-transfer-reaction mass spectrometer (IONICON) and provided measurements of methanol, acetonitrile, acetaldehyde, acetone, benzene, toluene, C2-benzenes, C3-benzenes, styrene, and methyl ethyl ketone. The pollutant concentrations were recorded every three to five seconds, and the data were averaged into hourly values. Whenever possible, the UH data were used since it was the closest to the field site otherwise data were supplemented by the CAMS.

Map showing the location of the CAMS 1029 and CAMS 403 monitors. Also shown are the field site, the Valero refinery, and the Baylor College of Medicine laboratory where the human lung cells were prepared.
The GIVES sampled ambient air for the three days, February 18, 24, and 26, 2015. For each day, the pollutant concentration mean, standard deviation, and median were calculated using hourly average data that coincided with the exposure period from 12 to 4 pm central standard time (CST). As shown in Table 1, each of these days consisted of a mixture of fresh and oxidized pollutants. February 18 and 26 show the largest measurements of ozone concentrations with a mean of 40 and 36 ppb. February 18 also had a mean of 68.6 ppb of NO2, a concentration more than four times higher than that on the other days. These data suggest that all these days consisted of exposures to an air mass that has gone through significant photochemical aging. Freshly emitted pollutants included a number of aromatics and light alkenes with concentrations similar for all three days. The measured total sum of aromatics had a mean of~10 ppb and measurements of propylene of ~0.5 ppb and ethylene of ~1 ppb.
Ambient measurements from the CAMS 403 monitor and the University of Houston field site (bold).
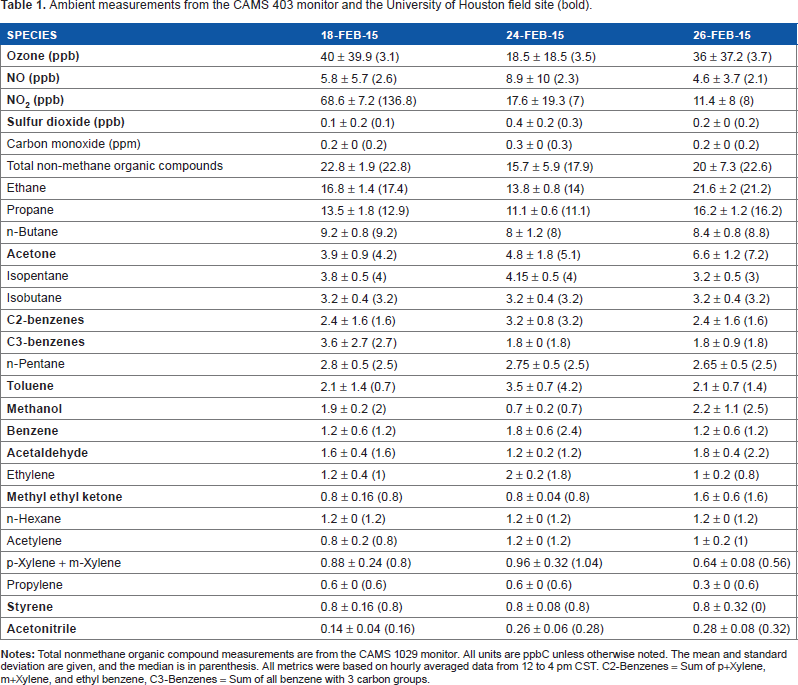
Figure 2 shows the wind speed and direction for all the three days. February 18 shows a wind from the west, which suggests the 610 East Loop Freeway as a possible source of the elevated NO2 concentrations. The other two exposure days show winds from the north, which could be impacted by the Valero refinery. Wind speeds were relatively calm with February 24 having the slowest speeds. Table 2 provides additional meteorological parameters from the exposure period. There was no precipitation on these days, and the relative humidity ranged from a mean of 28.7% on February 18 to a mean of 73.8% on February 24. February 24 also had the lowest solar radiation among the three exposure days.

Schematic of the sample airflow from sources (clean air, ozone, and ambient air) through the humidification unit and into the GIVES exposure instrument housing the lung cells.
Meteorological measurements from the CAMS 403 monitor and the University of Houston field site (bold).

Negative and positive control exposures
The negative control exposures confirm the integrity of the exposure equipment and protocols used in the field. For the negative control exposure, the GIVES was connected at the field site to medical grade clean air as illustrated in Figure 3, and a total of three clean air experiments were completed. For each negative control exposure, a second six-well plate of lung cells was placed in an incubator and exposed to clean air. The LDH assay was used to quantify the results of the three negative control experiments and reported as fold change over the lung cells housed in the incubator. All data were then normalized to a maximum cytotoxicity of a 7.5-fold change. 20 In Figure 4, LDH expression is presented as the mean of the three positive control experiments and two negative control experiments normalized to LDH released under conditions of maximum cytotoxicity. The data show that the clean air exposures did not induce a significant increase in LDH.

Hourly averaged wind speed and resultant wind direction for the three ambient exposures (February 17, 22, and 27, 2015) where the dot represents the tail of the wind vector.

LDH expression and standard deviation calculated as a fold change when compared with lung cells in an incubator exposed to clean air normalized to maximum cytotoxicity. A 7.5-fold change represents maximum cytotoxicity. The positive control exposure (O3) results are the mean of three experiments, and the negative control exposure (clean) results are the mean of two experiments. The ambient air exposure (Ambient) results are the mean of three experiments (February 17, 22, and 27, 2015).
The field site also contained an ozone generator (Dynamic NO–NO2–O3 Calibrator Series 101, Thermo Electron Corporation) that was connected to the GIVES for two positive control exposures at concentrations of 400 ppb. For each positive control exposure, a second six-well plate of lung cells was placed in an incubator and exposed to clean air. The LDH results of ozone exposures were compared with the lung cells housed in the incubator and normalized to maximum cytotoxicity. Figure 4 shows a 53% response confirming that the exposure concentration of ozone utilized in this study did produce a significant (
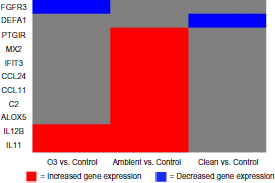
Heatmap displaying the 11 differentially expressed genes in association with the exposures.
Both the clean air and ozone exposures replicated responses seen in the laboratory. 10 This suggests that the instrument itself and the field deployment did not have an adverse impact on the cells. Thus, any cellular responses are solely the result of the ambient exposure.
Ambient exposures alter immune-related gene expression in lung cells
Three days of ambient exposures were completed on February 18, 24, and 26, 2015. For these ambient exposures, the
Differentially expressed genes in response to air toxics exposures.

The nine genes that showed significant changes in gene expression in response to ambient air were associated with immune and inflammatory responses including arachidonate 5-lipoxygenase (
Discussion
The current paradigm for the identification of the
Evidence for the success of the field deployment of the
Changes in the expression levels of genes known to play a role in inflammatory response were identified in response to ambient air exposure. These included asthma-associated genes:
While our data highlight the feasibility of
Conclusion
This study provides the first test of a field-deployed lung cell experiment to examine the genomic response of lung cells to complex mixtures of air pollutants, including HAPs. Future research can expand upon this study to examine other biological responses to measured atmospheric pollutants. The potential to produce
Author contributions
Conceived and designed the experiments: WV, KS, RCF, BL. Analyzed the data: WV, KS, HN, LS, JHF, SA, MHE, RCF, BL. Wrote the first draft of the article: WV, KS, HN, RCF, BL. Contributed to the writing of the article: WV, KS, HN, LS, KMA, CS, JHF, SA, MHE, RCF, BL. Agreed with the article results and conclusion: WV, KS, HN, LS, KMA, CS, JHF, SA, MHE, RCF, BL. Jointly developed the structure and arguments for the article: WV, KS, HN, LS, KMA, CS, JHF, SA, MHE, RF, BL. Made critical revisions and approved the final version: WV, KS, HN, LS, KMA, CS, JHF, SA, MHE, RCF, BL. All authors reviewed and approved the final article.
Footnotes
Acknowledgments
We would like to thank everyone involved with the Benzene and other Toxics Exposure (BEE-TEX) study for their assistance and the communities of Manchester, Galena Park, and the Milby Park neighborhoods for their support.