
Abstract
This study uses bibliometric techniques and social network analysis to evaluate 318 publications on air quality management in cities worldwide. The relevant data were retrieved from the Scopus database and analyzed using the VOSviewer 1.6.7 tools. The analysis included the number of publications, citation analyses, research study area analyses, and the most common keywords from 1975 to November 6, 2022. In addition, based on the results of the cluster analysis, we developed co-occurrence networks that enable a more specific keyword classification. The visualization showed the existing relationships between key terms, research study areas, and publications dealing with air quality management in cities. China, the United States, and the United Kingdom led in terms of the number of scientific publications and overall strength of connections during the study period. The most productive journal was Science of the Total Environment, followed by Atmospheric Environment, and the International Journal of Environmental Research and Public Health. Several limitations of the study are described and recommendations are made for future studies to increase the scope of studies and facilitate urban air quality management.
Keywords
Introduction
Air pollution refers to the presence of harmful toxic substances in the atmosphere generated by both anthropogenic activities and natural phenomena. 1 Air pollution is a major health risk worldwide, 2 affecting the health of millions of urban dwellers.3 -5 According to He et al, 6 air pollution poses significant health risks to people in developing countries, where pollution levels are often orders of magnitude higher than in developed countries. According to a study showed by Jiang et al 7 in China, straw burning has become a major source of pollution in recent years as it poses a great risk to the lung health of residents in exposed areas. Due to rapid economic development and urbanization, an increasing number of countries are confronted the dual challenges of air pollution and climate change. 8 In particular, particulate matter (PM2.5) has been linked to harmful effects on human health, but the chemical components that cause harm are unknown. 9 Urban air pollution therefore poses a significant threat to human health and the quality of life of millions of people.10,11 Managing air pollution is a major environmental challenge in urban environments. 12 Cities face major challenges related to changes in urban metabolism (the exchanges and processes of resources that shape cities, serve the needs of their populations and impact the local environment) and the impacts of climate change. 13
In recent years there has been a massive increase in urbanization at regional and national levels worldwide. 2 A study conducted by the World Bank, 14 in 2019 reported that the cost of mortality attributable to PM2.5 in 26 urban areas was 7.8 and 9.0 billion Euros according to integrated exposure response (IER) and concentration response function (CRF) methodologies, respectively. Urbanization and the associated increase in mobility and industrialization have led to an intensification of air pollution in densely populated areas and thus to a deterioration in air quality. 15 Urban air pollution is high on global health and sustainability agendas, but information on associated city-level disease burdens is limited. 16 Various scientists explained that with high population density and industrial production, large numbers of fine particles are inevitably released. 17
Air pollution exacerbates asthma, allergy and other respiratory diseases. 11 Moreover, air pollution ranks ninth in overall disease burden globally. 18 Concentration of PM2.5 is harmful to people who are unusually sensitive to particulate pollution and have other health problems. 19 Major diseases that could lead to both direct and indirect mortality, especially from PM2.5 in ambient environments, include respiratory, cerebrovascular, diabetes, and other chronic diseases, and pneumonia. 20 Urban-rural disparities in exposure to PM2.5 were associated with 16.5 deaths per 100 000 population in urban areas and 3.4 deaths per 100 000 population in rural areas. 21
Controlling air pollution can bring significant benefits to human health, visibility, agriculture and forestry, construction materials and natural ecosystems. 22 Air quality control initiatives face uncertainties about the sources of pollution and their contribution to air pollutions levels in a given city. 23 Air quality management strategies are difficult to implement because the formation of air pollutants is interdependent and air quality in different locations may respond differently to emissions from common sources. 24 An appropriate urban air quality management plan is a proficient tool for managing acceptable urban air quality. 25 Effects of greenhouse gas emission reductions on air quality are playing an important role in regulatory plans to reduce and control emissions of air pollutants and notify the public in advance of harmful air pollution levels. 26
In response to the growing concern over PM2.5 pollution, the government of China implemented a range of policies, measures, and regulations aimed at preventing and controlling air pollution. 27 A comprehensive understanding of China’s current air pollution policies holds global significance. 28 Consistently promoting regular governance practices and targeted campaigns have been able to address environmental challenges effectively and contribute to the long-term sustainability of the environment. 29 Air pollution control in recent years has witnessed a shift from focusing solely on achieving the best-possible means to adopting a comprehensive air quality management approach. 30 The most reliable and up-to-date source of information on pollution regulation is the World Bank’s 2000 policy research report entitled Greening Industry. 31 Awareness of air quality, particularly the sources of pollutants and their impact on human health, and information of the areas with the best and the worst air quality was achieved by an analysis of the manner of land development and its morphology. 32 In addition, the spread of pollution prevention faces organizational obstacles such as resistance to change, inadequate support from decision makers, unclear project leadership, insufficient employee responsibility, and inflexible organizational structures. 33
Bibliometric analyses can make valuable contributions to the field by systematically mapping the landscape of urban air quality management research. They are important tools for assessing and quantifying literature growth on a given topic. 34 Bibliometrics helps researchers to explore, organize, and analyze huge amounts of information and find hidden patterns which can be used in the decision-making process. 35 This method can examine the most influential authors, countries and interconnected collaborative networks and identify research priorities in specific areas within the framework of urban air quality management. A bibliometric analysis was performed for authors, institutions and countries, in relation to publication year, language, citations, theme, and analysis of publication keywords. 36 In addition, the development of co-occurrence networks using cluster analysis can provide more specific keyword classification in scientific research production. 37 The terms bibliometric, scientometrics, and informetrics refer to component fields related to the study of the dynamics of disciplines as reflected in the production of their literature. 38
In the past few years, research in Social Network Analysis (SNA) has increased. 39 Social network analysis (SNA) and the co-occurrence network of countries revealed that collaborative relationships among countries existed in the field of air pollution sources. 40 Bibliometric techniques and social network analysis are employed to evaluate air pollution and health. 37 Academic mobility and its importance in the dissemination of knowledge and globalization of research collaboration, has received growing attention over the past decade. 41 Moreover, the indicators of connections between researchers and research areas are measured through statistical analysis of co-publications and citations. 42
A number of public administration studies consider the field of environmental policy important for understanding collaborative governance, but the theoretical and empirical investigation of collaborative environmental governance is underdeveloped. 43 More specifically, biometric trend analysis identifies hotspots and new ideas on a given topic, and evaluates the performance and influence of different countries and journals. 40 The bibliometric techniques used in this study are publication counts, abstract field and title field analysis, co-citation analysis, and co-word analysis. A synthetic framework is offered to bring disparate research together into a process-oriented dynamic of policy capacity development. 44
The aim of this study is to examine the relationships between urban air quality management and biometric analysis in cities worldwide. Relevant literature on urban air quality management is identified from Scopus databases. This study aims to provide an overview of urban air quality management research published between 1975 and 2022, with a focus in the following areas:
(1) It provides a qualitative (topic of study area or co-occurrence of terms) and quantitative (number of publications covered, number of citations, and data sources) assessment of current research progress and trends in urban air pollution management research.
(2) The study applies the principle of biometric analysis to divide records from 318 cities and determine the collaborative association between them.
(3) The study explains the direction of science on air quality management and links between countries, institutions and authors.
(4) Based on the clustering results, we developed co-occurrence networks to obtain more specific keyword classification results by keyword frequency, relationships and semantic analysis to identify future research hotspots. This approach led us to structure a systematic literature review methodology as shown in Figure 1. The study period 1975 to 2022 was selected because research of air pollution sharply increased in the 1970s and this 48-year period permits the identification of trends.

Framework for literature research, analysis, and interpretation.
Research Design and Methodology
The Scopus collection provides a variety of records for each publication, including author information, journal, citations, and institutional affiliation. Both quantitative and qualitative research approaches were use through a systematic review. After reviewing several online databases, the Scopus database was used as a database to search and retrieve air quality management references. We used VOSviewer, software package that can be used to create and display bibliometric relationships between a variety of variables. 45
Data Collection and Searching Strategies
Data collection was carried out in 5 steps:
Step 1: Selection of search criteria: The advanced search option was used to conduct a keyword search. This keyword search was conducted by 3 independent researchers. Accordingly, the subject areas of air quality, air pollution, air quality management, and cities were used for data collection and search strategies. Specific terms used for the search included air quality management frameworks, air pollution, and cities.
Step 2: Selection of a publication year and nature of documents: articles published from 1975 to 2022.
Step 3: Bibliometric analysis: analysis of 318 articles included in the Scopus data base source:-the analysis included the number of publications from 1975 to November 6, 2022 citation analysis and a search/subject area analysis of the published articles.
Step 4: Co-occurrence and author analysis: the occurrence of key terms identified by authors in the Scopus database and analysis of current research trend graphs showing the relationships among these key terms.
Step 5: Analysis and interpretation of data; analysis of total links strength and most relevant terms in titles, abstracts and all keywords.
In the final phase of the analysis, the authors created a scientific map using VOSviewer software (a tool for creating and visualizing bibliometric networks) by using advanced layout and clustering techniques to show the relationships between keywords from the Scopus - Characterize database. 46
Data were collected using the Scopus search engine based on the following search terms: (1) “Air Quality,” (2) “Air Pollution,” (3) “Urban Air Quality Management,” (4) DOCTYPE (article), PUBYEAR from 1975 to 2022, and (5) Languages “English.” The methods included developing review questions and establishing conceptual boundaries; demonstrate the search boundary by setting a review scope. The identification, screening and selection processes involved using the Preferred Reporting Items for Systematic Reviews and Meta-Analyses (PRISMA) flowchart and applying the synthesis and analysis. The search parameters used the updated PRISMA rules guideline 47 and the templates in Figure 1. Bibliometric analyses were performed for authors, institutions, countries, and collaborating networks in terms of publication year, subject, citation, network, funding agency and analysis of publication titles and keywords. 48 A joint research into the selected subject areas was then carried out to enable the development of comprehensive knowledge of the topic. This included references to authors (document title, year, volume, editions, and number of citations), bibliographic information (affiliation and correspondence address), abstracts and keywords. Besides, the reasons for excluding articles were justified. For instance, English is the language used most often in international scientific journals. 49 All non-journal articles documents were excluded. This is due to the fact that, in contrast to other documents like editorials and notes, journal articles usually go through a thorough peer review process. 50
Results
Data description
In this section, the bibliometric data on publication trend, publication distribution by country, institution, author and journal including author keyword analysis and the most cited articles are presented. Previous trends and current progress were identified with the aim of bringing the topic of urban air quality management (UAQM) closer to initial contacts and also highlighting possible future topics. 51
The authors analyzed the number of publications after 1975. From 2005 to 2020, the number of publications and citations within the Scopus database increased by 85.98% and 90.89%, respectively (Figure 2).

Number of articles published and cited between 1975 to 2022.
Most articles on air quality were published in the journals Science of The Total Environment (22.22%), Atmospheric Environment (14.81%), International Journal of Environmental Research and Public Health (10.19%) and Journal of the Air and Waste Management Association (10.19%) (Table 1).
The most frequently cited journals with research articles on air quality management framework in cities in Scopus, 1975 to November 6, 2022.

Most articles were published by Beijing Normal University (13.48%) in China, followed by the University of West England (11.24%), the Chinese Ministry of Education (11.24%), the Chinese Research Academy of Environmental Sciences (10.11%), Peking University (10.11%), and Tsinghua University (10.11%). The top 10 institutes, 7 of them in China, published only 89 articles, indicating that there are many more articles in Chinese journals on urban air quality management which are not included in the Scopus database (Table 2).
The 10 institutions with the most publications on air quality management in cities.

The top countries are shortlisted based on the number of published documents, citations, and overall connectivity strength in urban air quality management. As can be seen from Table 3, the 3 countries with the most publications are China, the United States and the United Kingdom with 97, 75, and 37 articles published, respectively, with 1979 citations of publications in the United States, 1791 in Chinese, and 1319 citations in the United Kingdom (Table 3).
Number of published articles on urban air pollution management by country, citations and total link strengths.

Country collaborative analysis
The program software VOSviewer was used to map and visualize the bibliometric cooperation network between countries that published scientific papers on air quality management during the study period. Out of 64 countries, only 32 met this threshold with at least 3 documents. The results of the bibliometric cooperation in the country network are shown in Figure 3. In this analysis, countries were assigned to 5 clusters, with each country assigned once. The 5 clusters are shown in different colors. The level of cooperation of the countries is shown by the lines connecting the countries. Only 131 links are shown in Figure 3, they represent the 210 strongest connections between countries, as most are either embedded in the strong connections or too weak to detect. The size of the clusters corresponds with the cooperation between countries. For example, in the purple cluster, China showed the strongest collaboration with 64 connections, followed by China and Australia with 14 and 8 connections, respectively. The leading cooperation countries in the red cluster were the Netherlands (24 links), Italy (20), Portugal (15), and Norway (13). The United States and Canada were the most closely connected countries in the yellow cluster. The United Kingdom, Japan, and Malaysia were the leading collaborating countries in the green cluster with 31, 15, and 12 connections respectively.

Co-countries network of the most productive authors based on the total number of highly cited articles.
The research areas that contained more than 50 analytical concept articles were environmental sciences (222, 39.86%), engineering (62, 11.13%), social sciences (60, 10.77%), and earth and planetary sciences (55, 9.87%). Business, management, and accounting (17, 3.05%) and decision sciences (10, 1.80%) ranked last (Table 4).
Subject areas of publications on air quality management framework in cities.

Keyword analysis
The co-occurrence network of keywords used by the authors demonstrates the importance and focus of scientists and researchers in the field of air quality control research. Figure 4 illustrates the top author keywords and their co-occurrence in the network. Based on a map on bibliographic data of co-occurrence with all keywords using the full counting method; out of 3883 all keywords, only 295 meet this threshold with at least 5 keywords. The link strength shows the frequency of occurrence of a keyword. The top 7 keywords terms related to the study topic were air quality (204, 2662), air pollution (134, 2222), particulate matter (65, 1286), atmospheric pollution (82, 1260), human (57, 1165), air pollutant (46, 994), air pollutants (44, 948) of co-occurrences and total link strength, respectively. Air quality had the highest link strength among all keywords and was strongly associated with the air quality management framework. Air pollution, climate change, conceptual framework, environmental management and protection, people and sustainable development were the leaders in the cluster shown in red color. This is followed by air pollution control, air quality, air pollution, decision making, quality control, quality management, and urban areas under green color or clusters of 2 categories. The relatively low scores for the fields concerned with air quality control points out the need for further studies on air quality and pollution prevention and remediation. In the future, trends and hotspots of air pollution, an assessment framework that connects with future insights and visionary components and long-term planning may help to mitigate air pollution or extreme pollution events.

Co-occurrence network analysis of title and abstract fields.
Figure 5 illustrates the minimum number of keywords in each document. Out of 11 445 keywords, only 284 met this threshold limit with a minimum of 10 keywords in the title and abstract. Of these 284 terms:- about 60% selected terms were the most relevant to these studies. The top 10 ranking keywords in terms of occurrence and relevance were score (50, 4.42), indicator 141, 3.27), group (36, 2.68), evaluation (55, 2.20), quality (183, 2.05), uncertainty (56, 1.99), NO2 (25, 1.66), particulate matter (42, 1.66), air pollutant (47, 1.61), and air quality management (75, 1.51), respectively. Co-occurrence of keywords clusters from the title and abstract fields were assessed. The circle size shows the number of articles while line thickness and color of the lines depict link strength and clustering, respectively.
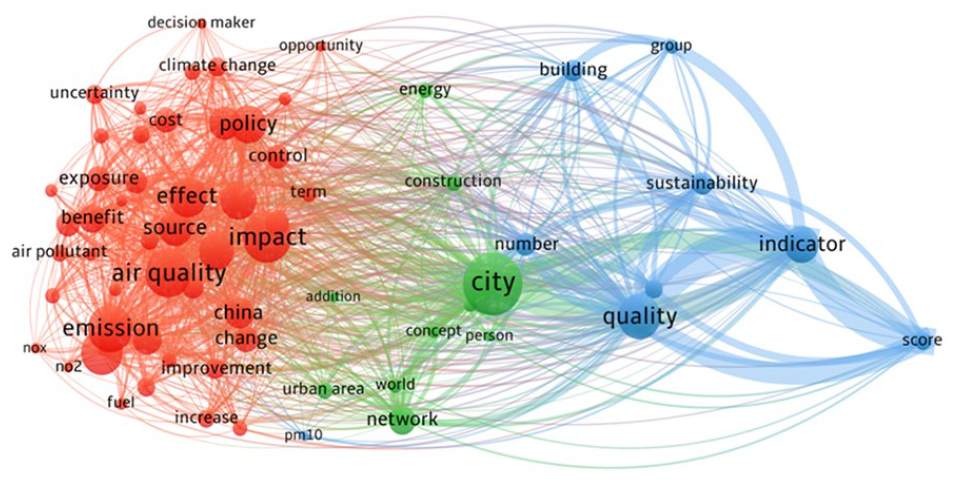
Co-occurrence of keyword clusters from the title and abstract fields.
We extracted the publication data with the authors names (Table 5). Wang, J. was the most productive, contributing 6 documents, with a 7 total link strength score. Li, Z. and Wang, Q. were in second place, each with 4 publications and a 4 total link strengths score, followed by Wang, Y who contributed 9 documents with 4 total link strength. Of the 1343 authors with a minimum of 4 authors per document 14 met the threshold.
Collaboration of authors and total link strength through publications.

Discussion
The research areas that contained more than half of the analytical concept articles were in the environmental sciences and engineering field of studies. This finding is consistent with global research on air pollution published between 2005 and 2014, 52 Environmental science was the main topic category also of the Web of Science. Several research classifications are currently in use and these require continued work as new classification techniques become available and new research topics emerge. 53 The coexistence analysis of the categories and journals revealed the multidisciplinary nature of air quality management and the most relevant categories. A bibliometric analysis was carried out, creating indices that clearly represent the scientific work on a central topic. 54 Figures 3 to 5, the distances among terms, the association between items and long distance indicate that there are weak associations and vice versa. 55
Based on the findings in Figure 2, the number of publications and citations on air quality management in cities in the Scopus database were increased sharply after 2005. This finding was similar to the study by Dhital and Rupakheti. 1 The United States, China, and United Kingdom ranked first, second and third in the number of citations, respectively, and China, United States and United Kingdom were the top 3 publishing countries. These findings corroborate the results of a study conducted in Poland, 34 China received more attention in household air pollution exposure and children’s lung function in recent years. According to Dhital and Rupakheti, 1 the most productive countries working in the field of air pollution and human health were the USA, China, Italy, England, and Canada, whereas top institutions were Chinese Academy of Sciences, US EPA, Harvard University, Peking University, and University of Sao Paulo. Countries and regions should strengthen cooperation and jointly solve the damage caused by PM2.5 by integrating multiple disciplines and areas. 56 Citations are assumed to reflect the impact of the research or its quality. 57 As previously reported, citation bursts are a strong indicator of scholarly impact in terms of attention from the research community. 51
A good indicator of air pollution was control efficacy in relation to important population health indicators. 58 Pollution control is linked to competing priorities for the provision of essential services and economic development in local government. 30 The disagreement between monthly PM2.5 concentration patterns in the highly polluted regions of mainland China and Taiwan suggests that the transport mechanism at monthly and longer time scales needs to be further studied. 59 Mak and Lam 60 summarized future smart city development in regard to air quality reporting with the aim of facilitating the development of practical guidelines for individual cities seeking to improve the accessibility of air quality data. The concept of smart cities has emerged as the future direction of sustainable city development, where many cities across the globe attempt to lead the paradigm shift of smart city movement in the 21st century. 61 In addition, mitigation of air pollution is indispensable, and effective community interventions require comprehensive and long-term air quality management plans. 62
Conclusion
This bibliometric and social network analysis showed distinct temporal, spatial and thematic patterns and trends of the relationships between key terms, research areas, and publications of air pollution and pollution management research. The results of this study provide a basis for future studies to determine the attribution of researchers to countries, institutions, collaboration publications and disciplines. The literature showed that the most frequently occurring keyword terms were air quality, air pollution and particulate matter.
This bibliometric study has several limitations. First, it does not incorporate experimental data to support its findings, limiting the study’s ability to provide in-depth insights into the dynamic and practical aspects of urban air quality management. Second, the bibliometric data from the Scopus database are not created exclusively for the analysis of air quality management in cities, reducing their specificity. Third, numerous publications in other languages or non-English languages journals are excluded.
We recommend that future studies use a mixed-methods approach, integrating both quantitative and qualitative research methods with empirical data or case studies to provide practical insights into urban air quality management. Detailed experimental measurements should be included to complement the bibliometric analysis. Likewise, we recommend including additional databases or research sources beyond Scopus to capture a wider range of publications and reduce geographical and journal-related biases. This will require that researchers incorporate relevant documents published in languages other than English to broaden the scope of the study.
Footnotes
Acknowledgements
The authors would like to thank all research assistants and participants for their contributions and participation in this study.
Funding:
The author(s) received no financial support for the research, authorship, and/or publication of this article.
Declaration Of Conflicting Interests:
The author(s) declared no potential conflicts of interest with respect to the research, authorship, and/or publication of this article.