
Abstract
In the last two decades, a large number of whole-genome phylogenies have been inferred to reconstruct the Tree of Life (ToL). Underlying data models range from gene or functionality content in species to phylogenetic gene family trees and multiple sequence alignments of concatenated protein sequences. Diversity in data models together with the use of different tree reconstruction techniques, disruptive biological effects and the steadily increasing number of genomes have led to a huge diversity in published phylogenies. Comparison of those and, moreover, identification of the impact of inference properties (underlying data model, inference technique) on particular reconstructions is almost impossible. In this work, we introduce tree topology profiling as a method to compare already published whole-genome phylogenies. This method requires visual determination of the particular topology in a drawn whole-genome phylogeny for a set of particular bacterial clans. For each clan, neighborhoods to other bacteria are collected into a catalogue of generalized alternative topologies. Particular topology alternatives found for an ordered list of bacterial clans reveal a topology profile that represents the analyzed phylogeny. To simulate the inhomogeneity of published gene content phylogenies we generate a set of seven phylogenies using different inference techniques and the SYSTERS-PhyloMatrix data model. After tree topology profiling on in total 54 selected published and newly inferred phylogenies, we separate artefactual from biologically meaningful phylogenies and associate particular inference results (phylogenies) with inference background (inference techniques as well as data models). Topological relationships of particular bacterial species groups are presented. With this work we introduce tree topology profiling into the scientific field of comparative phylogenomics.
Keywords
Background
The first representation of evolution of life on Earth in the form of a tree is the drawing headed ‘I think’ by Charles Darwin, 1 and the concept of a Tree of Life (ToL) has been continuously challenged and developed. The most valuable input, however, has come from the field of molecular biology. Due to the steadily increasing number of completely sequenced genomes 2 over the last two decades as well as inventions and refinements of algorithmic methodologies to computationally infer whole-genome phylogenies, a large number of strategies for utilizing molecular data have been developed. Consequently, a large number of ToL inferences have been published. The most robust kind of characterization is the gene content tree (GCT)–-also known as the genomic tree, whole-genome tree, or genome tree–-, which is based on the representation of gene family members in completely sequenced species and therefore is based on sequence homology. Published GCTs contain from tens to hundreds of analyzed species. Several approaches are attempted to optimize or to vary the underlying data, to compensate disturbances from evolutionary events. Other attempts have been dominated by optimization of the algorithmic methods and data processing pipelines. As a consequence, the complexity of whole-genome phylogeny inferences is overwhelming. Or, as House stated: ‘There is not a single gene content method. Rather, this is a broad category of genomic analysis that includes a wide variety of implemented methods, each with its own individual assumptions, strengths, and weaknesses’. 3
In order to study the inference results for the ToL–-in the last two decades represented by a large number of extremely different whole-genome phylogenies–-and especially for the study of GCTs, it is essential to understand the background of the phylogeny inferences. Therefore we perform in the following chapter an in-depth analysis of the related literature recording data model, inference method and the purpose of attempted data conditioning. Reviewed literature on inferred whole-genome phylogenies is also part of Table 1.
Characterization of published studies analyzed in this paper.

Many of published whole-genome phylogenies are based on gene content data. However, published phylogenies are difficult to trace and, moreover, are often not reproducible because underlying data such as raw data or gene content meta-data are publicly not available. Gene content meta-data are representing gene families across a fixed set of species in a binary event matrix. The presence–-absence representation of a particular gene family across a set of (completely sequenced) species in defined order, known as a phylogenetic profile, 4 ‘phyletic pattern’ 5 or ‘conservation profile’, 6 can be used for the comparison of gene families. A phylogenetic profile is the first dimension of this presence–-absence event matrix. The second dimension is orthogonal to a phylogenetic profile. It is a list in defined order across all gene families found in at least one of the species in the species set. It characterizes each single species, thereby. This particular view on the matrix basically allows for direct comparisons of the species. There exist some repositories such as the SYSTERS database 7 containing the PhyloMatrix as event matrix that offer the access to such meta-data.
The lack of methods to systematically or automatically evaluate respective whole-genome phylogenies is caused by heterogeneity in inference background and numbers of included species as well as by unavailability of raw or meta-data. With this paper we present a strategy to compare such phylogenies. It concentrates on tree topologies of drawn phylogenies. The manual analysis, by visual inspection of topologies of selected species groups (taxa), focuses on the determination of the two neighbors of a taxon in a bifurcating tree (most of published phylogenies are bifurcating). For each taxon, a row of topology alternatives (sets with different neighbors) can be found in the literature of the last two decades. All findings are, after generalization, compiled into a catalogue of alternative topologies and translated into digital states. These states enable a semi-quantitative validation by clustering. The advantage is that the topology characteristics are independent from the kind of phylogeny and species numbers in the trees. We define this method as ‘tree topology profiling’. To simulate the inhomogeneity in published phylogenies we, moreover, utilize the SYSTERS-PhyloMatrix
7
gene content data as standardized data model to apply seven frequently used phylogeny inference methods as testing variation. Such phylogenies can be mixed with published phylogenies and analyzed analogously using tree topology profiling. An overview of our overall strategy is presented in Figure 1. Applying tree topology profiling on 47 published and seven new inferences, the overall aim of this study is to provide general insights into the inference results of whole-genome phylogenies and the respective inference background.
Workflow applied in this study.
Whole-Genome Phylogenies Inferences in the Literature
A large fraction of published whole-genome phylogenies are gene content phylogenies. Generally, gene content phylogeny inference is based on four operational steps: (i) the generation of the basic
A gene content data model and, subsequently, the quality of the resulting whole-genome phylogeny is determined by the accurate discovery of the relationship of evolutionarily dependent genes in different species. Relationships are presented as protein families or homologous or orthologous groups, depending on the basic aim of the procedure. First, exhaustive sequence similarity searches are limited by the comparability of protein sequences. The correct association of evolutionarily related genes to a shared gene family is then judged by separation criteria for similar genes from all other genes; such criteria characterize the family inference method; any kind of gene family inference requires these two essential steps.
A large fraction of GCTs analyzed in this study, Table 1, was inferred from the Clusters of Orthologous Groups (COGs),8,9 a set of protein families found from completely sequenced prokaryotes (and a few eukaryotes). COGs are generated by a number of automatic and supervised processing steps. Other approaches consist of fully un-supervised data pipelines such as TRIBES 10 or SYSTERS. 11 Several GCT-constructing studies used own approaches to control the inference of orthologous groups (or other sets) or to provide the option for improvement (see later); other studies have incorporated annotation, eg, enzyme functionality of gene families. 12 Gene content phylogenies can be based on different levels of homology. The evolutionary objectives range from more focused (the orthologues) to a broader view (the homologues including the paralogues). Several inference attempts have provided alternatives for the homology background,13–15 in particular, gene family inferences based on e-value variation. 16 COG-like inferences or inferences retrieved from reciprocal best matches on ORFs.6,17–19 COGs are exploited in a large set of publications for the inference of gene content phylogenies.14,20–28 Content data have also been published on the basis of functionality and enzyme content.12,29–31 Moreover, protein domain content 32 and fold occurrence,20,33 as well as gene order in COGs 14 have been exploited.
Alternatives to content data concepts are available: Super-alignments have been performed using COGs housekeeping genes34,35 or marker gene families.27,36 Resulting data were compiled within a database for orthologous groups including the COGs, known as the ‘evolutionary genealogy of genes: nonsupervised orthologous groups’ (eggNOG) 27 that has recently been extended. 37 Such integration across (concatenated sequences of multiple housekeeping) genes is an efficient substitute for any single gene phylogeny because ‘no single gene (family) can serve as a proxy for the tree of life’. 38 Another data concept is the super-tree 39 built from phylogenetic trees of single gene families. A single gene family that has already been used to infer the ToL is the ubiquitous 16S rRNA family that is often denoted as ‘the gold standard for an inference based on a phylogenetic tree’. 38 An example of such a phylogeny is given by Gevers et al (2004) 29 in combination with a paralogy analysis. A 16S rRNA phylogeny was also used for the reciprocal illumination of GCT inferences using the ‘corroboration metric’. 16 Here, the authors inferred more than hundred GCTs based on the content of homologous genes based on COGs in order to find the optimal tree.
Drastic changes in genomes occur as particular evolutionary events. This can be attributed to gain and loss of sets of genes. As an example of gene loss, parasitic organisms partially utilize the genome of their host species and synchronously reduce their own genome.
40
The term ‘reductive evolution’ characterizes this historical process. Species that have experienced this phenomenon can be found within several phyla or classes of the Bacteria, namely the Chlamydiae, the alpha-Proteobacteria,
41
the gamma-Proteobacteria,
42
the Actinobacteria, the Mollicutes and the Spirochaetes. As a consequence, the topologies of symbiotic
43
and obligate parasitic species are often incorrectly arranged in whole-genome phylogenies,
26
based on insights from taxonomy or detailed knowledge from molecular biology. Findings from molecular biology support the correct placement of the Mollicutes,
Such information helps to identify a species group for that an ambiguous topology can be identified as correct or incorrect (such topology is ‘confirmable’). Otherwise, such a decision is impossible (‘non-confirmable’ topology; no support by other experimental findings). Taxa to be analyzed are often branching deep in the inner tree; such topologies are seldom confirmable. Confirmability of a particular topology is an essential argumentation feature in this paper; it also can be a feature of a character state in the topology analysis.
Another major evolutionary event is horizontal gene transfer (HGT), a process that enables organisms to acquire genetic material from one another. HGT has been demonstrated for a set of genes in particular species groups, for example in the Cyanobacteria
51
and the Chlamydiae,
52
or for single genes such as the
To compensate such disruptive biological effects on phylogeny inferences, several attempts were initiated to model related evolutionary events, the gain and loss of genes. This is achieved with conditioning of data, 55 the successive reduction of discordant homologues, 18 the reduction of noise to achieve consistent signals, 23 the weighting of trees based on prevalence and concordance, 19 or balancing single disturbing events at genome-scale dimensions. 56 Stochastic mapping 57 involves varying the rates for particular gene families. Conditioned reconstruction was found to work well even in the presence of HGT; 58 however, the interpretation of phylogenies varies according to the method used to construct them. Modeling of loss and gain has been performed using ‘blocks’ of genes rather than single genes.24,25 As mentioned in Cohen and Pupko, 57 there are no tests for HGT inference based on probabilistic-evolutionary models. But HGT was modeled by among-gene-family-rate variations59,60 or as a phylogenetic mixture model 26 in about 50 species. Here, 11 out of the 12 parasites within 50 analyzed bacterial species clustered in a single, monophyletic clade. Therefore, gene loss has recently been modeled by the same researcher group 28 using algorithms such as phylogenetic mixture models in conditioned logdet phylogenies. This study questioned whether a bias in the three underlying biological data models or the tree inference methods caused the strong convergent signal for parasites in a whole-genome phylogeny, the ‘artefactual parasitic eubacteria clan’. 28 The authors concentrated on the method, they found that ‘the most successful methods for estimating a reliable phylogenetic tree for parasitic and endosymbiotic eubacteria from gene content data are still ad-hoc approaches such as the SHOT 14 distance method’.
Gene content data can be exploited by parsimony or heuristic, distance-based algorithms. An early approach that exploits the presence–-absence status of genes is the Dollo algorithm.61,62 This parsimony method was used in several investigations, often for comparison with other inference techniques.21,33 It allows a single invention of a particular gene family (at one point in time; as contribute to one particular edge of the rooted Dollo tree) and minimizes the number of gene losses across all species. The Dollo parsimony was also connected with the convergent signal for parasites in a whole-genome phylogeny to be placed a single, monophyletic clade21,63 but it is mentioned that there is a ‘potential of simpler methods to cope better with the issue of genome size echoes’. 63 Other maximum parsimony methods, such as the Wagner parsimony of the ‘mix’ program in the Phylip suite 64 or similar implementations, were applied to sets based on sequence data 35 or homologous family inference settings. 15 A large number of whole-genome trees, however, are generated using distance-based algorithms such as Neighbor Joining (NJ), 65 the Fitch-Margoliash algorithm (FM), 66 the Unweighted Pair Group Method with Arithmetic Mean (UPGMA), 67 or the KITCH algorithm. 64 The ‘Shared Ortholog and Gene Order Tree Reconstruction Tool’ (SHOT) 14 enables not only the comparison of different homology approaches but also the option for both the NJ and the FM algorithm in combination with different distance metrics. Moreover, NJ is a frequently used algorithm12,13,17,21,23,24,32,56 with convenient features in terms of computing performance. It allows variability in the distance metrics and larger numbers of species. A derivate of the NJ algorithm, established in BIONJ, 68 was used to study the difference between a distance-based tree and two super-trees, 39 that were inferred either with a Maximum Likelihood (ML) method or are based on a set of phylogenetic gene family trees. NJ was also compared with UPGMA and totally different concepts such as split graphs. 69 The FM algorithm, a method that uses a weighted least squares method for clustering and often synonymously referred to as ‘weighted least squares’, was used to compare variations in weighted gene content, 19 the elimination of discordant genes 18 and a COG-like approach for protein domain families that studies substitution rates between proteins. 70 FM was also used to compare the resulting tree with earlier results inferred by Dollo parsimony phylogenies.21,22 Here, the KITCH algorithm together with the Hamming distance (genomic data are from COGs families) was studied with regard to differences between parsimony trees based on structural or rRNA features, but only using an extremely small number of species early on in the study of whole-genome phylogenies. 20
Distance-based algorithms have been used with a broad arsenal of standard metrics such as the Hamming, the Jaccard, or the Simpson metrics; for a review of the mathematical background see Cheetham and Hazel. 71 Another metric, based on the geometric and arithmetic mean, was introduced by Korbel et al 14 with better inference results; 23 this metric has been extensively compared with the Simpson and Jaccard metrics. 12 Other authors introduced their own metrics such as the median of percent identity 21 or ‘gamma corrected distance’ 24 to infer adaptations by refining parameterization or a ‘general genome distance’. 39
Methods
Set of nine species groups (Taxa) with alternative topologies
For our meta-analysis we evaluated published topologies and topologies from own whole-genome phylogeny inferences according to particular bacterial subclades or their representatives. Our selection of relevant species groups (taxa) followed existing studies on gene loss, as reported elsewhere.26,28 We undertook these 12 species that are organized in six species groups of diverse taxonomic ranks (ie, genus, family, class or phylum):
Catalogue of alternative topologies for nine taxa–-classification rules
Generalized topology alternatives found in published phylogenies of selected nine species groups.
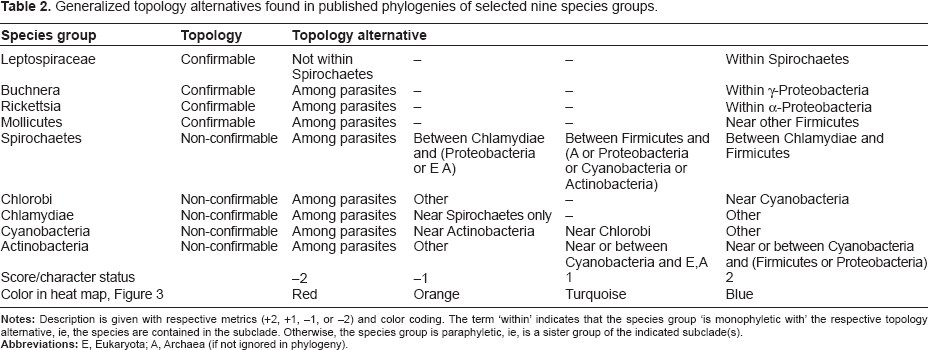
For confirmable topologies, there are only two alternatives observed, the true, For Buchnera, Rickettsia, Mollicutes, Leptospiraceae, the status is +2 if respective taxa are within gamma-Proteobacteria, alpha-Proteobacteria, Firmicutes, Spirochaetes.
We defined the character sets with more than two alternatives for the following five species groups with non-confirmable topologies in the order of decision:
Actinobacteria: if near Eukaryota/Archaea and Cyanobacteria, status is +1; if near Eukaryota/Archaea and other, status is +2; if within the parasitic subclade, status is –2; otherwise, status is –1. Cyanobacteria: if near Actinobacteria, status is –1; if near Chlorobi, status is +1; if within the parasitic subclade, status is –2; otherwise, is +2. Chlamydiae: if within the parasitic subclade, status is –2; if near Spirochaetes only, status is –1; otherwise, status is +2. Chlorobi: if near Cyanobacteria, status is +2; if within the parasitic subclade, status is –2; otherwise, status is –1. Spirochaetes: if within the parasitic subclade, status is –2; if between the Chlamydiae and Proteobacteria or Eukaryota/Archaea, status is –1; if between the Chlamydiae and Firmicutes, status is +2; otherwise, status is +1.
Analysis of published phylogenies using the catalogue of alternative topologies–-event matrix
Topology profiles for seven SYSTERS-PhyloMatrix gene content trees across the nine species groups in the topology catalogue: event matrix; score definitions can be found in Table 2. and phylogenies in Figures S1 to S7.

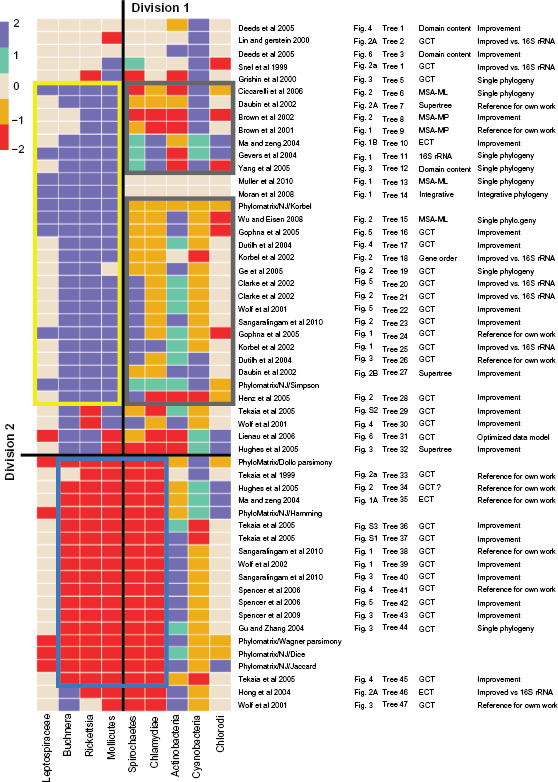
Topology profiles across nine species groups derived from 54 phylogenies (seven SYSTERS-PhyloMatrix gene content trees and 47 whole-genome phylogenies, Table 1).
Clustering of the event matrix
We used the R package 72 to generate a heatmap (pheatmap library) from the topology event matrix with default settings such as the hierarchical clustering for rows (with phylogeny annotation) and average linkage clustering with Euclidean distance.
Selection of particular taxa and phylogenies (division 1 and 2)
We introduced two general divisions of the heatmap according to the following decisions. The first division separated four taxa with a confirmable topology (Leptospiraceae (within Spirochaetes),
Re-clustering of part of the heatmap
Further analysis was based on the intersection of the two selection divisions. However, several phylogenies were excluded from further analysis because they lacked a considerable number of interesting species groups. This is because whole-genome research ignored parasitic species for particular inferences, very early phylogenies were too small, or the study focused on only a single bacterial clade. Phylogenies with unresolved topologies were also excluded (ie, no bifurcations in the inner tree). The resulting subset comprised (a) data (phylogenies) with the correct topology for all confirmable taxa and (b) taxa that have no confirmable topology. The relevant part (see subcluster of selected phylogenies and taxa in the gray rectangle in Fig. 2) of the heatmap was re-clustered with the same clustering parameters.
Use of SYSTERS-PhyloMatrix data model for phylogeny inference
We retrieved the PhyloMatrix data 7 from SYSTERS release 4 as a binary presence–absence matrix of 19374 protein families from 106 completely sequenced species. The SYSTERS protein family data 11 are based on the fully automated inference of families in two hierarchies by protein sequence similarity; SYSTERS does not explicitly infer families at a particular level of homology. A detailed list of the 106 species is provided in the supplemental data, Table S3. The PhyloMatrix data model (http://systers.molgen.mpg.de/cgi-bin/info.pl) is generated under the condition that at least three completely sequenced species are represented in a single family.
Gene content tree inference and algorithms
We used the Phylip package
64
to generate GCTs. The binary matrix (PhyloMatrix) was translated into Phylip-compatible distance matrices between all pairs of the 106 species using our own Perl scripts according to the five distance or similarity metrics (Hamming, Jaccard, Dice, Korbel and Simpson). With the exception of the Hamming distance, metric distances
Results
Literature analysis
The first part of our study comprised an in-depth analysis of published whole-genome phylogenies, see Table 1. We extracted the underlying biological data model and the tree inference methodology as the two main background features in phylogeny inferences. Based on these two features, we classified the tree type in a separate column. This classification was essential for the subsequent topology analysis. We also give the aim of each particular study as well as statistics such as the number of species included, the number of trees inferred, the number of trees used for analysis in this study, and whether a 16S rRNA reference phylogeny was presented. The order of the particular phylogenies is oriented on the clustering result later. The classification focused on three issues:
Underlying data models for the generation of whole-genome phylogenies Data conditioning, modeling of evolutionary events Methodologies used to infer whole-genome phylogenies
Table 1 includes a large number of existing modeling approaches. We decided that modeling does not require further extensions by an own work. Moreover, a comparative and comprehensive analysis of existing topologies remained to be carried out: we developed tree topology profiling for this purpose. We designed the workflow that is sketched in Figure 1.
Topologies found in published phylogenies
Topology analysis
The catalogue of generalized alternative topologies, as shown in Table 2, was derived from published whole-genome phylogenies with organisms from all super-kingdoms of life, the Bacteria, Archaea and Eukaryota. By inspecting 47 whole-genome phylogenies from 30 literature references, we determined the existing topologies for the nine selected groups of species. Applying the catalogue of characteristic topology alternatives led to an event matrix for all referenced phylogenies. The resulting event matrix can be traced in the supplemental data, Table S2. The order of the phylogenies in Table S2 (as well as in the descriptive Table 1) is derived from the clustering shown in Figure 2, which is already extended by the seven new and later described phylogeny inferences.
Topology of parasitic species and shared subclades
It has often been reported that the parasitic species occur together in a monophyletic subclade. Within the 47 analyzed whole-genome phylogenies we found a considerable number of that quality. Using several data models and inference methods. The parasitic subclade includes three species groups with confirmable topologies (
Parasitic monophyly has been reported for Dollo parsimony [tree 47] 21 but also for ML trees of single gene families, eg, a 16S rRNA phylogeny [this tree was not analyzed in this work]. 26 The parasitic monophyly also results from inferences using correspondence analysis (CA) [tree 29; tree 36; tree 37; tree 45], 6 inferred with distance methods that use the Hamming or Jaccard or other distances [tree 2; tree 35; tree 38; tree 39].12,20,22,28
Only seven phylogenies include a partial parasitic subclade that is constructed from only some of the five parasitic species groups [tree 5; tree 29; tree 30; tree 31; tree 32; tree 46; tree 47].
Confirmable topologies of particular groups of parasitic species
As the alternative to the shared subclade of parasites, well-confirmed topologies are known for the three species groups
The types of whole-genome phylogenies with correct topologies for the confirmable parasites were either super-trees [tree 7; tree 27], MSA-ML trees [tree 6; tree 13; tree 15] or MSA-MP trees [tree 8; tree 9]. A more recent MSA-ML tree [tree 13] and the literature consensus tree for symbionts [tree 14] were only resolved for these four taxa and were included in the analysis. The majority of the correct trees, however, are (eleven) GCTs inferred using distance methods [tree 4; tree 16; tree 17; tree 19; tree 20; tree 21; tree 22; tree 24; tree 25; tree 26; tree 28]. Interestingly, three gene content phylogenies [tree 17; tree 25; tree 26], one enzyme content phylogeny [tree 10] and one
Species groups with non-confirmable inner tree topologies
Five out of the nine species groups in our profile are regarded as having non-confirmable topologies, since these subclades branch deep within the tree. These groups are the parasites Chlamydiae and Spirochaetes, the Actinobacteria, the Cyanobacteria and Chlorobi. Therefore, topologies for each of the five species groups are, as observed, more heterogeneous (in comparison to the findings for the confirmable species groups Leptospiraceae, Buchnera, Rickettsia and Mollicutes) which led to extensions of the topology catalogue in Table 2. Interestingly, the parasitic Actinobacteria behave in a different way, and do not share a subclade with other parasites. Instead, within the section of phylogenies with parasitic monophyly, in the lower part of Figure 2, three out of the four possible topology states for the
Topology relationships
The two parasite groups Chlamydiae and Spirochaetes do not belong to species groups with a confirmable topology. If the parasitic subclade is formed, both taxa are included in this subclade in most cases. If not, a conserved topology can be observed for these two species groups. They are placed together as sister clades. The respective topologies are supported by seven trees [tree 15; tree 16; tree 17; tree 18; tree 19; tree 27; tree 7]. According to our catalogue of topology alternatives, the Spirochaetes lie between the Chlamydiae and the Proteobacteria (alternatively Eukaryota and Archaea), and the Chlamydiae are, reciprocally, placed near the Spirochaetes.
The general relationship between two other species groups, the Actinobacteria and Cyanobacteria, is found in more than 50% of all phylogenies of the analyzed literature. The proximity of the Actinobacteria to the Cyanobacteria is observed in 26 phylogenies (status +1 or +2); this correlates with the reciprocal finding for the Cyanobacteria near the Actinobacteria (21 occurrences; status –1).
Conserved placements can also be found for both reciprocal relationships. Some phylogenies show conserved proximity for the Cyanobacteria to the Actinobacteria, together with conserved proximity for the Chlamydiae to the Spirochaetes. This intersect situation is apparent in nine phylogenies [tree 15; tree 16; tree 17; tree 19; tree 20; tree 21; tree 22; tree 23; tree 24]. For this particular combination, reciprocal relationships are found in four phylogenies as proximity of Spirochaetes to the Chlamydiae (overlap with the general observation above) and as proximity of the Actinobacteria to the Cyanobacteria, [tree 15; tree 16; tree 17; tree 19].
Ignored phylogenies
The following publications were excluded from further analysis. A single phylogenomic inference approach did generally not consider parasitic bacteria 33 [tree 1; tree 3]. Two early phylogenies [tree 2; tree 4] were too small, containing only 11 or 13 species.17,20 Two recent publications considered inner tree uncertainty with non-resolved topologies for Spirochaetes, Chlamydiae, Actinobacteria, Cyanobacteria and Chlorobi,27,37 [tree 13]. A single integrative study presented undecided topologies for bacterial symbionts from different sources [tree 14]; 43 another paper considered only proteobacteria with 329 species. 74
Some of the more recent phylogenies analyzed in this study, however, focused on a modeling of gene loss in a single super-kingdom of life, the bacteria [tree 14; tree 15; tree 23; tree 38; tree 40; tree 41; tree 42; tree 43].25,26,28,36 Respective sparse phylogenies were not ignored because of their importance for our analysis.
Systers-PhyloMatrix GCT inferences–-topology profiles and event matrix
We derived a set of seven GCTs using the data model SYSTERS-PhyloMatrix. 7 The respective trees are available in the supplementary files as Figures S1 to S7. For the topology analysis, we used the catalogue of topologies, Table 2. The resulting topologies for the seven SYSTERS-PhyloMatrix GCTs across the nine taxa are presented in Table 3 as an event matrix; each of the seven rows is the respective topology profile to the tree. Hence, the seven tree topology profiles were constructed in the same way as that of published phylogenies.
The seven topology profiles fall into two groups. The first group of similar profiles was generated using NJ with the two distance metrics Simpson and Korbel. In contrast to the other five algorithmic approaches, the four confirmable species groups Mollicutes,
The NJ algorithm with the Korbel distance (supplementary files, Fig. S1) supports the topology of the Chlamydiae, the proximity to the Spirochaetes, the reciprocal proximity of the Spirochaetes to the Chlamydiae, and the proximity of the Cyanobacteria to the Eukaryota and the Actinobacteria. This is very frequent in the majority of all published phylogenies. However, the Actinobacteria are observed in a seldom found topology state (‘other’).
The NJ algorithm with the Simpson metric (Fig. S2) supports the proximity of the Actinobacteria to the Cyanobacteria and the Eukaryota (and the Chlamydiae). Reciprocally, the Cyanobacteria are close to the Eukaryota (state +2). However, three cases of incongruence occur: Spirochaetes and Chlamydiae possess a topology that is seldom reproduced elsewhere in published phylogenies.
The next five SYSTERS-PhyloMatrix inferences possess a more or less shared topology for the five parasites (
Combination of SYSTERS-PhyloMatrix GCTs and published phylogenies
Tree topology profiling
Figure 2 integrates the 54 phylogenies from the two sources: seven phylogenies were newly generated from the SYSTERS-PhyloMatrix data model and 47 were retrieved from the published literature, as described in Table 1. Clustering of the tree topology profiles orders the phylogenies in vertical direction and results in the presented heatmap picture. Reference data, numeric topology profiles and event matrices, were given in Table 2 and Table S2.
Subclusters of particular taxa and phylogenies after divisions
Three major subclusters were found in the heatmap after applying the two principal divisions. Vertical division 1 separates the species groups with confirmable topologies from those with non-confirmable. Division 2, applied several times, separates phylogenies that can be excluded (those with partially wrong or completely wrong topologies, eg, such with a shared parasitic monophyletic subclade).
Three subclusters reveal indicated by colored rectangles. The blue-bordered rectangle was correlated with the parasitic subclade in thirteen published and five of our own whole-genome inferences. However, division 1 did not divide the parasites since the Spirochaetes and Chlamydiae shared almost always the parasitic monophyletic subclade together with the other parasites with confirmable topology. In contrast, the Leptospiraceae were not observed in the parasitic subclade. Moreover, proximity to the Chlorobi (also to
The yellow-bordered rectangle in the heatmap comprises confirmable topologies that are correctly inferred for all four species groups together (if present in the tree). The corresponding phylogenies are of further interest in the section for non-confirmable topologies. This section is depicted as the gray-bordered rectangle; it is the complementary area to the yellow-bordered. Two phylogenies [tree 13; tree 14] were excluded since there was no information in that sector for non-confirmable topologies. The resulting set consisted of 21 published plus two SYSTERS-PhyloMatrix whole-genome phylogenies (NJ with Korbel and Simpson metrics). In contrast to the statement that corresponding topologies are not confirmable (and even if there were strong arguments for inner tree uncertainty) this subcluster is characterized by resolved topologies. To determine the inference background of these phylogenies, we performed a further analysis of the remaining 23 phylogenies.
Re-clustering
Re-clustering of the 21 published phylogenies and two SYSTERS-PhyloMatrix phylogenies across the five species groups (Spirochaetes, Chlamydiae, Cyanobacteria, Actinobacteria, Chlorobi; gray rectangles in Fig. 2) revealed a second heatmap, Figure 3. This consists, according to the dendrogram, of five subgroups that are indicated using numbers and colored circles.
Subcluster from Figure 2 of well supported topology alternatives.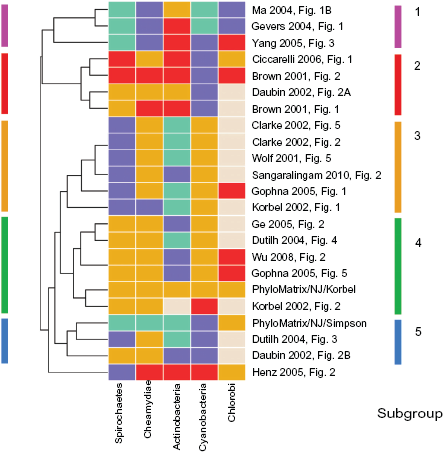
Subgroup 1 (blue bar in Fig. 3) consists of the SYSTERS-PhyloMatrix GCT inferred with NJ and the Simpson metric (Fig. S2). It is accompanied by another GCT [tree 26], 23 based on COGs and inferred with NJ and the Korbel distance metric, and a super-tree [tree 27]. 39
Subgroup 2 (green) consists of the SYSTERS-PhyloMatrix GCT inferred with NJ and the Korbel distance (Fig. S1) and three further GCTs [tree 16; tree 17; tree 19],19,23,56 a gene order tree [tree 18], 14 and a MSA-ML tree [tree 15]. 36 The underlying data models for the respective phylogenies were derived from the COGs, ORF-based reciprocal best hits, or sequences of housekeeping genes (MSA). The algorithms are all distance-based heuristics, two of them are using the Korbel distance metric as in the SYSTERS-PhyloMatrix GCT in this subcluster. This subcluster supports the reciprocal topology annotation of the two pairs of sister clades, the connections of the Spirochaetes to the Chlamydiae and the Actinobacteria to the Cyanobacteria.
The other three subgroups (3 to 5) comprise GCTs inferred using distance methods on the basis of the COGs or separate ORF inferences [tree 20; tree 21; tree 22; tree 23; tree 24; tree 25] (subgroup 3, orange). Here the topologies of the Actinobacteria and Cyanobacteria are reciprocally adjacent, unlike those of the Spirochaetes and Chlamydiae. Subgroup 4 (red) combines one super-tree and three MSA-ML/MP phylogenies [tree 6; tree 7; tree 8; tree 9]; subgroup 5 (pink) consists of inferences by distance-based heuristics from totally different data models [tree 10; tree 11; tree 12]. The topology relationships in the latter two subgroups are not frequently observed.
The following general trends were observed:
In Figure 2: the subcluster of 21 published +2 SYSTERS-PhyloMatrix phylogenies, shown within gray-bordered rectangles, includes many inference results that were regarded by the authors as improvements compared with initial set-ups. (An improvement can also be a phylogeny in comparison to a given 16S rRNA tree.) In Figure 3: all MSA-ML or MSA-MP phylogenies are included in the set of 23 reliable results. One of the subclusters consists exclusively of these phylogenies. Three other subclusters comprise phylogenies inferred with distance-based methods. Here, the most frequently applied metric is the Korbel metric. The Jaccard metric was frequently used for distance-based inferences that led to (not always completely) wrong topologies for the four confirmable parasite groups. Reciprocally adjacent topologies are apparent for Actinobacteria and Cyanobacteria (frequently in subgroup 2 and significant in subgroup 3, Fig. 3 and even in many phylogenies with a shared subclade for all parasites in Fig. 2) and for Spirochaetes and Chlamydiae (significant in subgroup 2, Fig. 3).
Discussion
A new methodology for comparing phylogenies with different inference backgrounds
The topology of a species group (taxon) in a phylogeny can be described by proximities to other taxa. Topology alternatives occur if different topologies for a single taxon are determined in multiple publications. For a given set of taxa we denote the set of particular topology alternatives as ‘topology profile’ and introduce ‘tree topology profiling’ as a comparative method based on such profiles. These profiles are the translation of verbal and topological descriptions into a scoring. Formally similar to phylogenetic profiling, tree topology profiling enables the computational processing and visualization of complex phylogenomic contexts. The use of topology alternatives does not require a ‘true topology’ assumption–-which could be determined by an acknowledged taxonomy or any scientifically supported knowledge such as that obtained via molecular biology. However, it is meaningful and useful for further interpretation if a particular state represents a scientifically accepted topology.
In general, the character set in a topology profile allows the independent and unbiased comparison of any whole-genome phylogeny from any source. This is more important than the potential disadvantage stemming from the empirical decision to use the ‘most plausible’ character status set. The transcription into digital states (scores), furthermore, enables semi-quantitative referral of the phylogeny inference results to the data background, the data model and the inference methodologies. It is clear to us that the chosen status index set across the entire topology profile is empirical. The clustering result depends, of course, on the number of characters in the topology profile (which is relatively small with a profile length of nine characters, depending on the data available in the literature) and on the appropriate choice of character states. For this reason, different index sets were compared with the inference results beforehand (data not shown). The presented approach, however, is accurate enough to highlight and elucidate the situation in published inner tree topologies of the ToL.
A topology catalogue for further general bacterial subclades can be created analogously to the presented set of taxa, followed by a similar analysis. More species groups exist in the inner tree, such as the Aquificae, Deinococci, Fusobacteria and Thermotogae. Extending the topology profile by appending these taxa to the character set would be conducive to understanding early evolution. However, like the Leptospiraceae and the Chlorobi, most of them are missing from the majority of the analyzed literature, especially in early publications. These species were therefore ignored here. Greater success would be expected if the fine-grained topology of a particular subclade at the periphery of the ToL, such as the Firmicutes or the Proteobacteria, were to be analyzed using tree topology profiling. Here, success will depend on the quantity of data (numbers of species and published trees) and variability in the existing literature. Our use of topology alternatives can be regarded as a semi-quantitative quality assessment of whole-genome phylogenies. This study thus has two main results, first, the general introduction of tree topology profiling and second, specific evidence of topologies in the inner ToL.
Progress in ToL inferences
Progress in recent whole-genome phylogeny inferences can be attributed to several aspects, for phylogenies based on gene content as well as on other data models. The first is the dramatic increase in the number of completely sequenced species represented in a ToL–-the most recent dataset in this review contained more than 1100 species. 37 This challenges inference methods and computational performance. Second, the methodology for appropriate inferences of whole-genome phylogenies is moving away from GCTs to MSA-ML trees. Some GCT inference approaches can keep up with more recent techniques. For MSA-ML phylogenies, the overwhelming increase in the amount of whole-genomes data is obviously compensated by reduction in numbers of considered gene families; the key here is the selection of representative, eg, housekeeping genes. The third aspect is that recent inner trees, in contrast to earlier trees, are displayed as non-bifurcating topologies. This is due to the trend for not all gene families to be included in tree inferences as well as the widely discussed tree-unlikeness (which reflects the early bacterial evolution obviously better, as already discussed in the literature). All newer inferences have enhanced the resolution of whole-genome phylogenies at the periphery of the ToL; however, the inner tree topology remains an open question.
The notion of the ‘Tree’ of Life has been widely questioned in the light of rampant HGT 75 and gene loss, despite the fact that a tree can be derived in the presence of HGT by conditioned reconstruction. 55 As already mentioned, HGT events have a natural impact on GCT phylogenies. Focusing GCT inference on the Eukaryotes led to considerations on how these species arose from their prokaryotic ancestors and further to the frequently discussed ‘ring of life’76,77 or the ‘network of life’. 78 Inconsistencies and methodological limitations have been reviewed and discussed. 79 An estimate was made of how much branch attraction, which depends on tree inference techniques, affects the accuracy of the inner tree.80,81 As a result, and after introducing appropriate models, 82 the root of the tree of life83,84 remains under debate, including the monophyly of particular clades of prokaryotes. 85
Automatically inferred whole-genome phylogenies exhibit sparsely supported inner trees. In more recently published phylogenies, such uncertainty in near-root topologies is indicated by short branch lengths, dashed inner-tree edges, low bootstrap supports or lack of resolution (avoiding bifurcations). This is consistent with further analyses of our own data. When applying the average bootstrap support method, 86 the most well-accepted, confirmable topologies showed the lowest support (data not shown). For published and our own phylogenies, we could not find a larger conserved and generally admitted topology arrangement for taxa with non-confirmable topologies. This observation was the cause of the discussion in the literature76,78,82,85 regarding tree-unlikeness and reliability. We hence denoted such topologies as ‘not confirmable’.
Species with confirmable topologies
Inner tree topologies frequently show the subclade shared by the majority of parasitic species, which is clearly wrong at least for some of them. Such topologies were also observed in more recent publications that were intended to model the effects of gene loss25,26,28 in the Leptospiraceae,
Species with non-confirmable topologies
The trend in newer publications towards presenting non-bifurcations for the major bacterial subclades in the inner ToL is less informative but obviously more correct. The respective five inner tree species groups that belong to our analysis are the parasites Chlamydiae, Spirochetes and Actinobacteria as well as the bacterial subclades of the Chlorobi and Cyanobacteria. In contrast to non-bifurcating (unresolved) paraphyly for these five bacterial subclades, for example [tree 13], 27 most of the phylogenies analyzed here explicitly show bifurcations in the inner tree and, therefore, suggest obvious resolution in that region of the ToL. This contrast was one of the factors stimulating the study presented here.
Our findings regarding the proximity between two taxa (Actinobacteria and Cyanobacteria; Spirochetes and Chlamydiae) is shown. Here, the high likeliness of true description of evolution should not be seen under the aspect of majority (which is suggested by a heatmap picture like the presented) but more under the aspect of congruence of similar results coming from several well-performing and accepted methods.
Uncertain near-root topology for the three subclades of the Cyanobacteria, the Chlorobi and the Eukaryota does not generally rule out their possible proximity to each other. Uncertainty is in line with the report that the reliable placement of the Cyanobacteria in the whole-genome topology is ‘somewhat difficult’.
33
Proximity of the Cyanobacteria to the Eukaryota is not a separate character state in our catalogue (Table 2). It is indirectly included in the dedicated states. We found this situation ten times among the 21 well-supported parasites phylogenies in the literature (in state –1 between Actinobacteria and Eukaryota and also in state +2 between Proteobacteria and Eukaryota). The fact that
GCT inference alternatives and the ToL
Researchers have made many efforts to optimize the combination of data model, data conditioning and inference methods. We show that tree topology profiling on confirmable and non-confirmable topologies can provide additional insights.
Our search of the relevant literature revealed that acceptable phylogenies are only produced by particular settings. These consist of the main data models such as MSAs (in combination with ML or MP) or phylogenetic trees as the basis for super-trees and also gene content data. For the latter, however, only a fraction of phylogenies was successfully inferred. The fact that GCTs derived from homology data models (including SYSTERS-PhyloMatrix) are present in both main parts of the heatmap, (ie, phylogenies with gray-bordered subcluster versus phylogenies with blue bordered subcluster; as referred to Fig. 2), indicates the tolerance of the content data model in general. We hypothesize therefore that the data model is not the critical factor for whole-genome phylogeny inferences.
As a consequence of this hypothesis, the methodology should appear to limit the inference of gene content phylogenies. We can exclude a number of inference methods connected with content data as the cause of obviously wrong results. Along with this, we can conclude that phylogenies comprising a subclade shared by all parasites–-which is clearly wrong–-are based on an artifact that is caused by the only alternative, the inference methodology. The method variation based on the SYSTERS-PhyloMatrix data model comprises also several algorithms and distance metrics that reveal wrong results: our parsimony approaches do not give reliable results, here; some of our own distance-based phylogenies (NJ with Jaccard, Dice or Hamming metric) are similarly un-reliable, like those results that were inferred with other content data such as the COGs.
In this context it should be noted that gene content calculation means counting shared gene families. Shared status numbers have to be normalized with the genome sizes of the two genomes considered. For a discussion of the latter issue, see the overview of the influence of several similarity metrics on calculated similarity by Cheetham and Hazel.
71
Similarity metrics possess the function as a normalization factor to compare the shared families in a standardized manner. Normalization is, mathematically, performed by the denominator in the similarity calculation. In most similarity metrics, the denominator includes both genome sizes, which means that the denominator is not a constant comparing eg, a small genome with several larger genomes. However, there are similarity metrics that tend to be a constant factor for large genome size differences. The denominator of the Simpson metric is
The topologies of
Distance-based approaches validate gene quantities according to gene presence and, indirectly, gene absence. The main difference to all other inference techniques is that these involve quantitative analyses of the properties of genes that are always present. Here, recent improvements in inference methodologies, for instance phylogenies of concatenated protein sequence alignments [tree 6; tree 15],34,36 produce similar results that make concordant gene content phylogenies reliable. However, differences in particular non-confirmable topologies remain.
Beyond the here presented phylogenies, several phylogeny inferences in the literature are related to data models that have varying definitions of orthology or are restricted to a particular, eg, the eukaryotic, subclade. For instance, the fungal phylogeny was assessed using a range of methodological approaches,
90
and an optimum was reported for the super-alignment approach combined with restrictive orthology as data model. Another study, restricted to the taxonomic subclade of the
GCTs based on gene content data models
A large number of the whole-genome phylogenies analyzed in this study were derived from content data. Depending on the inference method, all major data model approaches led to successful results, in particular the COGs with its derivates and the SYSTERS-PhyloMatrix as an un-modified data model.
The SYSTERS-PhyloMatrix is a homology-based data model analogous to the widely accepted COGs. Using SYSTERS as the underlying protein family set resulting from a dynamic hierarchical clustering 11 indirectly considers the heterotachy of protein families. This is an advantage that probably compensates for iterative optimization through more than 100 tree inferences, as excessively done and validated by ‘reciprocal illumination’ elsewhere. 16 From our inferences of gene content phylogenies and the presented analysis we conclude that both data models, the COGs and SYSTERS-PhyloMatrix, are directly comparable in terms of phylogeny inference results.
Using the SYSTERS-PhyloMatrix has the following advantages and consequences. First, SYSTERS-PhyloMatrix phylogenies are traceable in terms of the data model and inference methods. Using the SYSTERS-PhyloMatrix for whole-genome phylogeny inference, moreover, ensures that the (transformed) molecular sequence data basis is identical for all inference variations. Second, the SYSTERS-PhyloMatrix inference results are found within two subgroups of the subcluster in Figure 3, with well-supported whole-genome phylogeny inference results. Thereby, it is shown that the SYSTERS-PhyloMatrix data model is useful for the inference of a biologically meaningful ToL. Third, even the underlying sequence data basis itself, the SYSTERS homology inference model and the resulting protein family set, appears to be biologically meaningful.
Conclusion
With this study, we introduced a strategy for the comparison of published whole-genome phylogenies that differ extremely in tree size and inference background. Respective raw or meta-data are not or only seldom available for retracing such phylogenies by a controlled and computationally supported comparison approach. Therefore we developed a strategy for the manual validation of drawn phylogenies: tree topology profiling. In particular, we analyzed general bacterial subclades in 47 whole-genome phylogenies from 30 publications with respect to inner tree topologies. We enlarged the analysis with findings from seven own gene content phylogeny inferences based on the SYSTERS-PhyloMatrix data model. In total, more than 400 topology alternatives for nine analyzed species groups and more than 50 phylogenies are presented in tree topology profiles.
The presented tree topology profiling was applied on bacterial clans that were found to branch in the inner tree. Using this approach we first of all can separate the widely-spread artifact in published phylogenies, the shared subclade of parasitic bacteria, from topologies supported by other sophisticated methods. True topologies in a whole-genome phylogeny had been substantially shown for the eubacteria Buchnera, Rickettsia and Mollicutes. Artificial topologies for these bacteria as well as for Chlamydiae and Spirochaetes were predominantly found for particular gene content phylogenies generated with distance-based heuristics. Especially, distance metrics have more or less sensitive influence on the inference result. We give hints that small genome sizes are evident for this behavior.
Our own data model as well as other gene content data models produced good inference results with appropriate inference methods such as Neighbor Joining with Simpson or Korbel metrics. Our findings showed that the SYSTERS-PhyloMatrix gene content trees, along with the SYSTERS protein family set, are biologically meaningful. Other approaches such as gene order or multiple sequence alignments exploit, notably, the quality of present molecular information. In contrast, gene content methods validate also information of gene absence, which might cause the observed aberrances. The re-analysis revealed evidence for two general findings across a number of different phylogeny inference methods, the reciprocal proximity of the Chlamydiae to the Spirochaetes, and the reciprocal proximity of the Actinobacteria to the Cyanobacteria.
With this paper we were demonstrating the connection between topology information and particular inference parameters. The presented strategy, tree topology profiling, can moreover be used as a template for analogous studies in the scientific field of comparative phylogenomics.
Supplementary Data
Table S1: Set of 25 species that are known for gain and loss of gene families. Table S2: Event matrix for the validated gene content trees from literature for nine species groups. Table S3: Set of 106 species in SYSTERS-PhyloMatrix ordered by protein family size. Figures S1 to S7: Seven SYSTERS-PhyloMatrix gene content phylogenies.
Supplementary Files
Figures S1 to S7: Seven SYSTERS-PhyloMatrix gene content phylogenies in Nexus file format.
Author Contributions
Conceived and designed the experiments: TM, AK. Analyzed the data: TM. Wrote the first draft of the manuscript: TM. Contributed to the writing of the manuscript: TM. Agree with manuscript results and conclusions: TM, AK. Jointly developed the structure and arguments for the paper: TM, AK. Made critical revisions and approved final version: TM, AK. All authors reviewed and approved of the final manuscript.
Abbreviations
Correspondence Analysis;
Clusters of Orthologous Groups of proteins;
evolutionary genealogy of genes: nonsupervised orthologous groups;
Fitch-Margoliash (algorithm);
gene content tree;
horizontal (syn. lateral) gene transfer;
maximum likelihood;
maximum parsimony;
multiple sequence alignment;
Neighbor Joining (algorithm);
open reading frame;
ribosomal ribonucleic acid;
Shared Ortholog and Gene Order Tree Reconstruction Tool;
SYSTEmatic Re-Searching (algorithm);
Tree of Life;
Unweighted Pair Group Method with Arithmetic Mean.
Funding
TM's grant was supported by the BMBF (Federal Ministry of Education and Research of Germany), MedSys project ‘Therapeutic Systems Immunology’ (0315450A).
Competing Interests
Author(s) disclose no potential conflicts of interest.
Footnotes
Supplementary Data
Acknowledgements
The authors wish to express their gratitude to Hannes Luz for many fruitful discussions in the early phase of the study. Our colleague and friend passed away very suddenly in June 2011. The authors wish to thank Eike Staub for valuable hints and initial suggestions as well as Martin Vingron for provision of the computer capacities in the Computational Molecular Biology Department at the Max Planck Institute in Berlin-Dahlem. Initial parts of this work have been presented on the conference ‘Celebrating Darwin: From The Origin of Species to Deep Metazoan Phylogeny’, DMP 2009, Berlin, Germany. 91
As a requirement of publication author(s) have provided to the publisher signed confirmation of compliance with legal and ethical obligations including but not limited to the following: authorship and contributorship, conflicts of interest, privacy and confidentiality and (where applicable) protection of human and animal research subjects. The authors have read and confirmed their agreement with the ICMJE authorship and conflict of interest criteria. The authors have also confirmed that this article is unique and not under consideration or published in any other publication, and that they have permission from rights holders to reproduce any copyrighted material. Any disclosures are made in this section. The external blind peer reviewers report no conflicts of interest.