Open accessResearch articleFirst published online 2008
Intraspecific ITS Variability in the Kingdom Fungi as Expressed in the International Sequence Databases and Its Implications for Molecular Species Identification
The internal transcribed spacer (ITS) region of the nuclear ribosomal repeat unit is the most popular locus for species identification and subgeneric phylogenetic inference in sequence-based mycological research. The region is known to show certain variability even within species, although its intraspecific variability is often held to be limited and clearly separated from interspecific variability. The existence of such a divide between intra- and interspecific variability is implicitly assumed by automated approaches to species identification, but whether intraspecific variability indeed is negligible within the fungal kingdom remains contentious. The present study estimates the intraspecific ITS variability in all fungi presently available to the mycological community through the international sequence databases. Substantial differences were found within the kingdom, and the results are not easily correlated to the taxonomic affiliation or nutritional mode of the taxa considered. No single unifying yet stringent upper limit for intraspecific variability, such as the canonical 3% threshold, appears to be applicable with the desired outcome throughout the fungi. Our results caution against simplified approaches to automated ITS-based species delimitation and reiterate the need for taxonomic expertise in the translation of sequence data into species names.
That DNA sequence information is assigned material importance in contemporary mycology is exemplified by the recent notion of fungal barcoding, which seeks to standardize DNA-borne species identification through the use of one or more gene sequences from aptly chosen and annotated reference specimens (Hebert et al. 2003; Seifert et al. 2007; Bruns et al. 2008). The need for such protocols in mycology is patently clear: the vast number of extant fungi coupled with the dwindling number of taxonomic experts and the recondite nature of fungal life jointly make a persuasive case for barcoding-type approaches to species identification in the fungi (Guarro et al. 1999; Taylor et al. 2000; Schadt et al. 2003). The most popular locus for DNA-based mycological studies at the subgeneric level, and hence for species identification, is the internal transcribed spacer (ITS) region of the nuclear ribosomal repeat unit (Horton and Bruns, 2001; Bridge et al. 2005). This multi-copy, tripartite, and roughly 550-basepair (bp) segment combines the advantages of resolution at various scales (ITS1: rapidly evolving, 5.8S: very conserved, ITS2: moderately rapid to rapid; Hillis and Dixon, 1991; Hershkovitz and Lewis, 1996) with the ease of amplification of a multi-copy region into a readily obtainable product whose variability typically reflects synapomorphies at the species level.
Genome scans and novel molecular insights have brought attention to other genes of various copy number—notably the mitochondrial cytochrome C oxidase I (COI; Hebert et al. 2003; Little and Stevenson, 2007; Seifert et al. 2007)—that potentially could meet the occasional shortcomings of the multi-copy ITS region, such as pleomorphism and alignment difficulties (c.f. Álvarez and Wendel, 2003; Avis et al. 2006; Feliner and Rosselló, 2007). While the use of these new regions for purposes of species identification is certain to complement—perhaps even replace—that of the ITS region in some groups of fungi (Geiser et al. 2004), the difficulty associated with their generic primer design and amplification from low-quantity samples such as herbarium specimens suggest that the much more easily amplified ribosomal DNA will remain in frequent use for the foreseeable future (Tautz et al. 2003; Bruns and Shefferson, 2004; Blaxter et al. 2005). Many aspects of the nuclear ribosomal repeat region are but partly understood, however, and the prospects of the region as a barcode for the fungi has mainly been evaluated within limited taxonomic scopes. Using all 4185 available, fully identified fungal species represented by at least two satisfactory ITS sequences in the International Nucleotide Sequence Database (INSD: GenBank, EMBL, DDBJ; Benson et al. 2007), this study pursues the following questions:
Can intraspecific ITS variability in the fungi be captured in one generally applicable yet stringent interval, such as 0–3%?
It is often assumed, implicitly or otherwise, that fungal intraspecific variability is comparatively low and generally applicable across the kingdom such that it can be represented by a percentage interval, notably 0–3% (c.f. Cohan, 2002; Izzo et al. 2005; Ciardo et al. 2006). While this indeed seems to be the case for some groups of fungi (Druzhinina et al. 2005; Hinrikson et al. 2005; Smith et al. 2007), such a contention probably does not hold true for others (Martin et al. 2002; Edwards and Turco, 2005). As the absence of such a fungal-wide interval would be expected to compromise automated attempts at separation of intra-and interspecific variation, it would be of value to attain detailed knowledge on intraspecific ITS variability in all fungi presently available to the mycological community through INSD.
Is ITS1 always more variable than ITS2?
Much attention has been focused on ITS1 as the more variable sublocus of the two and thereby, presumably, the better species marker (Chen et al. 2001; Narutaki et al. 2002; Hinrikson et al. 2005). There are, however, observations to the contrary (Leaw et al. 2006), and knowledge of the extent of this deviance, as well as of any systematic signal in it, would add to our understanding of how ITS-based species identification efforts best be designed.
Is the ITS a straightforward barcode region for the fungi?
The ITS region is more often advocated than cautioned against as a vector for species identification in fungi, but these reports are typically based on subsets of fungi, often at the family level or lower (Sugita et al. 1999; Henry et al. 2000; Iwen et al. 2002). The picture emerging from joint analysis of all available fungal ITS sequences should be highly indicative of the performance of the ITS as a barcode region in the fungi.
This study uses the INSD data on an as-is basis. It is well known that the taxonomic reliability in public sequence databases is less than ideal (Bridge et al. 2003; Binder et al. 2005; Nilsson et al. 2006) and that there are other compounding factors such as chimeric sequences and obsolete classification systems and synonyms (Ashelford et al. 2005; Bidartondo et al. 2008; Ryberg et al. 2008) that render difficult the extrication of true taxonomic signal from the welter of noise surrounding it. While this will always hamper automated approaches to en masse sequence analysis, the present study takes several measures to account for these complications as to provide reasonably objective answers to the above questions.
Materials and Methods
Compilation of data
All fungal ITS sequences identified to species level in INSD as of August 6, 2007 were downloaded using emerencia 1.0 (Nilsson et al. 2005). The 2995 entries identified by Nilsson et al. (2006) as potentially misidentified or otherwise problematic were discarded from the study. Similarly, sequences with less than 100 bp. in either of ITS1 or ITS2, as well as sequences with more than 1% IUPAC DNA ambiguity symbols in any of the three ITS subregions, were excluded. Hidden Markov Models (HMMs) of the flanking nuclear small sub-unit (nSSU), 5.8S, and nuclear large sub-unit (nLSU) were constructed from the large-scope fungal alignments of Tehler et al. (2003); Larsson et al. (2004); Binder et al. (2005); and James et al. (2006) using HMMER 2.3.2 (Eddy, 1998). After calibration, the HMMs enabled in silico extraction of ITS1, 5.8S, and ITS2 from the downloaded sequences using Perl (Supplementary Document 1).
Data analysis
Intraspecific pairwise alignments of all loci considered (ITS1, 5.8S, ITS2, and jointly) were generated in Clustal W 1.83 (Thompson et al. 1997) for all 4185 species for which satisfactory INSD data from two or more specimens were available. Sequence similarity in the form of absolute, uncorrected (Hamming) distances (c.f. Minichini and Sciarrino, 2006) for all combinations of two conspecific specimens were computed in Python (Supplementary Document 1); from these distance matrices, median intraspecific similarities for each species were retrieved as to further reduce the impact of potentially contestable records using the statistical language R 2.5.1 (R Development Core Team, 2007; Supplementary Document 1). For the 16 species represented by more than 100 ITS sequences in INSD, the estimates were based on a random sample of 100 sequences from these. To derive global values for the intraspecific variability of the kingdom Fungi and its five conceptual phyla (Ascomycota, Basidiomycota, Chytridiomycota, Glomeromycota, and Zygomycota), weighted averages with weights proportional to the number of available sequences for each species were computed; the weighting scheme employed assigns higher importance to well-sampled species without disregarding more poorly represented species.
Results and Discussion
The ease with which the ITS region can be amplified from a variety of fungi in various morphs and states of preservation—as well as its high level of synapomorphic variability in many groups of fungi—have given impetus to several ITS-based barcoding-type efforts for select groups of fungi (e.g. Druzhinina et al. 2005; Kopchinskiy et al. 2005; Kõljalg et al. 2005). Given the decisive role assigned to the region, it may perhaps seem curious that many of its facets remain poorly understood, and the present study seeks to provide the data needed to examine these in a critical way. The questions pursued and the results obtained are constrained by, and to some extent reflective of, the wanting state of taxonomic reliability in the public sequence databases. Attempts were made to correct for outlier sequences, thereby abating the impact of inconsistent application of species names and the vagaries of laboratory work. Even so, for some common root-and soil associated fungi such as Rhizoctonia, Latin binomials seem little more than convenient placeholders under which specimens are subsumed in the absence of conflictory, but also confirmatory, evidence. Our results furthermore capture taxonomic complications such as the hypothesized presence of hybridisation in Tricholoma sulphureum (Comandini et al. 2004) and cryptic speciation in Laetiporus sulphureus (Rogers et al. 1999). As such the data obtained seem to corroborate one of the corollaries arising from the barcoding debate, namely that it may not lie in the interest of the mycological community to allow open and non-validated submission of barcodes to the international sequence databases. Similarly, continuous curation of taxonomic and nomenclatural aspects of reference sequences on part of both the sequence authors and the database in question appears a crucial element of molecular mycology.
One noticeable aspect of our assessment of fungal intraspecific variability is that the uncertainty of the estimates tends to decrease as the number of conspecific sequences available for any given species increases (Supplementary Document 2). In other words, more than some few conspecific sequences may be required to encompass the genetic variation found among populations of distinct localities. This observation calls into question the considerable number of barcoding studies based on less than a handful of collections per species (c.f. Little and Stevenson, 2007) and indeed the use of a single, defining sequence as arbiter of conspecificity in the first place. Other conveyors of amalgamated information, notably HMMs and multiple alignments (Eddy, 1998; Nilsson et al. 2004), appear much more suited to capture and relay such complexity.
Intraspecific ITS variability
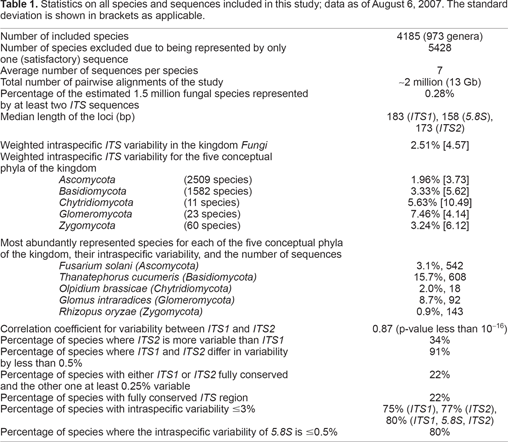
The fungal intraspecific ITS variability as expressed in INSD does not readily lend itself to partitioning into clearly defined units. As defined in Materials and Methods, the weighted average of the intraspecific ITS variability of the kingdom Fungi is 2.51% with a standard deviation (SD) of 4.57 (Ascomycota: 1.96%, SD 3.73; Basidiomycota: 3.33%, SD 5.62; Chytridiomycota: 5.63%, SD 10.49; Glomeromycota: 7.46%, SD 4.14; Zygomycota: 3.24%, SD 6.12; Table 1). The comparatively well-studied Dikarya (Ascomycota and Basidiomycota) stands out as less variable than the basal fungal lineages, although these regions of the kingdom are rather sparsely represented by ITS sequences such that taxonomic intricacies and the deficient state of some sequence data are likely to attain a higher degree of penetration for these taxa. The canonical 3% threshold value for intraspecific variation fares surprisingly well for the fungi (Fig. 1), but it is nevertheless refuted by multiple examples from all fungal phyla (Supplementary Document 3).
Statistics on all species and sequences included in this study; data as of August 6, 2007. The standard deviation is shown in brackets as applicable.
Number of included species
4185 (973 genera)
Number of species excluded due to being represented by only one (satisfactory) sequence
5428
Average number of sequences per species
7
Total number of pairwise alignments of the study
~2 million (13 Gb)
Percentage of the estimated 1.5 million fungal species represented by at least two ITS sequences
0.28%
Median length of the loci (bp)
183 (ITS1), 158 (5.8S), 173 (ITS2)
Weighted intraspecific ITS variability in the kingdom Fungi Weighted intraspecific ITS variability for the five conceptual phyla of the kingdom
2.51% [4.57]
Ascomycota (2509 species)
1.96% [3.73]
Basidiomycota (1582 species)
3.33% [5.62]
Chytridiomycota (11 species)
5.63% [10.49]
Glomeromycota (23 species)
7.46% [4.14]
Zygomycota (60 species)
3.24% [6.12]
Most abundantly represented species for each of the five conceptual phyla of the kingdom, their intraspecific variability, and the number of sequences
Fusarium solani (Ascomycota)
3.1%, 542
Thanatephorus cucumeris (Basidiomycota)
15.7%, 608
Olpidium brassicae (Chytridiomycota)
2.0%, 18
Glomus intraradices (Glomeromycota)
8.7%, 92
Rhizopus oryzae (Zygomycota)
0.9%, 143
Correlation coefficient for variability between ITS1 and ITS2
0.87 (p-value less than 10−16)
Percentage of species where ITS2 is more variable than ITS1
34%
Percentage of species where ITS1 and ITS2 differ in variability by less than 0.5%
91%
Percentage of species with either ITS1 or ITS2 fully conserved and the other one at least 0.25% variable
22%
Percentage of species with fully conserved ITS region
22%
Percentage of species with intraspecific variability ≤3%
75% (ITS1), 77% (ITS2), 80% (ITS1, 5.8S, ITS2)
Percentage of species where the intraspecific variability of 5.8S is ≤0.5%
80%
The proportion of fungal species in this study having intraspecific variabilities in the ranges depicted of (A) the ITS1 region, (B) the ITS2 region, and (C) the ITS1, 5.8S, and ITS2 regions combined.
Interestingly, our results also offer examples of well-and independently sampled species with low or no intraspecific variability (e.g. Boletus pinophilus and Serpula lacrymans; Supplementary Document 3). The wide spread in intraspecific variability observed testifies to the apparent futility of trying to find a single unifying yet stringent fungal-wide cut-off value to demarcate intra- from interspecific variability (Fig. 1; Supplementary Document 2). Such divides between intra- and interspecific variability—barcoding gaps—will, if at all in existence, have to be sought in different regions of variation space depending on the taxa under consideration; there is furthermore little to suggest that such divides in similarity could be deduced by taxonomic knowledge and logic alone. Even when collapsing the mushroom-forming Agaricomycetes in Supplementary Document 3 into formal orders as applicable (Hibbett et al. 2007), no such group could be classified as “easily barcoded”: all orders feature taxa that are considerably below, roughly at, and markedly above the fungal-wide average for intraspecific ITS variability. A similar pattern is observed when grouping these fungi according to putative nutritional mode, but whether these inferences will persist in the light of extended taxon sampling remains at issue.
Internal ITS variability
Our results show that the variability of ITS1, at least on average, exceeds that of ITS2 (Fig. 1). The difference in variability is noticeable at times (e.g. Hypocrea citrina and Malassezia furfur, both with >3% difference). In other cases, such as Boletus edulis and Cordyceps bassiana—with less than 1% difference—and Agaricus bisporus and Alternaria brassicae—with no difference—it is less conspicuous. For 34% of the fungal species compared, however, ITS2 is more variable than ITS1, which refutes the common assumption that ITS1 always is the most variable spacer of the ITS region. Indeed, it would seem likely that for certain taxa, ITS2 represents a better vector of low-level taxonomic information. We did not find evidence, however, for any phylum-wide systematic component to this observation as comparatively higher levels of ITS2 variability could not be significantly related to phylum-wise affiliation (Fisher's exact test, p-value >0.05). The overall variation in ITS1 and ITS2 was found to be highly correlated (0.87; Supplementary Document 2) which supports the view that the two regions do not evolve independently of one another.
The 5.8S is typically fully conserved within a species, and the variation sometimes observed is negligible (weighted average: 0.21%, SD 0.67). Counterintuitively, therefore, the region can be expected to interfere with pre-defined threshold values for intraspecific variation. Supplementary Document 3 shows that even if both the ITS1 and ITS2 are more than 3% variable within one and the same species, the inclusion of the very conserved 5.8S may serve to reduce the apparent variability of the joint region into less than 3%, thereby masking the distinctness indicated by its flanking regions (as is the case for, e.g. Rhizopogon roseolus and Xerocomus subtomentosus). Our data suggest that the 5.8S, while arguably useful in other contexts (Hershkovitz and Lewis, 1996; Larsson et al. 2004), may be best left out from such estimates.
The ITS region as a fungal barcode
The ever-increasing prevalence of fungal environmental samples generated in ecological studies accentuates the need for automated, high-throughput approaches to species identification, and many such initiatives are indeed centered around the ITS region. This study shows that the ITS region is not equally variable in all groups of fungi (Table 2) and that the variation does not seem to be easily correlated to the systematic affiliation or nutritional mode of the species. These disparities speak against automated species delimitation using, for example, a global 3% cut-off value. To devise efficient fungal barcodes based on the ITS region will require, it would seem, far-reaching taxonomic knowledge specific to each group of fungi; a large number of conspecific specimens from as many populations and geographical regions as can be reasonably achieved; and possibly the erection of one or more tailored, closed-submission databases for the purpose. Criticism has been raised against the barcoding community for not taking these matters seriously enough (Wheeler, 2004; Will et al. 2005; Meier et al. 2006), and the present study lends further weight to the importance of these claims.
Intraspecific ITS variability of select species from each of the five conceptual phyla of the kingdom Fungi. Taxon selection was influenced by scheduled, ongoing, and completed genome projects.
Taxonomic affiliation
Sequences
Intraspecific ITS variability
Ascomycota
Aspergillus fumigatus
43
0.2%
Candida albicans
56
0.2%
Fusarium solani
542
3.1%
Saccharomyces cerevisiae
145
0.8%
Xanthoria parietina
54
0.6%
Xylaria hypoxylon
13
24.2%
Basidiomycota
Amanita muscaria
45
0.9%
Boletus edulis
22
0.3%
Coprinopsis echinospora
7
2.6%
Filobasidiella neoformans
114
0.0%
Puccinia graminis
28
2.4%
Rhizoctonia bataticola
6
17.3%
Ustilago maydis
5
0.5%
Chytridiomycota
Olpidium brassicae
18
2.0%
Blastocladiella emersonii
2
2.0%
Glomeromycota
Archaeospora leptoticha
62
9.8%
Glomus intraradices
92
8.7%
Glomus mosseae
84
5.9%
Paraglomus occultum
12
19.5%
Zygomycota
Absidia corymbifera
9
0.7%
Endogone pisiformis
3
2.6%
Mucor racemosus
9
8.4%
Rhizopus oryzae
143
0.9%
Zoophthora radicans
7
1.5%
Conclusions
A plexus of pleomorphic organisms, fungi often defy assignment to genus or even family level, and it is becoming progressively apparent that molecular information will soon take over the role as the primary source for reliable species identification in all but for some few groups of fungi. It is moreover clear that these methods have only begun to reveal the true face of fungal diversity in that the absolute majority of fungi still await discovery and formal description (Hawksworth, 2001; Blackwell et al. 2006; Schmit and Mueller, 2007). Much of this diversity is recovered from ecological samples such as soil and plant debris in total absence of any physical manifestation of the fungi present. The mere observation that the multi-copy ITS region can be amplified from these low-quantity samples, whereas many low- and single-copy genes currently cannot, implies that the ITS region will remain a mycological cornerstone for a long time to come. That the region typically shows variation within, and to an even larger extent among, species turns the region into a valuable vector for mycological pursuits, although one for which not all preconceived ideas and assumptions hold true. The large number of fungi for which the ITS has been generated further serves to increase the usefulness of the region for purposes of comparison, but whether it will ever be truly useful also for automated species delimitation remains an open question—and one that the present results do not seem to answer in the affirmative.
Footnotes
Acknowledgements
Financial support from the foundations of Anna and Gunnar Vidfelt and Wilhelm and Martina Lundgren (RHN) and from Helge Ax:son Johnson and KVVS (MR) is gratefully acknowledged. Only freely available software was used in the making of this study.
References
1.
ÁlvarezI., and WendelJ.F.2003. Ribosomal ITS sequences and plant phylogenetic inference. Mol. Phylogenet. Evol., 29: 417–34.
2.
AshelfordK.E., ChuzhanovaN.A., FryJ.C.2005. At least 1 in 20 26S rRNA sequence records currently held in public repositories is estimated to contain substantial anomalies. Appl. Environ. Microbiol., 71: 7724–36.
3.
AvisP.G., DickieI.A., and MuellerG.M.2006. A ‘dirty’ business: Testing the limitations of terminal restriction fragment length polymorphism TRFLP) analysis of soil fungi. Mol. Ecol., 15: 873–82.
BidartondoM., BrunsT.D., BlackwellM.2008. Preserving accuracy in GenBank. Science, 319: 1616.
6.
BinderM., HibbettD.S., LarssonK-H.2005. The phylogenetic distribution of resupinate forms across the major clades of mushroom-forming fungi (Homobasidiomycetes). Syst. Biodiv., 3: 113–57.
7.
BlackwellM., HibbettD.S., TaylorJ.W.2006. Research coordination networks: a phylogeny for kingdom Fungi (Deep Hypha). Mycologia, 98: 829–37.
8.
BlaxterM., MannJ., ChapmanT.2005. Defining operational taxonomic units using DNA barcode data. Philos Trans. R. Soc. Lond. B. Biol. Sci., 360: 1935–43.
9.
BridgeP.D., RobertsP.J., SpoonerB.M.2003. On the unreliability of published DNA sequences. New Phytol., 160: 43–8.
10.
BridgeP.D., SpoonerB.M., and RobertsP.J.2005. The impact of molecular data in fungal systematics. Adv. Bot. Res., 42: 33–67.
11.
BrunsT.D., ArnoldA.E., and HughesK.W.2008. Fungal networks made of humans: UNITE, FESIN, and frontiers in fungal ecology. New Phyt., 177: 586–8.
12.
BrunsT.D., and SheffersonR.P.2004. Evolutionary studies of ectomycorrhizal fungi: recent advances and future directions. Can. J. Bot, 82: 1122–32.
13.
ChenY.C., EisnerJ.D., KattarM.M.2001. Polymorphic internal transcribed spacer region 1 DNA sequences identify medically important yeasts. J. Clin. Microbiol., 39: 4042–51.
14.
CiardoD.E., SchärG., BöttgerE.C.2006. Internal transcribed spacer sequencing versus biochemical profiling for identification of medically important yeasts. J. Clin. Microbiol., 44: 77–84.
15.
CohanF.M.2002. What are bacterial species. Ann. Rev. Microbiol., 56: 457–87.
16.
ComandiniO., HaugI., RinaldiA.C.2004. Uniting Tricholoma sulphureum and T. bufonium. Mycol Res., 108: 11620–71.
17.
DruzhininaI.S., KopchinskiyA.G., Komon-ZelazowskaM.2005. An oligonucleotide barcode for species identification in Trichoderma and Hypocrea. Fungal Genet. Biol., 42: 813–28.
EdwardsI.P., and TurcoR.F.2005. Inter- and intraspecific resolution of nrDNA TRFLP assessed by computer-simulated restriction analysis of a diverse collection of ectomycorrhizal fungi. Mycol. Res., 109: 212–26.
20.
FelinerG.N., and RossellóJ.A.2007. Better the devil you know? Guidelines for insightful utilization of nrDNA ITS in species-level evolutionary studies in plants. Mol. Phylogenet. Evol., 44: 911–9.
21.
GeiserD.M., Jiménez-GascoM., KangS.2004. FUSARIUM-ID v.1.0: A DNA sequence database for identifying Fusarium. Eur. J. Plant Pathol., 110: 473–9.
22.
GuarroJ., GenéJ., and StchigelA.M.1999. Developments in fungal taxonomy. Clin. Microbiol. Rev., 12: 454–500.
23.
HawksworthD.L.2001. The magnitude of fungal diversity: the 1.5 million species estimate revisited. Mycol. Res., 105: 1422–32.
24.
HebertPDN., CywinskaA., BallS.L.2003. Biological identifications through DNA barcodes. Proc. R. Soc. Lond. B., 270: 313–21.
25.
HenryT., IwenP.C., and HinrichsS.H.2000. Identification of Aspergillus species using internal transcribed spacer regions 1 and 2. J. Clin. Microbiol., 38: 1510–5.
26.
HershkovitzM.A., and LewisL.A.1996. Deep-level diagnostic value of the rDNA-ITS region. Mol. Biol. Evol., 13: 1276–95.
27.
HibbettD.S., BinderM., BischoffJ.F.2007. A higher-level phylogenetic classification of the Fungi. Mycol. Res., 111: 509–47.
28.
HillisD.M., and DixonM.T.1991. Ribosomal DNA: Molecular evolution and phylogenetic inference. Q. Rev. Biol., 66: 411–53.
29.
HinriksonH.P., HurstS.F., LottT.J.2005. Assessment of ribosomal large-subunit D1–D2, internal transcribed region spacer 1, and internal transcribed spacer 2 regions as targets for molecular identification of medically important Aspergillus species. J. Clin. Microbiol., 43: 2092–103.
30.
HortonT.R., and BrunsT.D.2001. The molecular revolution in ectomycorrhizal ecology: peeking into the black-box. Mol. Ecol., 10: 1855–71.
31.
IwenP.C., HinrichsS.H., and RuppM.E.2002. Utilization of the internal transcribed spacer regions as molecular targets to detect and identify human fungal pathogens. Med. Mycol., 40: 87–109.
32.
IzzoA., AgbowoJ., and BrunsT.D.2005. Detection of plot-level changes in ectomycorrhizal communities across years in an old-growth mixed-conifer forest. New Phytol., 166: 619–30.
33.
JamesT.Y., KauffF., SchochC.L.2006. Reconstructing the early evolution of Fungi using a six-gene phylogeny. Nature, 443: 818–22.
34.
KopchinskiyA., KomoM., KubicekC.P.2005. TrichoBLAST: a multilocus database for Trichoderma and Hypocrea identifications. Mycol. Res., 109: 658–60.
35.
KõljalgU., LarssonK-H., AbarenkovK.2005. UNITE: a database providing web based methods for the molecular identification of ectomycorrhizal fungi. New Phytol., 166: 1063–8.
36.
LarssonK-H., LarssonE., and KõljalgU.2004. High phylogenetic diversity among corticioid homobasidiomycetes. Mycol. Res., 108: 983–1002.
37.
LeawS.N., ChangH.C., SunH.F.2006. Identification of medically important yeast species by sequence analysis of the internal transcribed spacer regions. J. Clin. Microbiol., 44: 693–9.
38.
LittleD.P., and StevensonD.W.2007. A comparison of algorithms for the identification of specimens using DNA barcodes: examples from gymnosperms. Cladistics, 23: 1–21.
39.
MartinF., DiezJ., DellB.2002. Phylogeography of the ectomycorrhizal Pisolithus species as inferred from nuclear ribosomal DNA ITS sequences. New Phytol., 153: 345–57.
40.
MeierR., ShiyangK., VaidyaG.2006. DNA barcoding and taxonomy in Diptera: a tale of high intraspecific variability and low identification success. Syst. Biol., 55: 715–28.
41.
MinichiniC., and SciarrinoA.2006. Mutation model for nucleotide sequences based on crystal basis. Biosystems, 84: 191–206.
42.
NarutakiS., TakatoriK., NishimuraH.2002. Identification of fungi based on the nucleotide sequence homology of their internal transcribed spacer 1 (ITS1) region. PDA J Pharm Sci. Technol., 56: 90–8.
43.
NilssonR.H., KristianssonE., RybergM.2005. Approaching the taxonomic affiliation of unidentified sequences in public databases—an example from the mycorrhizal fungi. BMC Bioinformatics, 6: 178.
44.
NilssonR.H., LarssonK-H., and UrsingB.M.2004. galaxie—CGI scripts for sequence identification through automated phylogenetic analysis. Bioinformatics, 20: 1447–52.
45.
NilssonR.H., RybergM., KristianssonE.2006. Taxonomic reliability of DNA sequences in public sequences databases: a fungal perspective. PLoS ONE, 1: e59.
46.
R Development Core Team.2007. R: A Language and Environment for Statistical Computing. R. Foundation for Statistical Computing, Austria.
47.
RogersS.O., HoldenriederO., and SieberT.N.1999. Intraspecific comparisons of Laetiporus sulphureus isolates from broadleaf and coniferous trees in Europe. Mycol. Res., 103: 1245–51.
48.
RybergM., NilssonR.H., KristianssonE.2007. Mining ecological metadata in GenBank: a case-study from Inocybe (Agaricales). BMC Evolutionary Biology, 8: 50.
49.
SchadtC.W., MartinA.P., LipsonD.A.2003. Seasonal dynamics of previously unknown fungal lineages in tundra soils. Science, 301: 1359–61.
50.
SchmitJ.P., and MuellerG.M.2007. An estimate of the lower limit of global fungal diversity. Biodiversity Conserv., 16: 99–111.
51.
SmithM.E., DouhanG.W., and RizzoD.M.2007. Intra-specific and intra-sporocarp ITS variation of ectomycorrhizal fungi as assessed by rDNA sequencing of sporocarps and pooled ectomycorrhizal roots from a Quercus woodland. Mycorrhiza, 18: 15–22.
52.
SeifertK.A., SamsonR.A., deWaardJ.R.2007. Prospects for fungus identification using CO1 DNA barcodes, with Penicillium as a test case. Proc. Natl. Acad. Sci. U.S.A., 104: 3901–6.
53.
SugitaT., NishikawaA., IkedaR.1999. Identification of medically relevant Trichosporon species based on sequences of internal transcribed spacer regions and construction of a database for Trichosporon identification. J. Clin. Microbiol., 37: 1985–93.
54.
TautzD., ArctanderP., MinelliA.2003. A plea for DNA taxonomy. Trends Ecol. Evol., 18: 70–4.
55.
TaylorJ.W., JacobsonD.J., KrokenS.2000. Phylogenetic species recognition and species concepts in fungi. Fungal Genet. Biol., 31: 21–32.
56.
TehlerA., LittleD., and FarrisJ.S.2003. The full-length phylogenetic tree from 1551 ribosomal sequences of chitinous fungi, Fungi. Mycol. Res., 107: 901–16.
57.
ThompsonJ.D., GibsonT.J., PlewniakF.1997. The CLUSTAL_X windows interface: flexible strategies for multiple sequence alignment aided by quality analysis tools. Nucleic Acids Res., 25: 4876–82.
58.
WheelerQ.D.2004. Taxonomic triage and the poverty of phylogeny. Philos Trans. R. Soc. Lond B. Biol. Sci., 359: 571–83.
59.
WillK.W., MishlerB.D., and WheelerQ.D.2005. The perils of DNA barcoding and the need for integrative taxonomy. Syst. Biol., 54: 844–51.