
Abstract
The present work focuses on the in silico characterization of functional divergence of two ovine cathelicidin coding sequence (cds) variants (ie, Cath1 and Cath2) of Indian sheep. Overlapping partial cds of both the cathelicidin variants were cloned in pJet1.2/blunt vector and sequenced. Evolutionary analysis of the Cath2 and Cath1 indicated that the mammalian cathelicidins clustered separately from avian fowlicidins. The avian fowlicidins, which are very different from mammalian cathelicidins (Caths), clearly displayed signatures of purifying selection. The pairwise sequence alignments of translated amino acid sequences of these two sheep cathelicidins showed gaps in the antimicrobial domain of Cath1 variant; however, the amino terminal cathelin regions of both the Caths were conserved. Amino acid sequence analysis of full-length cathelicidins available at public database revealed that Cath1, Cath2, and Cath7 of different ruminant species (including our Cath1 and Cath2 variants) formed individual clads, suggesting that these types have evolved to target specific types of microbes. In silico analysis of Cath1 and Cath2 peptide sequences indicated that the C-terminal antimicrobial peptide domain of Cath2 is more immunogenic than that of the ovine Cath1 due to its higher positive antigenic index, making Cath1 a promising antigen for production of monoclonal antibodies.
Introduction
The cathelicidin peptide family of antimicrobial peptides (AMPs) is structurally characterized by the N-terminal cathelin domain, 1 which is very similar to the cathepsin-L inhibitor cathelin (henceforth called cathelicidin), 2 and a variable C-terminal antimicrobial domain. Most cathelicidins are differentially expressed in a variety of tissues and exhibit broad spectral antimicrobial activity against several fungi, protozoa, Gram-negative and Gram-positive bacteria, and enveloped viruses. 3 Cathelicidins have been identified in mammalian4–6 and nonmammalian animal species.7–10 A wide array of cathelicidin variants with diverse range of antimicrobial functions 11 have been discovered in domesticated species. In contrast, humans, mice, and rats have only one known multifunctional cathelicidin gene. 12
In general, the cathelicidin genes are approximately of 2 kb size, and have four exons interleaved by three introns.
13
The first three exons encode the signal peptide and cathelin domains, and the last exon codes for the antimicrobial domain with elastase processing site.
12
Huttner and colleagues
2
reported that eight ovine cathelicidin genes, located on the ovine chromosome 19, encode for seven different cathelicidins. Out of these, two are α-helical peptides: SMAP29 (
Materials and Methods
Collection of samples
The experiment was conducted on a local sheep breed of Punjab, India, which is being maintained by farmers for wool and mutton. Peripheral blood (5 mL) was aseptically collected in an anticoagulant from the jugular vein of healthy adult sheep using a sterile 24-gauge needle in a 15 mL conical tube containing 0.5 M EDTA. Ethical approval was obtained from the Institutional Animal Ethics Committee at Guru Angad Dev Veterinary and Animal Sciences University, Ludhiana.
Total RNA extraction and cDNA synthesis
Total RNA was extracted from whole blood by erythrolysis using chilled 1 × RBC lysis buffer (ammonium chloride 0.83 g, ammonium bicarbonate 0.1 g, EDTA 0.5 M 20 μL, and DEPC-treated water (0.1%) up to 100 mL) followed by centrifugation at 3,000 rpm for 10 minutes at 4 °C to precipitate a white pellet. The isolated white pellet was resuspended in 1 mL of Trizol reagent (Invitrogen) to isolate the total RNA. The quantity and the purity of the extracted total RNA was checked using NanoDrop (Thermo Scientific). The RNA samples with concentration >1,000 ng/μL and ratio of absorbance (260/280) between 1.95 and 2.15 were used for cDNA synthesis.
cDNA synthesis and cloning
The first-strand cDNA was synthesized using the RevertAid First Strand cDNA Synthesis Kit (Thermo Scientific), as per the manufacturer's protocol. The primers (Table 1) were designed using the ovine (exotic breed) coding sequences (cds) of Ovis aries 5 kDa bactinecin precursor (BAC5) (NCBI Acc. No. NM_001009787.1) and O. aries procyclic dodecapeptide (CATHL1B) (NCBI Acc. No. NM_001009772.1) using ABI Primer Express software and custom synthesized from Integrated DNA Technologies (IDT, USA). BLASTn sequence analysis of the PCR amplicons revealed homology with Cath2 and Cath1 of other ruminant species, and therefore these primer pairs were named Cath2 and Cath1, respectively.
Primer pairs used for PCR amplification of Cath1 and Cath2 coding sequence of Indian sheep.

The purified PCR products were ligated to pJet1.2/blunt-cloning vector and transformed into E. coli TOP10 strain, as per standard protocol. 15 Restriction endonuclease digestion using BglII confirmed the insert in the recombinant vector. The isolated plasmids were sequenced (University of Delhi, New Delhi, India).
Sequence analysis
The pipeline of the present experiment is depicted in Supplementary Figure 1 (Pipeline of the experimental methods.png).

Pairwise sequence alignment of the ovine cathelicidin peptide sequences (Cath2: A973433 and Cath1: AB974690) in silico translated from the coding sequences obtained from the present study.
Processing and homology search of coding sequence data
The cloned sequences of Cath1 and Cath2 were trimmed and edited using BioEdit, Version 7.2.3. 16 The full-length coding sequences (cds) were submitted to the DNA Data Bank of Japan. BLASTn 17 search of the obtained cds yielded 83 homologous and heterologous full-length coding sequences (E-value <10–5) of cathelicidin variants of divergent animal species. Those sequences were downloaded in the FASTA format from the NCBI database (http://blast.ncbi.nlm.nih.gov/). The in silico translated (using the Expasy Translation tool) complete amino acid sequences of 83 selected cathelicidins were retrieved in FASTA format.
Pairwise and multiple sequence alignment
The DNAStar (Lasergene, DNAStar.Inc.) software and the online tools MAFFT (http://www.ebi.ac.uk/Tools/msa/mafft/) and Clustal Omega (http://www.ebi.ac.uk/Tools/msa/clustalo/) were used for pairwise sequence alignment of the ovine cathelicidins (Cath2 and Cath1) as well as multiple sequence alignment of all the 85 complete cathelicidin peptide sequences (Alignment data available in Supplementary File S1. 85 AA Aln.FAS.MDSX).
Construction of phylogenetic tree
The best evolutionary model was selected using MEGA6 18 software, based on the lowest Bayesian information criterion (BIC) scores. The Akaike information criterion (AICc)-corrected values were determined for each of the models. The best model for analyzing the amino acid data was the Jones–Taylor–Thornton (JTT) matrix-based model. 19 MEGA6 software was used for construction of phylogenetic tree and estimation of evolutionary divergence, and Fisher's exact test and codon-based test were used for determining the selection pressure on the cathelicidin variants. The evolutionary tree was constructed using the maximum likelihood method, considering the JTT substitution model and five discrete Gamma categories for rates of substitution among sites. The reliability of the branching of the tree was checked by 1,000 bootstrap resampling (phylogenetic tree file: Supplementary File S2. AA ML Non-Compressed Tree1, opens in MEGA6).
Evolutionary divergence
The evolutionary divergence between the peptides was estimated using the JTT substitution model. 19 The heatmap and the sample dendrogram for evolutionary divergence of the ruminant cathelicidin variants were generated using the WGCNA package of R (version 3.0.2) (codes available in Supplementary File S4. R Codes Ev. Analysis Data). The heatmap was constructed using the evolutionary divergence matrix (data available in Supplementary File S3. Ev. Div. Rum Matrix).
Disparity index and Fisher's exact test
The amino acid sequences were tested for homogeneity of the substitution pattern (disparity index) using 100 Monte Carlo replications and complete deletions of gaps. 20 The probability (P) of rejecting the null hypothesis of strict neutrality in favor of the alternative hypothesis of positive selection (Fisher's exact test) for each sequence pair 21 was calculated. The numbers of synonymous and nonsynonymous differences between sequences were estimated using the Nei–Gojobori method (assumed transition/transversion bias = 2). 22
Determining the sites of positive or negative selection
Nineteen complete cds representing the Cath variants of ruminant species (ie, taurine (NCBI Acc. nos BC133480, BC120477, L02650), bubaline (XM006065184, AJ812216, EF050453, XM006065185), caprine (XM005696006, NM001285577), ovine (AB973433, NM001009787), yak (XM005910806)), along with some non-ruminant Cath sequences as outgroup [equine (AJ224927, NM001081930), canine (AY392089), feline (NM001204778), donkey (FJ803910), primates (BC055089, AF181954)] were selected. The positive, negative, or neutral selection pressure being experienced by each of the codons was determined by different statistical methods, namely, single likelihood ancestor counting (SLAC), fixed effects likelihood (FEL), internal branch FEL (IFEL), and finally, random effects likelihood (REL) 23 using the Datamoneky (www.datamonkey.org/) online server. 24 At the beginning, a model selection was run to test all the 203 time-reversible models. A hierarchical testing (http://www.datamonkey.org/help/models.php) amalgamated with nested likelihood ratio test (LRT) with AIC-corrected selection was done by the server to obtain a single “best-fitting” rate matrix. Significance level was set separately for each of the analyses (SLAC, FEL, IFEL, and REL). Branch-site REL test (BSR) 25 for episodic diversifying selection (EDS) was done to endure any variation in evolutionary rate along branches vis-à-vis sites (http://www.datamonkey.org/help/index.php). EDS identifies the branches that has experienced a transient but not easily detectable selection during evolution. 26 The impact of positive selection on the subsets of sites was determined by this analysis, without any a priori proof about the lineages of interest.
Comparison of predicted protein structures
The amino acid sequences of both cathelicidins (Cath2 and Cath1) were deduced from the cds using Expasy Translation tool (http://web.expasy.org/translate/) and then were subjected to secondary structure prediction using Psipred v3.0 (http://bioinf.cs.ucl.ac.uk/psipred/) 27 and tertiary structure prediction by an ab initio approach using the online available tool RaptorX (http://raptorx.uchicago.edu/). 28 The tertiary protein structure obtained from RaptorX protein was subjected to structure validation using the WhatIf online tool (http://swift.cmbi.ru.nl/whatif/), and Ramachandran's plot analysis was done for validation of the predicted protein structure using the RAMPAGE online tool (http://mordred.bioc.cam.ac.uk/~rapper/rampage.php). 29 The DNAStar (Lasergene) software was used for determining the biochemical features of both ovine Cathelicidins (Cath1 and Cath2). The antigenicity of the peptides (Cath1 and Cath2) was predicted by the Protean tool of DNAStar, Lasergene, software suit.
Results and Discussion
Cloning and sequencing of cathelicidin
The positive clones were confirmed for the presence of the insert by restriction enzyme digestion, and two isolated plasmids of Cath2 and Cath1 were sequenced. The sequences of both cathelicidin cds were submitted to DNA Data Bank of Japan [DDBJ getentry Acc. No. of Cath2: AB973433.1 (http://getentry.ddbj.nig.ac.jp/getentry/na/AB973433.1/) and Cath1: AB974690.1 (http://getentry.ddbj.nig.ac.jp/getentry/na/AB974690.1/)].
Pairwise sequence alignment of Cath1 and Cath2 peptides
The pairwise alignments of Cath2 and Cath1 (Fig. 1) showed considerable variations in the AMP region; however, the signal peptide and cathelin domain regions were relatively conserved. These two variants of cathelicidin peptides may have thus evolved to confer protection against different microbes.
Multiple sequence alignment of ruminant cathelicidin peptides
The multiple sequence alignment of the cathelicidin types in ruminant species revealed that the lengths of the signal peptide and the cathelicidin domains are nearly same; however, considerable variation was found in the mature peptide (harboring the AMP domain) region. It can also be inferred that the variations in the AMP region signify different specificity of the cathelicidin variants for wider array of microorganisms.
Phylogenetic analysis
The tree depicts (Fig. 2) that the mammalian cathelicidin variants cluster distinctly from that of the avian cluster. The marine animals cluster along with other mammals, as the marine animals included in this study are also mammals (ie, different types of whales and dolphins). Cath1, Cath2, and Cath7 of different ruminant species form individual clads (irrespective of species specificity), suggesting that the cathelicidin types have evolved to target specific cathelicidin types of microbes. The tree also demonstrates that the different cathelicidin variants Cath4, Cath5, and Cath6 belonging to same species have clustered in different clads due to the difference in sequences among variants within same species vis-à-vis homology among the same Cath variant belonging to different ruminant species. The primates have formed a separate clad from the non-primate, hoofed species, amongst the mammals. This could indicate that cathelicidin AMPs have undergone natural selection in accordance with the habitat/ecological niche and species-specific needs to defend against microbes. All the porcine Caths are clustered together in a single clad, which suggests that the cathelicidin genes of porcine origin have evolved through independent rounds of duplications and subsequent diversification after the separation of Suidae and Bovidae families. The cathelicidin types or variants belonging to the same species presented high bootstrapping values (>70%), indicating higher consistency of the given data and taxonomical bipartitioning. 30

Phylogenetic tree constructed from the cathelicidin peptide sequences, using maximum likelihood with 1,000 bootstrap resampling. The subtree within the box depicts the evolutionary relatedness of caths among land and marine mammals.
Estimation of evolutionary divergence
The departure of the ovine Cath1 and Cath2 cds was compared with the cds of cathelicidin variants belonging to different species, with respect to certain parameters. The evolutionary divergence estimates 31 among ruminant species such as Ovis aries (sheep), Bos taurus (Cattle), Capra hircus (Goat), Bubalus bubalis (buffalo), Bos mutus (Yak), and Pantholops hodgsonii (Tibetian wild antelope) ranged from 0.000 to 0.365. The maximum evolutionary divergence was observed between the Caths of Phasianus colchicus (common pheasant) and that of the ruminant species (dark red cells in heatmap, Fig. 3), while the least divergent homologues were the cathelicidins belonging to same families but different species (dark blue). The sample dendrogram along with heatmap of the evolutionary divergence values (Fig. 4) among the cathelicidin peptides of the ruminant species enables clear visualization of the evolutionary divergence. Here, the rainbow color along the left and top of the sample dendrogram helps to associate the names of the gene/transcript variants of the ruminant species with the corresponding node of the sample dendrogram, row-wise versus column-wise. The ovine Cath1 and Cath2 (named in the figure as NewCath1 Oae and New Cath2 Oae, respectively) have clustered in two different major clads of the dendrogram (Fig. 4). The color variation in this heatmap (Fig. 4) is only qualitative and does not represent the actual values of evolutionary divergence.

Evolutionary divergence heatmap. Relative distance among the transcript variants of the ruminant species.
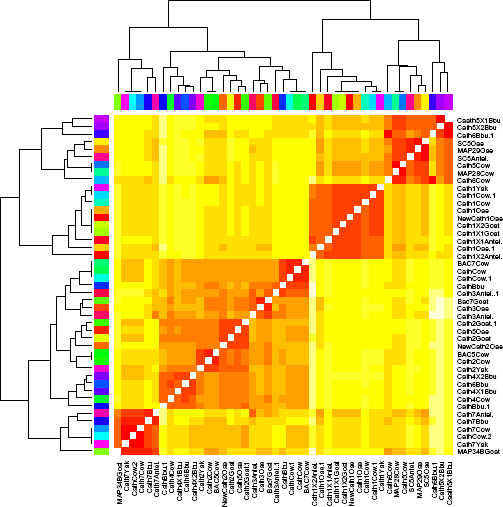
Sample dendrogram and evolutionary divergence heatmap of the ruminant specific cathelicidin peptide sequences.
Homogeneity of substitution patterns between sequences
The discrepancy in evolutionary patterns for the divergent cathelicidin cds was estimated by disparity index, with the assumption of homogeneity (same pattern of base substitution) of the evolutionary process. 20 The null hypothesis of same prototype of substitution pattern among the cathelicidin cds was rejected for many of the sequence pairs, either closely related ruminant species (ie, sheep and goat) or distantly related (ie, some rodents and aves) from the sheep cathelicidins (based on the sequence divergence estimation). Different cathelicidin types in cattle and non-ruminant species (ie, swine and equines species) have shown significant disparity during evolution, indicating that the substitution pattern varied among species with respect to that of sheep. This implies that the branching pattern obtained in the phylogenetic tree could be misleading, as the assumption of homogeneity of substitution pattern has not been met. To address this question, the coding sequence data of 19 cathelicidin sequences (belonging to different cathelicidin types of ruminants and one representative cathelicidin sequence from some non-ruminant species) were subjected to “branch-site REL analysis” (BSR) 25 in Datamonkey online server (http://www.datamonkey.org/). 23
Estimation of selection pressure site by site
The test statistic “dN-dS” determines the type of selection pressure (due to positive, negative, or neutral selection) over individual codon. SLAC, which is the fastest and most conservative method (out of the six methods available in Datamonkey server) to test selection at a single codon by comparing site-by-site selection, 24 detected three positively selected codon sites (162, 165, and 202). In Figure 5, we have comparatively plotted the test statistic (dN-dS) against the codon positions obtained from the analyses using SLAC and REL. The REL method, which is the most powerful and the least conservative out of SLAC, FEL, and REL, detected no positively selected sites and 20 negatively selected codons as compared to SLAC. REL is a stringent test that declares types of either positive or negative selection of codons. The fixed effects likelihood (FEL) and internal branch FEL (IFEL) methods identified 8 and 10 positively selected sites, respectively. It is evident from the Figure 5 that positive and negative selection pressures have acted over different domains of cathelicidin peptides. Singh et al. 32 have recently reported evolutionary analyses of similar kind for bubaline Dicer1 cds, where the REL method was found to identify more number of sites experiencing selection positive or negative pressure. The branch-site REL (BSR) analysis analyzes the episodic diversifying selection of divergent homologous coding sequences. In this analysis, in total five branches (or nodes) could be detected (P < 0.05) to undergo episodic diversifying selection. This test estimates the ratio (ω) between nonsynonymous (β) to synonymous (α) substitution rates along a lineage of interest, as a measure of selective pressure.
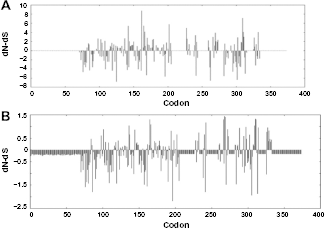
Plot for the value of test statistic (dN-dS) against the codon positions obtained from the analyses, ie, single likelihood ancestor counting [SLAC: (A)] and random effects likelihood [REL (B)].
The results indicate that almost all the positively selected sites are positioned in the highly variable AMP region of the cathelicidin. This also indicates that the various cathelicidin variants/types that persist in the species under study have some specific role in conferring immunity and thereby fitness of the organism. Similarly, in sheep, a very limited number of cathelicidin types have been experimentally reported.
Comparative protein structure analysis
The secondary structure of ovine Cath2 showed four β-pleated sheets, two α helices, and several loop structures some of which formed interconnecting links, while the Cath1 protein showed five β-pleated sheets, three α helices, and several loop structures (Supplementary Fig. 2). Cath1 and Cath2 differed in terms of hydrophobicity and antigenicity. Cath1 has more positive hydrophobicity at the N-terminal as compared to Cath2, while the antigenic index of Cath2 has positive antigenic index at the N-terminal region as compared to Cath1 (Fig. 6). This indicates thatCath2 could be more immunogenic than Cath1. The 3D protein structure showed the α- helix, β-strand, and loop structures (Supplementary Fig. 3). The 3D structures of the two variants of ovine Caths differed at the AMP domain. Ramachandran's plot of Cath1 and 2 predicted structures revealed that 96.1% and 93.1% of the residues, respectively, were in favored region (Supplementary Fig. 4). It can be concluded from the present structure analyses that the cathelicidin variants differ in sequence (at the N-terminus), in secondary structure, and perhaps in function. Evolution of the Cath variants has been specific to the type of microbial defense.
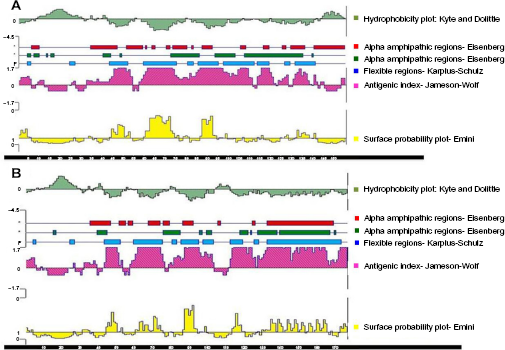
Graphical representation of the salient features (hydrophobicity, antigenic index, surface probability, etc) of the ovine Cath1 (A) and Oath2 (B) peptides, using Protean tool of DNAStar (Lasergene) software.
Conclusion
Evolutionary analysis of different types and transcript variants of cathelicidin from divergent species showed that the variants of cathelicidin among different animal species have evolved due to positive selection pressure. Avian cathelicidins/fowlicidins have evolved independently (purifying selection) and are very divergent from that of mammalian cathelicidins. Selection pressure varies with codons versus the domains of cathelicidin peptides. Structural differences between the Cath1 and 2 peptides of Indian sheep were observed. Further studies on protein–ligand docking are warranted to understand the evolutionary aspects of the cathelicidin variants against specific microbe-associated molecular patterns (MAMP).
Author Contributions
Conceived and designed the experiments: JSA. Analyzed the data: CSM. Did bench work and wrote the first draft of the manuscript: KKD. Contributed to the writing of the manuscript: PPD. Agree with manuscript results and conclusions: KKD, JSA, CSM, PPD. Jointly developed the structure and arguments for the paper: KKD, JSA, CSM, PPD. Made critical revisions and approved final version: JSA, CSM. All authors reviewed and approved of the final manuscript.
Supplementary Materials
Supplementary Figure 1
Pipeline of the experimental methods demonstrating the tools and software used in the present study.
Supplementary Figure 2
Secondary structure prediction of ovine Cath2 (left) and Cath1 (right) using Psipred v3.0.
Supplementary Figure 3
Predicted tertiary structure of ovine Cath2 and Cath1 peptides, using RaptorX online server.
Supplementary Figure 4
Ramachandran's Plot of predicted tertiary structures of cathelicidins (Cath1 and Cath2) of Indian sheep, using RAMPAGE.
Supplementary File 1
Alignment data for pairwise sequence alignment of the ovine cathelicidins (Cath2 and Cath1) as well as multiple sequence alignment of all the 85 complete cathelicidin peptide sequences.
Supplementary File 2
Phylogenetic tree file, AA ML Non-Compressed Tree1, opens in MEGA6.
Supplementary File 3
Evolutionary divergence matrix data.
Supplementary File 4
R Codes for evolutionary analysis data.
Footnotes
Acknowledgments
The facilities provided by the School of Animal Biotechnology, GADVASU, Ludhiana, are sincerely acknowledged. The authors thank Dr Nikhlesh Singh, Assistant Professor, Department of Physiology, University of Tennessee, Knoxville, Tennessee, USA, Prof. G. S. Brah, Adjunct Professor and Ex-Director, and Dr. R. K. Chaudhary, Assistant Scientist, School of Animal Biotechnology, GADVASU, for critically reviewing the manuscript for English editing.