
Abstract
The concept of conservation of amino acids is widely used to identify important alignment positions of orthologs. The assumption is that important amino acid residues will be conserved in the protein family during the evolutionary process. For paralog alignment, on the other hand, the opposite concept can be used to identify residues that are responsible for specificity. Assuming that the function-specific or ligand-specific residue positions will have higher diversity since they are under evolutionary pressure to fit the target specificity, these function-specific or ligand-specific residues positions will have a lower degree of conservation than other positions in a highly conserved paralog alignment. This study assessed the ability of reverse conservation analysis to identify function-specific and ligand-specific residue positions in closely related paralog.
Reverse conservation analysis of paralog alignments successfully identified all six previously reported substrate recognition sites (SRSs) in cytochrome P450 family 2 (CYP 2). Further analysis of each subfamily identified the specificity-determining residues (SDRs) that have been experimentally found. New potential SDRs were also predicted and await confirmation by further experiments or modeling calculations. This concept may be also applied to identify SDRs in other protein families.
Introduction
Found in all forms of living organisms, the cytochrome P450 superfamily of hemo-thiolate enzymes are involved in the metabolism of a wide variety of both exogenous and endogenous compounds. In human P450s are key enzymes for metabolizing most drugs and foreign compounds. In fact, over 200,000 chemicals are believed metabolized by P450s. Hence, P450 is of great interest to pharmacologists and toxicologists (Lewis, 1996; Lewis, 2001; Omura et al. 1993; Ortiz de Montellano, 1995).
Identification of the specificity-determining residues (SDRs) of P450s is critical for elucidating the mechanism of substrate/ligand recognition and has immediate and substantial impact on drug design and protein engineering for the P450 proteins. Traditionally, the degree of conservation is used to predict important residues; this concept is widely accepted and has been successfully applied to many systems (Ng and Henikoff, 2003; Sunyaev et al. 2001). However, this approach is not applicable to prediction of SDRs, because the degree of conservation of SDRs is often very low.
The SDRs of each member of the P450 superfamily remain poorly characterized and much effort has been made to accelerate their identification. The concept of substrate recognition sites (SRSs) introduced by Gotoh (Gotoh, 1992) for the P450 2 family (CYP 2) was based on the alignment of mammalian P450s and the structure of a bacterial enzyme, P450cam. The SRS concept has provided an excellent guideline for understanding the basis of P450 specificity and has been used to identify a number of key SDRs in various mammalian P450s have been determined (Wachenfeldt and Johnson, 1995).
Substantial progress has been made in the use of experimental structure information and computation models to better understand specificity (Cruciani et al. 2005; Lewis et al. 1999; Szklarz and Halpert, 1998). Nevertheless, before thorough understanding of 3-D structures of P450s at the atomic level is available, methods are needed to predict the SDRs using sequence alignments or other bioinformatics techniques. Evolutionary analysis—predicting SDRs from the evolutionary history derived from a phylogenetic tree of a given protein family—has been widely used for this purpose (Armon et al. 2001; Landgraf et al. 1999; Lichtarge et al. 1996; Lichtarge and Sowa, 2002; Lichtarge et al. 1997; Madabushi et al. 2002; Sjolander, 1998). Conservation analysis of both paralogs and orthologs has been used to identify the SDRs in bacterial transcription factors (Mirny and Gelfand, 2002). Structural information has been also incorporated into SDR predictions. Yu et al. (Yu et al. 2005) reported a surface patch ranking (SPR) method, which assumes different mutation rates for surface and core residues and uses the evolutionary trace concept to derive the SDRs.
Methods based on conservation analysis or phylogenetic tree information make the basic assumption that the SDRs undergo necessary mutations to compensate for the specificity needed; hence, the residues conserved across the protein family can be distinguished from those conserved only within subfamilies. In such analysis, if a subfamily contains only a single sequence, the conservation of the subfamily is difficult to measure. If the assumption that SDRs have different mutation rates within and outside their subfamilies is true, a fundamentally different view can be employed to identify the SDRs: Since SDRs are under evolutionary pressure to fit the necessary specificity, they may tend to have greater diversity than other positions, especially for paralog sequences. This means that SDRs may have a lower degree of conservation than other positions in a paralog alignment with high similarity. This statement assumes that the degree of evolutionary diversity of non-SDR residues is much less than that of SDR positions, an assumption that is not applicable to distant ortholog sequences.
In this study, the above concept of “reverse conservation analysis” was applied to identify SRSs and SDRs of CYP 2 enzymes. The same concept was then applied to subfamilies of CYP 2, in which both experimentally proven and novel SDRs were identified.
Theory and Implementation
The concept that the degree of conservation varies in different regions is illustrated in Figure 1. In Case A, which is an alignment consisting of remote orthologs with the same function, a very low degree of conservation is observed for all but functionally important residue positions. In the case of closely related paralog sequences (Case B), a very high degree of conservation is expected for all positions, since the sequence similarity is very high. The SDRs, which must undergo necessary mutations, would have a lower degree of conservation. In Case C, a family of similar proteins with a common function but different specificity is demonstrated. In such cases, e.g. the P450 family, functionally important positions will have a higher degree of conservation whereas SDRs will have a lower degree of conservation. Hence, different strategies should be used for different cases to identify the functionally important residues and SDRs, rather than the currently widely-accepted concept in which only highly conserved residues are thought to be important. When traditional conservation analysis is applied, Case A is usually assumed and much information could be lost.

Different degrees of conservation for different cases: A) distant orthologs with the same function or specificity; B) closely related paralogs with different functions or specificities; C) closely related paralogs in a family, with a common function but different specificities (e.g. P450). The down peaks in A correspond to the totally conserved and hence functionally important residue positions. The peaks in B correspond to specificity-determining residues (SDRs). Peaks in C have the same meaning as in A and B. Higher (upward) peaks indicate lower degrees of conservation (higher degrees of diversity). The figure is for illustration of the concept, and arbitrary scales are used.
We assume that the degree of conservation of the CYP 2 family is as in Case C. We used the Rate4Site (Version 2.01) program developed by the Pupko laboratory (Mayrose et al. 2004; Pupko et al. 2002) to calculate the degree of conservation using the empirical Bayesian method. The 
All calculations were performed on a Dell D600 notebook computer with a 1.7GHz Pentium-M CPU and 2 GB RAM. The Rate4Site (Version 2.01) program was downloaded from the www site: http://www.tau.ac.il/≈itaymay/cp/rate4site.html.
The CYP 2 sequences were retrieved from Prof. David Nelson's P450 site at the University of Tennessee (http://drnelson.utmem.edu/CytochromeP450.html). Sixty-nine sequences from 2A, 2B, 2C, and 2D subfamilies were included and the alignment is provided as supplemental information. The numbering system of CYP 2C5 (rabbit) is used throughout the paper.
Results
Peak identification
A peak in an arbitrary data set can be defined when its intensity 
where
Figure 2 shows the
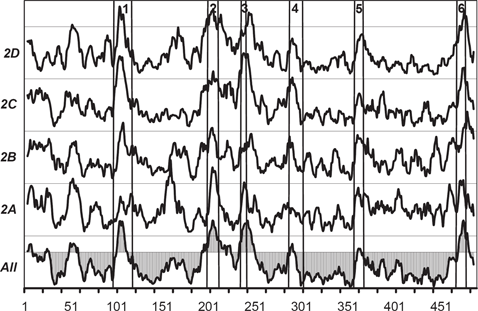
The
CYP 2A subfamily
The CYP 2A subfamily has a
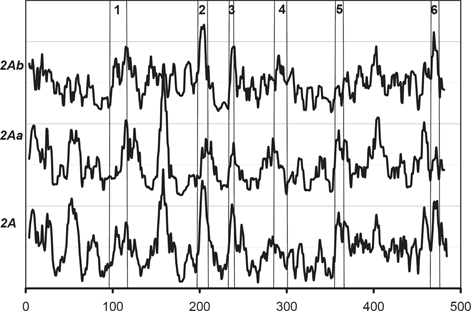
The
As seen in Figure 3, the high

The
The residues corresponding to these
CYP 2B subfamily
The same type of analysis was performed on the CYP 2B subfamily (Fig. 5 and Fig. 6). The 2Ba subgroup has at least 84% identity within the group and contains CYP 2B1 (rat), CYP 2B2 (rat), CYP 2BA (mouse), and CYP 2BK (mouse). Figure 5 clearly shows a case similar to Case B in Figure 1. Figure 6 shows the individual
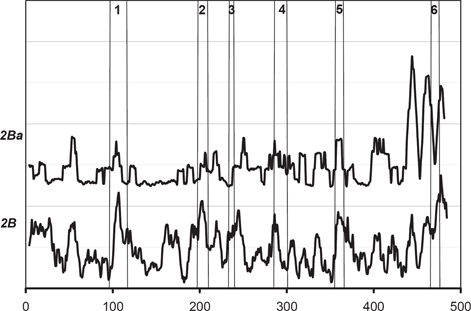
The

The
The
CYP 2C subfamily
The
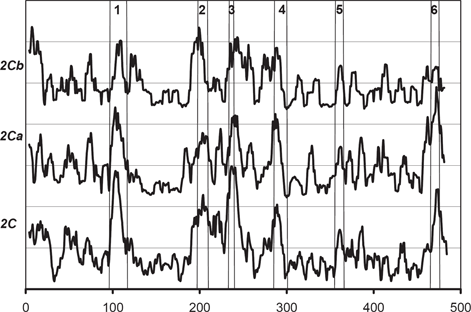
The

The
Niwa et al. found that residues 289, 292, and 328 of CYP 2C9 are essential for the recognition of substrate in CYP 2C9 (Niwa et al. 2002). Kerdpin et al. showed the possible contribution from residues 362, 359, 362 and 363 (Kerdpin et al. 2004). All of these residues clearly correspond to the
CYP 2D subfamily
The

The
CYP 2 family
A
Discussion
The results from the CYP 2 subfamily indicate that the concept of reverse conservation analysis works well for identification of SRSs and SDRs. All SRSs were identified and several experimentally reported SDRs were well aligned with
The concept of reverse conservation analysis assumes that the SDRs are under evolutionary pressure and therefore have a lower degree of conservation than other residue positions. Therefore, other factors that could cause a lower degree of conservation should be also considered before a conclusive identification is made. One example is that the surface and core residues normally are considered to have different rates of mutation (Yu et al. 2005). In addition, the correlation of mutation rates between intra-protein residues and residues at the protein-protein interface (Pazos et al. 1997; Sjolander, 1998) should be taken into account, although this is very difficult with alignment-based methods.
As Yu et al. (Yu et al. 2005) pointed out, mutation of SDRs most likely is cooperative among a group of spatially neighboring residues. The analysis here did not consider such cooperative relationships among the SDRs, although a possible case is observed in the CYP 2A subfamily, where D154, L156, G158, G160, N163, and K190 could be a group of residues that cooperatively specify the substrate at the entrance.
Although reverse conservation analysis can detect SDRs by identifying residues with relatively low degrees of conservation, residues with high degrees of conservation cannot be judged as non-SDRs or unimportant. These residues could be functionally important or could play a role in specifying the substrate in one subgroup but not in others. For example, a residue position could be responsible for specifying the substrate for the whole CYP 2 family and thus could be totally conserved in CYP 2, but might have a very low degree of conservation in the P450 superfamily. The different patterns of
Reverse conservation analysis should be only applied to alignments with highly similar paralogs. P450 is ideal since it has many similar sequences with different substrate specificities. Even though the CYP 2 sequences used in this paper are from different species, they can be treated as at least “pseudo-paralogs,” since their identity is very high and these sequences are thought to have evolved from the same ancestor (Lewis, 1996; Lewis et al. 1999). The method may be also applied to other systems with such characteristics, such as the kinase superfamily and families. However, as the results of Reverse conservation analysis are highly dependent on the sequences/alignments chosen, one should be careful when choosing alignment and explaining the results. For example, as shown in Figure 5, the result of Reverse conservation analysis on CYP 2B family loses almost all SRS regions as it is understandable in that those SRS regions are conserved within the CYP 2B family.
Most of methods to predict the effects of mutations are based on the degree of conservation (Ng and Henikoff, 2003; Sunyaev et al. 2001; Tchernitchko et al. 2004). They likely will give false-negative results for SDRs, especially when a set of paralog sequences are used. Reverse conservation analysis could be a complementary tool for these mutation prediction methods.
In conclusion, this study proposed conservation analysis in a reverse way and applied this concept to the P450 family 2 (CYP 2). The results of experimentally identified SDRs agree surprisingly well with the peaks of
Footnotes
Acknowledgements
The author thanks Dr. Steven J. Potts of Quest Diagnostics Nichols Institute for helpful discussion and comments on the manuscript and Prof. Wei Wang of UCSD for the visiting scholar opportunity and access to the research resources of UCSD.