
Abstract
Models of protein evolution tend to ignore functional constraints, although structural constraints are sometimes incorporated. Here we propose a probabilistic framework for codon substitution that evaluates joint effects of relative solvent accessibility (RSA), a structural constraint; and gene expression, a functional constraint. First, we explore the relationship between RSA and codon usage at the genomic scale as well as at the individual gene scale. Motivated by these results, we construct our framework by determining how probable is an amino acid, given RSA and gene expression, and then evaluating the relative probability of observing a codon compared to other synonymous codons. We come to the biologically plausible conclusion that both RSA and gene expression are related to amino acid frequencies, but, among synonymous codons, the relative probability of a particular codon is more closely related to gene expression than RSA. To illustrate the potential applications of our framework, we propose a new codon substitution model. Using this model, we obtain estimates of 27N s, the product of effective population size N, and relative fitness difference of allele s. For a training data set consisting of human proteins with known structures and expression data, 2N s is estimated separately for synonymous and nonsynonymous substitutions in each protein. We then contrast the patterns of synonymous and nonsynonymous 2N s estimates across proteins while also taking gene expression levels of the proteins into account. We conclude that our 2N s estimates are too concentrated around 0, and we discuss potential explanations for this lack of variability.
Keywords
Introduction
Proteins perform a vast array of functions within living organisms. As a result, natural selection affects both the structure of proteins and the regulation of their production. A major source of structural constraints arises because proteins require a stable and suitable three-dimensional structure to function. Mutations that destabilize proteins will be selected against. 1 Also, selective constraints in a protein vary according to structural locations. For example, Franzosa and Xia 2 found a strong, positive, and linear relationship between the ratio of nonsynonymous and synonymous rates and a measure of solvent exposure at the structural location. While structural constraints have mainly been investigated to explain nonsynonymous rate variation within proteins, functional constraints have been shown to explain a large amount of the variation in average nonsynonymous rate among proteins.3–5 For example, Drummond et al. 4 showed that expression level explains roughly half the variation in average nonsynonymous rate among Saccharomyces cerevisiae protein-coding genes.
To reflect structural constraints when modeling protein evolution, the pioneering simulation work of Parisi and Echave 6 had a statistical potential to govern the amino acid replacement process. A similar approach was adopted by later inferential studies.7–10 Statistical potentials can include terms related to solvent accessibility, pairwise distance interactions, torsion angles, and flexibility of the residues. 11
Structurally constrained evolutionary models have tended to place less emphasis on codon usage. The assumption that synonymous mutations are selectively neutral has often been made.7,8,10 This may be a reasonable first assumption, because so much natural selection depends on the protein sequence. However, synonymous change is also affected by natural selection. For example, Agashe et al. 12 found that synonymous mutations to a key-enzyme coding gene can decrease gene expression and fitness by more than 90% compared to wild type. Also, selection acting on gene expression was found to be the single dominant predictor, among all predictors considered, of the number of nonsynonymous substitutions per site in yeast. 4
To explain the negative correlations between rates of coding sequence evolution and gene expression levels that have been inferred across a wide range of taxa, Drummond and Wilke 13 suggested that mistranslation-induced protein misfolding explains much of coding sequence evolution. Another study discovered that translationally optimal codons are associated with structurally sensitive sites. 14 These findings indicate that structural and functional constraints are coupled. While protein structures are increasingly considered in protein evolution models, less attention has been paid to the combined effect of gene expression and protein structure.
The overall codon usage in a genome can be dramatically different between species. 15 Chen et al. 16 concluded that different patterns of codon usage between species are determined primarily by mutational processes that act throughout the genome and only secondarily by selective forces acting on protein-coding sequences. From a selectionist point of view, a classic explanation for systematic variation across a genome is that certain preferred codons are translated more accurately and/or efficiently.17–19 Strong evidence for this hypothesis has been found in several species.20–24 However, 30% of bacterial species show no evidence of translational selection. 25 Understanding codon usage patterns continues to be an active area of research.
Relative solvent accessibility (RSA) is a summary of local structural environment at a protein location that aims to quantify the relative exposure of an amino acid in a globular protein to water molecules. It has been a widely used summary that is correlated with rates and patterns of protein evolution. 2 Here, we attempt to characterize the roles played by RSA and gene expression in modeling protein evolution. We propose a probabilistic framework aiming to combine effects of RSA and gene expression on amino acid usage as well as codon usage. We carry out hypothesis testing in order to address whether RSA tendencies vary among synonymous codons. To capture potentially species-specific association between RSA and codon usage, the testing procedure is conducted at the genomic scale as well as at the individual gene scale in two different species (Mus musculus and Homo sapiens). We assess the effects of gene expression on synonymous codon usage and the combined effects of RSA and gene expression in influencing amino acid usage. We do this via a multinomial logistic regression (MLR) approach that connects RSA and gene expression to evolution using correlation rather than causality. To demonstrate possible applications of our probabilistic framework, we propose a new protein evolutionary model that accounts for both the structural and functional contexts of a codon. Our model has a mutation-selection balance framework that incorporates the selective impacts of possible synonymous and nonsynonymous mutations on human protein-coding genes. The selective impacts of these mutations are assessed by our estimates of scaled selection coefficients (ie, twice the product of effective population size N and the relative fitness difference s between the mutant and wild-type allele).
Materials and Methods
Structural, sequence, and expression data
We collected protein structures, amino acid sequences, nucleotide sequences, and protein-coding gene expression data for two species, H. sapiens and M. musculus. Protein structures were obtained from the Protein Data Bank (PDB). 26 Only structures determined by X-ray crystallography with a resolution of 3.0 å or better were employed. In addition, proteins were required to have lengths greater than 50 amino acids. In an effort to collect a relatively homogeneous data set to which a single model applies, we restrict our data to monomeric proteins with one chain. Also for the purposes of gathering a relatively homogeneous data set, membrane proteins and protein–DNA/RNA hybrid structures were excluded. To lessen problems arising from estimating parameters when proteins are correlated because of common ancestry, homologs were removed from our data by employing a 30% identity filter. Gene expression measurements were not used to determine which homologs were included or excluded.
Because the Consensus CDS (CCDS) database 27 stores a core set of human and mouse protein-coding regions that are associated with highly reliable annotation, it was used to identify nucleotide sequences that encode the proteins selected from PDB. To get CCDS IDs, protein PDB IDs were translated to the UniProt Knowledgebase (UniProtKB) IDs. The UniProt IDs were then mapped to Gene IDs. Finally, Gene IDs were converted to CCDS IDs. Proteins with CCDS IDs that could not be successfully identified were removed.
To match a protein in PDB with its corresponding protein-coding nucleotide sequence, we used the Smith-Waterman algorithm 28 of the water program from the EMBOSS tools. 29 This let us identify the longest ungapped region with an exact match between the nucleotide sequence and amino acid sequence. This process yielded 864 and 156 matches in H. sapiens and M. musculus, respectively (see PDB IDs in Supplementary files). For each site in the ungapped region in each protein structure, relative solvent accessibility (RSA) was calculated by the NACCESS software. 30 The presence of heteroatoms in some structures was ignored when calculating accessibilities.
RNA-seq data for H. sapiens and M. musculus were collected as part of a multi-species multi-organ gene expression study 31 and were downloaded from the Expression Atlas data-base. 32 To establish one-to-one mapping between the PDB ID of a protein and the Ensembl ID of a transcript, PDB IDs were translated to the UniProtKB IDs and then the UniProt IDs were mapped to Ensembl IDs via the ID mapping service hosted by the Protein Information Resource. 33 Following a previous study by Drummond and Wilke, 13 aggregate mRNA level was quantified as the geometric mean signal of the measurements from the six tissues in the Brawand et al data set. We log-transformed these geometric means in the following analysis. There are 241 human proteins and 60 mouse proteins in our data set that have both structure and gene expression information available.
A probabilistic framework for assessing the joint effect of RSA and gene expression on amino acid and codon usage
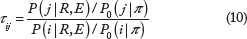
Our probabilistic framework is based on the idea that the propensity of a codon representing a given site of a protein can be predicted by a two-step process: First, estimate the probability of the corresponding amino acid by the observed frequency of that amino acid at similar structural and functional contexts in other proteins. Second, predict the relative probability of observing a codon conditional upon the amino acid, the structural context, and the functional context. For a codon C of a protein sequence, let A be the amino acid encoded by this codon. Here, R is the RSA at the site and represents the structural context, while E is the expression level of the gene and represents the functional context. The probability of obtaining C conditional upon the context is then

Testing association between codon usage and RSA
Codon usage is correlated with gene expression. 19 Furthermore, amino acid usage is RSA dependent2,34,35 and also influenced by gene expression.36,37 Zhou et al. 14 tested the association between codon optimality and solvent accessibility. Instead of focusing on codon optimality that primarily reflects the influence of selection for translation speed and/or accuracy on codon usage, we test a slightly more general null hypothesis that, conditional upon the amino acid, codon usage is independent of RSA.
To do this, a k-sample Anderson-Darling (A-D) test 38 was applied to compare RSA distributions of different synonymous codons encoding an amino acid. Here, k equals the number of synonymous codons. For example, k = 6 if a test is conducted for serine. The A-D test is nonparametric and distribution free. To get the null distributions of A-D test statistics, we permuted RSA values among codons that specify the same amino acid type. By doing this, the association between amino acid usage and structural environments was not affected, but any association between codon usage and structural environments was eliminated. For each test, 10,000 simulated A-D test statistics were generated via this sort of permutation. The actual computation was done with the ad.test function in the R package kSamples. 38
We can test whether RSA distributions of synonymous codons are different either at the genomic scale or at the individual gene scale. At the genomic scale, for each of the 18 amino acids that have more than one codon, a k-sample A-D test was conducted. Positions in all genes that have the same amino acid type were pooled together, and RSA values were permuted among these positions. In each test, the null distribution was formed by the 10,000 simulated A-D test statistics. To get the P-value, the test statistic computed from observed data is compared to the null distribution, and the proportion of the null distribution that exceeds the observed test statistic value is recorded. At the genomic scale, we have the power to detect even slight violations of the null hypothesis. A disadvantage of the genomic-level test is that permuted data sets do not retain the same codon usage patterns as the actual data. This means that association between codon usage and gene expression is disrupted in the permuted data sets.
When the hypothesis was tested at the gene scale, the resampling procedure only allows RSA values belonging to positions that have the same amino acid type to be permuted within a gene. Therefore, permuted data sets do not disrupt association between codon usage and gene expression because permuted genes retain the same codon usage for each gene as found in actual data. Under this restriction, 18 × 864 and 18 × 156 null distributions were generated, since we have 864 human proteins and 156 mouse proteins. To perform a single test of association between codon usage and RSA within each amino acid type, normalized test statistics (z-scores) were obtained for the amino acid type in each gene by subtracting the sample mean of the individual k-sample A-D test statistics for each combination of gene and amino acid type and then dividing the differences by the sample standard deviation. For each amino acid type, the 10,000 × 864 and 10,000 × 156 z-scores were summed across proteins so that 10,000 sum-of-z-scores (the combined null distribution) were obtained in human and in mouse. Finally, we compute P-values by comparing the observed sum-of-z-score for an amino acid with the corresponding null distribution. Although testing at the gene scale allows gene-specific codon bias to be removed, there is less power to reject the null hypothesis at the individual gene scale because each gene has a comparatively small number of codons for each amino acid.
Clustering amino acids according to RSA preference
The RSA of an amino acid residue in a protein is affected by tertiary structure of the protein, apart from the amino acid's physicochemical properties.
39
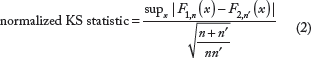
Before we proceed to quantitative modeling, we would like to find out how interchangeable two amino acids are in terms of RSA distribution and whether amino acids can be grouped together by their RSA distribution similarities. The two-sample Kolmogorov-Smirnov (KS) test is one of the most useful and general nonparametric methods for comparing two samples. In other contexts,40–42 the KS test statistic has been used to define distances for the purpose of hierarchical clustering. Borrowing the idea from hypothesis testing, we define the distance between a pair of amino acids by the normalized two-sample KS test statistic (Equation 2) when contrasting their RSA distributions. We let n and n′ be sample sizes for each amino acid type, and we obtain a test statistic:
Logistic regression (LR)
If there is no significant association between codon usage and RSA, we can make the following simplification to Equation 1:

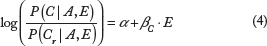
Since we are interested in understanding how gene expression (a predictor variable) affects probabilities of amino acid types (a categorical outcome variable), LR (in cases where there are exactly two synonymous codons) and MLR can be employed. The most frequent codon in each synonymous group is denoted as Cr, and the probability of any other synonymous codon C is modeled relative to it:
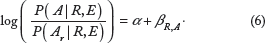
To measure the joint effect of RSA and gene expression on amino acid usage quantitatively, we use both gene expression and RSA as independent variables and build a model similar to the one in Equation 4, but this time the probabilities are relative to A
r
, the reference amino acid:


A functionally and structurally constrained Markov model of codon substitution
Using the probabilistic framework that we have constructed, we develop a model of protein-coding DNA sequence evolution that explicitly accounts for structural and functional constraints.
The rate of change from codon i to codon j is denoted by qij. Our mutation-selection balance parameterization has each substitution rate be proportional to the mutation rate from i to j multiplied by the probability that a new mutation becomes fixed. We denote π
n
as the stationary probability of nucleotide type k (k ∊ {A, C, G, T}) in the absence of natural selection and use π as the vector representing the four nucleotide frequencies. Let κ be the transition-transversion rate ratio. Assume a diploid population of effective size N individuals, and let P(Zij) be the probability that a new mutant allele j eventually gets fixed in the population that otherwise consists of 2N – 1 alleles of type i. We set q
ij
to 0 if i or j is a stop codon, or i and j differ by more than one nucleotide. When i and j differ by exactly a single codon position and codon j has nucleotide type h at this position, our model specifies the substitution rate q
ij
from codon i to codon j as

Following Choi et al. 44 , we design our evolutionary model to have a stationary distribution that matches a desired target probability distribution. In this case, we have our evolutionary model yield a stationary distribution that is identical to the probability distribution of codons that we estimated via MLR from solvent accessibility and gene expression data of human proteins. Accordingly, we set P(i|R, E) as the stationary probability for codon i. It can be calculated using Equations 1, 4, and 5.
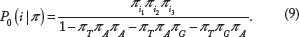
Let P0(i|π) be the probability of codon i under a model where stop codons are lethal, but all other codons are equally fit. Adjusting for the three stop codons in the universal genetic code,

We set the relative fitnesses of i and j, respectively, as 1 and 1 + s. For an effective population of size N diploid individuals with multiplicative fitnesses, the scaled selection coefficient S = 2N s can be assessed by Refs. 44–46:

To get reliable estimates of coefficients for MLRs in Equations 4 and 5, a sufficient number of proteins with both PDB structure and RNA-Seq data are required. Owing to insufficient multi-organ RNA-seq data from mouse, we conducted the LR and trained the evolutionary model only for humans. For this analysis, we use nucleotide frequencies observed in the human genome (41% GC base pairs and 59% AT base pairs according to International Human Genome Sequencing 47 ) as estimates of π. This way of estimating π stems from the fact that the majority of the human genome consists of DNA with no known biological function and that is putatively evolving without much impact from natural selection. We therefore set π A = π T = 0.59/2 = 0.295 and π C = π G = 0.41/2 = 0.205. This treatment could be improved by allowing π to vary among genes to account for regional genomic differences in mutation patterns, but it is not pursued in this study.
Results
After using the Benjamini–Hochberg (BH) method 48 to control for false discovery rate, no synonymous codon group in mouse was found to exhibit a significant correlation between codon usage and RSA. In contrast, 15 out of 18 synonymous codon groups in human were statistically significant (Table 1). For humans, the null hypothesis cannot be rejected in synonymous codon groups belonging to cysteine (C), phenylalanine (F), and histidine (H).
Test at genomic scale of whether RSA tendencies vary among synonymous codons.

When the same hypothesis was tested at the individual gene level, the P-value results can be found in Table 2. After applying the BH method, no synonymous codon group was found to be statistically significant in either human or mouse, although P-values in human are consistently smaller than those in mouse.
Test at individual gene scale of whether RSA tendencies vary among synonymous codons.

Figure 1 shows the hierarchical clustering result of the amino acid distance matrix computed for combined human data. As would be expected, if natural selection is associated with solvent accessibility, the hierarchical clustering suggests that RSA tendencies of amino acids in naturally occurring proteins are correlated with the physicochemical properties of these amino acids. On the whole, the 20 amino acids are naturally separated into two groups. The first group contains mainly hydrophobic amino acids (C, M, W, A, Y, F, V, I, L) and the second group contains the other amino acids (D, Q, R, P, N, T, H, G, S, K, E). According to the dendrogram, there are a few smaller and tighter clusters within each group. For example, in the first group, amino acids L, I, V, and F have more similar RSA preference than other amino acids in this group. In the second group, the cluster that contains amino acids K and E shows strong distinct signal, while two other clusters (one formed by T, H, G, S and the other formed by D, Q, R, P, N) are also present.

Distance matrix for amino acids using combined human data. Distance between two amino acid types is defined by the normalized KS test statistics (Equation 2). The complete-linkage method was used to perform hierarchical clustering.
As explained in the Materials and Methods section, we also constructed another distance matrix using data stratified by each gene. We computed one distance matrix for each protein in our data set and then calculated the average values for each cell in the distance matrix across all proteins. The resulting distance matrix is shown in Figure 2. The same clustering pattern was found as in Figure 1, although the signal is weaker because of the much smaller sample sizes in individual protein-coding genes.

Distance matrix for amino acids using stratified human data. Distance between two amino acid types is defined by the normalized Ks test statistics (Equation 2). The complete-linkage method was used to perform hierarchical clustering. Entries in the matrix are computed by taking the average of the distances between amino acids among all proteins.
MLR results
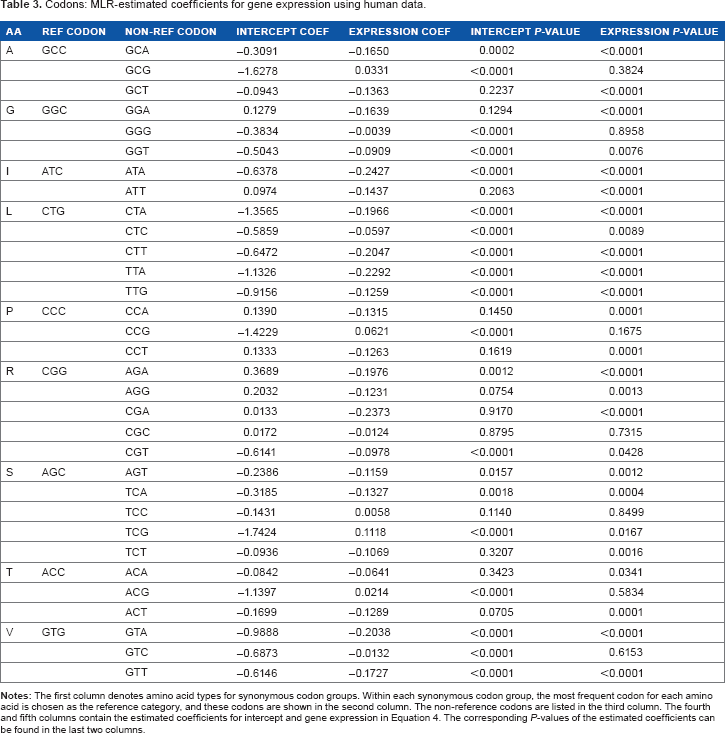
Using human data, the estimated coefficients of MLR models for synonymous codon groups with more than two codons are shown in Table 3. For groups with exactly two synonymous codons, estimated coefficients of LR models are in Table 4. The estimates of the slope parameter for log-scaled gene expression are all negative for LR models, and they are all statistically significant. Across all MLR models, 24 out of 32 slope estimates for gene expression are negative and statistically significant, while only one coefficient belonging to codon TCG in amino acid serine is positive and significant. Since we define the most frequent (also called preferred) codon to be the reference category in both MLR and LR cases, these estimates coincide with findings from earlier studies21,24,49 that the probability of observing the most frequent codon increases when gene expression level is higher (with one exception).
Codons: MLR-estimated coefficients for gene expression using human data.
Codons: LR-estimated coefficients for gene expression using human data.

A likelihood ratio test suggests that the full model for amino acid probability (Equation 5) is significantly better than the model considering only RSA (Equation 6; P-value

Predicted probabilities of four amino acids across possible ranges of RSA and gene expression. Probabilities for each amino acid were calculated from the estimated RSA and gene expression coefficients (see Table 5). The horizontal axis covers the possible range of RSA, and the vertical axis is for gene expression. Red regions indicate relatively high probabilities, while blue regions show low probabilities. The four amino acids depicted here (histidine, leucine, proline, and serine) were selected for the diversity of heatmap diagrams that they represent. Heatmaps for the other 16 amino acids can be found in supplementary Figure 1.
Amino acids: MLR-estimated coefficients for RSA and gene expression using human data.

Scaled selection coefficients
By applying Equation 12, we estimated the scaled selection coefficient S = 2N s of all possible point mutations at each site for the 241 protein-coding human genes. The estimated values fall into two groups defined by nonsynonymous and synonymous substitutions. Figure 4 depicts how the distribution of scaled selection coefficients for genes changes with the corresponding gene expression levels. We can see from the figure that when mutations are being selected against (S < 0), both nonsynonymous and synonymous mutations are inferred to be more deleterious as the gene expression level increases. The figure also shows that the degree of selective advantage for beneficial mutations gets larger with increasing gene expression. As expected, Figure 4 indicates that nonsynonymous mutations are influenced by gene expression to a lesser degree than synonymous ones.

Comparison of S = 2N s estimates between nonsynonymous and synonymous point mutations to human genes. For each protein-coding human gene, estimates of S were obtained for possible nonsynonymous (red) and synonymous (blue) point mutations at each site. The x-axis represents the logarithm of the geometric mean across tissues of expression measurements for a gene. The y-axis represents inferred scaled selection coefficients (S). For each gene, the scaled selection coefficient distribution among point mutations is summarized by the 5th percentile (square shape), the 50th percentile (triangular shape), and the 95th percentile (round shape).
Discussion
We developed a probabilistic framework that simultaneously considers RSA (a structural constraint) and gene expression (a functional constraint). By design, the two-step construction process of this framework (Equation 1) captures codon usage bias at the nucleotide level as well as structural and functional dependence of amino acids.
Hypothesis testing at a genomic scale reveals a potentially species-specific difference in the relationship between synonymous codon choice and RSA. In humans, the null hypothesis that RSA is independent of synonymous codon choice can be rejected. In mouse, the result is not statistically significant, possibly because of insufficient data and possibly because the relationship between RSA and synonymous codon usage is less strong. At the individual gene level, we test the same hypothesis using permutation and resampling. Although we fail to reject the null hypothesis in both human and mouse, we notice that the association between RSA and codon usage is stronger in human than in mouse. This is consistent with our finding at the genomic scale. Because we derive one test statistic from each gene and combine the test statistics to get an overall test statistic and its null distribution, we are treating each protein equally. However, because of small sample size, the test statistics calculated in some proteins may not be informative and can contribute stochastic noise to the combined test statistic. Improved test statistics might yield different conclusions.
In the first step of constructing our probabilistic framework, we used MLR and LR to model the probabilities of different synonymous codons, given gene expression. Slope estimates suggest that, in general, it is more likely to observe the preferred codon in highly expressed genes. This is consistent with previous findings.21,24,49 RSA is ignored in this step because our analyses indicate that the correlation between RSA and codon usage is small to nonexistent. This does not mean that there is no structure constraint on codon usage. Protein structure may lead to selection pressure on synonymous codon choice through an interaction between the translation process and protein folding. 50 Codon usage is also subject to other constraints because it can affect splicing and/or mRNA stability. 51
To predict amino acid types, we incorporate both RSA and gene expression as independent variables in our MLR model. Our likelihood ratio test confirms that the full model with both variables fits data significantly better than reduced models. Although the impact of gene expression on amino acid probabilities is weaker than the impact of RSA, it is still significant. The heatmaps for amino acids such as histidine and serine show that these amino acids reach their highest probabilities at intermediate RSA values (Fig. 3).
We observed a trend that 2N s estimates for both non-synonymous and synonymous point mutations become more negative as gene expression increases (Fig. 4). This observation is biologically reasonable, and a few mechanisms might contribute to it. Highly expressed proteins have been found to evolve slower because of the stronger selection pressure that they experience.4,13,52 Many highly expressed proteins are functionally important or even essential. For these proteins, the cell cannot afford their function to be disturbed or their abundance to become low. 53
Some aspects of the scaled selection coefficients are qualitatively reasonable. For example, 64.2% of the possible point mutations yield negative values of 2N s. This is in keeping with the expectation that if protein-coding genes are affected by natural selection, more possible point mutations should be deleterious than advantageous. The qualitative pattern remains when we restrict consideration to synonymous point mutations. Of these mutations, 64.0% yield negative values. Among nonsynonymous mutations, 64.3% of possible point mutations are inferred to be deleterious.
However, the distribution of nonsynonymous scaled selection coefficient estimates is clearly unrealistic in that it is too tightly clustered around the value of 0. Because some possible nonsynonymous mutations are lethal or at least highly deleterious, there should be some scaled selection coefficient values that are far below 0. We do not observe this expected long lower tail of the distribution of scaled selection coefficients for non-synonymous point mutations (eg, see the 5% nonsynonymous values in Fig. 4). Because some nonsynonymous mutations should be extremely deleterious, we also expect the average over all possible nonsynonymous mutations to be substantially below zero. We do not observe this. In fact, the average estimates of 2N s for nonsynonymous mutations is about −0.162, and this is only slightly less than the −0.158 value represented by the average 2N s estimate among synonymous point mutations. Similar shortcomings have been noted for distributions of scaled selection coefficients that have been inferred via a mutation-selection balance model of molecular evolution.44,54 Much of the mismatch between our expectations and our estimates is likely because of flaws of our evolutionary model. Specifically, the rates in our model depend on the RSA and gene expression covariates, but other aspects of phenotype are clearly very relevant to natural selection and are not captured by our model.
An additional possible weakness of our mutation-selection model and other mutation-selection models is the assumption that each new mutation is fixed or lost before the next one occurs. Our inferential framework does not accommodate the possibility that fitness-affecting genetic variants at one locus interfere with the survival or loss of fitness-affecting variants at other loci. This Hill-Robertson phenomenon 55 is potentially important to consider when connecting interspecific models of sequence change to population genetics. 56
A basic assumption of our probabilistic framework is that sites in a protein-coding sequence are independent. This assumption is commonly made, and it allows simplification of computation, even though it is clear that sites in a protein sequence do not evolve independently. It would be challenging yet worthwhile for future evolutionary studies to include structural constraints related to site dependence in a coding sequence.
Author Contributions
Conceived and designed the experiments: KW, SY, XJ, JLT. Analyzed the data: KW, SY, XJ, CL, AG. Wrote the first draft of the manuscript: KW, JLT. Contributed to the writing of the manuscript: KW, JLT. Agree with manuscript results and conclusions: All authors. Jointly developed the structure and arguments for the paper: All authors. Made critical revisions and approved final version: KW, JLT. All authors reviewed and approved of the final manuscript.
Supplementary Material
Supplementary Figure 1
Predicted probabilities of 16 amino acids across possible ranges of RSA and gene expression.
Footnotes
Acknowledgments
We thank four anonymous reviewers for their comments.