Epigenetics is an important mRNA expression regulator. However, how distinct epigenetic factors, such as microRNAs (miRNAs) and promoter methylation, cooperatively regulate mRNA expression is rarely discussed. Recently, apparent miRNA regulation of promoter methylation was identified by bioinformatic analysis; however, it has not yet been experimentally confirmed. If miRNA regulation of other epigenetic factors were identified, it would reveal another layer of epigenetic regulation. In this paper, histone modifications (H3K4me1, H3K4me3, H3K27me3, H3K27ac, H3K9ac, and H2AZ) during mammalian spermatogenesis were studied and the apparent miRNA-target-specific histone modification was investigated by bioinformatic analyses of publicly available datasets.
Results
We identified several miRNAs’ target genes that are significantly associated with histone modification during mammalian spermatogenesis. MiRNAs that target genes associated with the most significant histone modifications are expressed before or during spermatogenesis; thus the results were convincing.
Conclusions
In this paper, we identified apparent miRNA regulation of histone modifications using a bioinformatics approach. The biological mechanisms of this effect should be further experimentally investigated.
Epigenetic regulation of messenger RNA (mRNA) expression is involved in a wide variety of biological events including disease and cancer progression, development, and even evolution. Although epigenetics were recognized as important events several years ago, our present understanding of their mechanisms remains incomplete. One reason for this deficiency is our lack of knowledge about cooperative mechanisms between distinct epigenetic factors. For example, although both microRNAs (miRNAs) and promoter methylation are related to the suppression of mRNA expression, whether these two factors regulate mRNA expression cooperatively is not known. Although histone modification can both suppress and trigger mRNA expression, it is not known what would result from simultaneous suppressive and expressive histone modification. Without this kind of knowledge, our understanding of how epigenetic factors regulate target genes will remain incomplete. Recently, Su et al.1 found that miRNAs more frequently target genes with less methylated promoters. More recently, the author used bioinformatics to identify apparent reciprocal regulation of target genes between promoter methylation and miRNAs,2,3 which has some support from the evolutionary point of view.4 Thus, seeking more examples of apparent miRNA regulation of other epigenetic factors will deepen our understanding of the epigenetic regulation of mRNAs.
Histone modification is believed to affect mRNA expression through chromatin remodeling. For example, promoter methylation and methylation of histone are generally supposed to suppress transcription of genes. As both are equally methylated, it is possible that miRNA regulation of both processes exists. A relationship between promoter methylation and histone modification has been suggested.5,6
In this paper, we analyze publicly available histone modification data obtained during mammalian spermatogenesis.7 We targeted spermatogenesis because histone modification is believed to play critical roles in this process8 and miRNAs are also thought to be generally important for differentiation.9 Thus, cooperative regulation of mRNAs between miRNAs and histone modification likely takes place during spermatogenesis.
Various histone modifications of multiple development stages in spermatogenesis were investigated for being targeted by miRNAs. We found that the targeted genes of most miRNAs were significantly associated with more or less histone modification during spermatogenesis. The frequent observation of apparent miRNA-target-specific histone modification reflected the apparent dependence of histone modification on the frequency of being targeted by an individual miRNA. In addition, miRNAs whose target genes are most significantly associated with histone modification around the transcription start site (TSS) were previously reported to be expressed before or during spermatogenesis. This supported our analysis, and experimental verification of these results is awaited.
Before reporting our findings, we would like to emphasize that the primary known functions of miRNA regulation of target genes take place only post-transcriptionally; ie, in the cytoplasm. miRNAs function via base-pairing with complementary sequences within mRNA molecules. As a result, these mRNA molecules are silenced by one or more of the following processes: 1) cleavage of the mRNA strand into two pieces, 2) destabilization of the mRNA through shortening of its poly(A) tail, and 3) less efficient translation of the mRNA into proteins by ribosomes. Thus, at the moment, there are no known mechanisms that directly relate apparent miRNA-target-specific histone modification to their functionalities.
Results and Discussion
Mouse miRNAs whose target genes are associated with differential histone modification during spermatogenesis around the TSS
First, we used the MiRaGE method10,11 to investigate whether histone modifications around the TSSs of miRNA target genes were enhanced or repressed during mouse spermatogenesis (see Methods). Table 1 summarizes the number of mouse miRNAs whose target genes are associated with significant differential histone modification (significance means that the adjusted P-values are less than 0.05. The full list of mice miRNAs, together with P-values and adjusted P-values, is provided as Supplementary File 1). Although the numbers varied depending on the statistical test employed, they are almost consistent with each other. Thus, miRNA-target-specific histone modification seems to be observable during spermatogenesis.
The number of mouse miRNAs whose target genes are associated with significantly more or less modified histones, as inferred by the MiRaGE method. Statistical tests employed were the Kolmogorov-Smirnov (Ks) test, the t-test (t), and the Wilcoxon rank sum test (wilcox). Adjusted P-values less than 0.05 were considered significant. The full list of P-values are available in Supplementary File 1.
G<G’
G>G’
KS
t
WILCOX
KS
t
WILCOX
Spermatocytes (SC)
H3K4me1
120
84
90
48
4
4
H3K27me3
14
0
0
118
91
98
H3K4me3
129
112
72
19
0
1
H3K27ac
73
42
33
37
12
17
Spermatogonia (SG)
H3K27me3
3
0
0
108
99
104
H3K4me3
124
43
78
2
0
0
H3K27ac
20
19
28
39
29
30
Spermatids (ST)
H2AZ
97
24
60
69
59
33
H3K9ac
87
38
62
43
39
36
H3K4me1
86
78
77
28
2
3
H3K4me3
63
0
0
87
15
15
H3K27ac
35
23
29
23
23
14
Mouse samples can be better clustered using P-values than using the logarithmic ratio of histone modifications
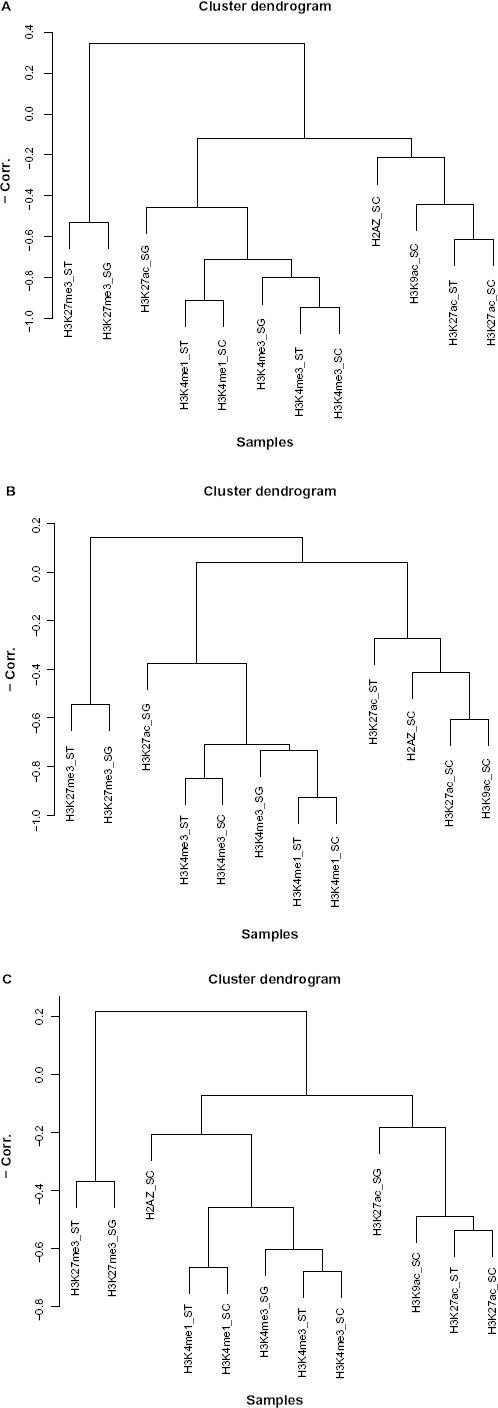
To demonstrate how the obtained P-values are biologically informative, we applied hierarchical clustering (unweighted pair group method with arithmetic mean, UPGMA) to mouse samples using distances with negatively signed correlation coefficients between P-values obtained by the t-test [Fig. 1A]. In this way, the obtained clusters are easily interpreted biologically. First, the samples were primarily clustered by their biological meanings. For example, H3K27ac_SC, H3AZ_SC, and H3K9ac_SC were clustered together (Cluster A) according to the tissue they were sampled from. H3K27me3 ST and H3K27me3_SG (Cluster B), H3K27ac ST and H3K27ac_SG (Cluster C), and H3K4me3 ST and H3K4me3_SG (Cluster D) all have the same histone modifications within the cluster. H3K4me1_ST and H3kme1_SC were clustered, and both shared histone modifications. H3K4me3_SC was clustered together with H3K4me1_ST and H3k4me1_SC (Cluster E), which were all sampled from spermatocytes. These were all low-level clusterings. Higher level clustering also had some biological significance. Cluster F comprised seven samples (H3K27ac_ST, H3K27ac_SG, H3K4me3 ST, H3K4me3_SG, H3K4me1_ST, H3k4me1_SC, and H3K4me3_SC). H3K4me3, H3K27ac, and H3K4me1 are thought to be transcription activators, and they were clustered with correlation coefficients greater than 0.4 (red broken line), thus showing that they are positively correlated. Conversely, two H3K27me3 samples (Cluster B) that were clustered with them have negative correlation coefficients. This observation is coincident with the fact that H3K27me3 is generally believed to be a transcription silencer. Although two other transcription activators, H3K9ac_SC and H3K27ac_SC (Cluster A), were not directly clustered with the seven transcription activators (Cluster F), this was the only discrepancy observed. Thus, clustering using P-values provides biologically relevant information. However, this might be because histone modification itself is biologically informative, and clustering by P-values simply reflects this. To further investigate this point, we performed UPGMA with the negative correlation coefficients between the logarithmic ratio of histone modifications, Δxij [Fig. 1B]. We employed the logarithmic ratio of histone modifications because this ratio was used for MiRaGE computation of P-values. If the biologically informative clusters obtained by the P-values simply reflected biologically informative histone modification, clustering using the logarithmic ratio of histone modifications should produce a result that is at least as good as that obtained by P-values. In contrast to our expectation, it was clear that the clusters obtained using the logarithmic ratio of histone modifications were less biologically informative than those obtained using P-values. The only conserved cluster between Figures 1A and 1B was cluster B. Cluster E was partially conserved (Cluster E’). All other clusters were broken into smaller parts. Although there were some newly formed clusters, they were not convincing. Cluster G comprised H3K4me3_SG, H3K4me3_ST, and H3K4me3_SC, which were sampled from three tissues. Cluster H mostly comprised samples taken from spermatocytes, but they were clustered with another sample taken from spermatocytes (Cluster A), which is broken, because Cluster H was now clustered with H3K27ac_ST, which was sampled from other tissues. The only advantage of Figure 1B compared to Figure 1A is that transcription silencers (H3K27me3) were clustered together and separately from transcription activators. Additionally, the clustering in Figure 1A is more compact than that in Figure 1B. In Figure 1A, if we consider three clusters, namely clusters A, B, and F, these are all clusters with correlation coefficients greater than 0.4. Although we also observed “three” clusters in Figure 1B, they are not clustered together with correlation coefficients greater than 0.4. Also, in Figure 1A, 10 samples other than H3K27ac_SC and H3K4me3_SC are clustered with at least one other sample and the correlation coefficients greater than 0.7 (blue broken line), while only 5 samples belonging to Cluster E’ and G are clustered together with any other samples and have correlation coefficients larger than 0.7. Thus, we concluded that the good clustering observed in Figure 1A could not be fully explained by biologically informative histone modifications. Converting histone modification to P-values that represent apparent miRNA-target-specific histone modification added more biological significance. This suggested indirectly that the apparent miRNA-target-specific histone modification may not be an artifact generated by the MiRaGE algorithm, but represents a genuine biological effect. Similar results to those for the P-values were obtained by either the Wilcoxon test or the Kolmogorov-Smirnov test (Figs. S1 and S2).
Hierarchical clustering (UPGMA) of mouse samples. (A) Negative correlation coefficients of P-values as distance. (B) Negative correlation coefficients of logarithmic ratio of histone modification (ΔXij) as distance.
miRNAs whose target genes are most frequently associated with significant differential histone modifications were previously reported to be regulated during spermatogenesis
We then considered individual miRNAs that contribute to apparent miRNA-target-specific histone modification. Although there are many miRNAs whose target genes are associated with significant differential histone modification (Table 1), they are not always common to different tissues or histone modifications. To identify miRNAs whose target genes are most frequently associated with significant differential histone modifications, we counted the frequency of each miRNA whose adjusted attributed P-values (by the t-test) were less than 0.05. We identified seven (three) miRNAs to which adjusted P-values of less than 0.05 were attributed for the largest 6 (5) samples among 12 samples when the null hypothesis that histone modification of target genes in differentiated samples is equal to that in control samples was rejected in favor of the alternative hypothesis that histone modification of target genes in differentiated samples is greater (lesser) than in control samples. Thus, the target genes of three miRNAs had less histone modifications and the targets of seven miRNAs had more histone modifications, compared with control samples. These three and seven miRNAs are listed in Table 2. The same results were obtained using the Wilcoxon test.
Mouse miRNAs whose target genes are most frequently associated with more or less modified histones compared with the control.
HISTONE MODIFICATION
miRNAs
G<G’
mmu-miR-291a-3p mmu-miR-294–3p
mmu-miR-295–3p
mmu-miR-302a-3p mmu-miR-22–3p
mmu-miR-302b-3p mmu-miR-302d-3p
G>G’
mmu-miR-23b-3p mmu-miR-122–5p
mmu-miR-23a-3p
Among those listed, six miRNAs (mmu-miR-291a-3p, mmu-miR-294–3p, mmu-miR-295–3p, mmu-miR-302a-3p, mmu-miR-302b-3p, and mmu-miR-302d-3p) are often cited as miRNAs that exhibit “sternness”. For example, mmu-miR-302a/b/ds’ human homologs hsa-miR-302a/b/d were reported to be embryonic stem (ES) cell-specific miRNAs.12 Mouse miR-291–3p, miR-294, and miR-295 were also reported to be mouse ES-cell-specific miRNAs.13 However, mmu-miR-22's human homolog, hsa-miR-22, was reported to be upregulated during differentiation.14 Mmu-miR-23b's human homolog, hsa-miR-23b was reported to play critical roles in spermatogenesis.15 Mmu-miR-122's human homolog, hsa-miR-122, was also reported to play critical roles in sperm abnormalities.16 Mmu-miR-23a's human homolog was reported to be poorly expressed in abnormal semen compared with normal semen.17
Thus, all of the selected 10 miRNAs were reported to be expressed in either spermatogenesis-related differentiated or undifferentiated cells. In particular, three miRNAs, mmu-miR-23a/b-3p and mmu-miR-122-5p were reported to be related to spermatogenesis. This also suggested that apparent miRNA-target-specific histone modification may not be an artifact caused by bioinformatics analysis, but is a potentially real biological outcome.
Alternatively, if the P-values computed by Kolmogorov-Smirnov test were employed, mmu-miR-29a/b/c and mmu-miR-24 were added to miRNAs with more histone modification in addition to the miRNAs listed in Table 2, while no miRNAs in Table 2, except mmu-miR-338–3p, were listed as miRNAs with less histone modification. Mmu-miR-29b was reported to be upregulated in sexually immature mouse testis.18 MiR-29a/b/c were reported to play certain roles in spermatogenesis in rats.19 Aberrant expression of miR-29a/b and miR-24 was reported in spermatogenesis-related experiment.20 MiR-338 was also identified as a testes-specific miRNA in mouse and Xenopus.21 Thus, although replacing P-values with those from the Kolmogorov-Smirnov test modified Table 2 a little and some miRNAs are additionally identified, they are also reported to be related to spermatogenesis.
Apparent mimA-target-specific histone modification is unlikely to be an artifact caused by bioinformatic analysis
Although the previous sections demonstrated that apparent miRNA-target-specific histone modification is biologically plausible, in this section we attempt to validate the apparent miRNA-target-specific histone modification from the algorithmic point of view. The first test was the shuffle test. If the apparent miRNA-target-specific histone modification was an artifact caused by the algorithm used, then the apparent miRNA-target-specific histone modification should be observable no matter what the input was, eg, it is biologically meaningless. One of the easiest ways to prepare an input that is biologically meaningless but statistically equivalent to the real input is shuffling. If Δxij is randomly replaced with Δxi'j, i’ ≠ i, because this does not affect statistical properties (eg, the mean and variance) of {Δxij}, then the shuffled dataset will be a biologically meaningless but statistically identical input. Table 3 shows the results obtained by 100 random shufflings. Independently of the statistical tests employed, almost no apparent miRNA-target-specific histone modification was observed. This suggested that the apparent miRNA-target-specific histone modification is unlikely to an artifact.
Number of mouse miRNAs whose target genes are associated with significantly more or less modified histones, as inferred by the MiRaGE method when the gene IDs were shuffled.
G<G’
G>G’
KS
t
WILCOX
KS
t
WILCOX
Spermatocytes
H3K4me1
0.42
0.26
0.36
0.36
0.24
0.35
H3K27me3
0.37
0.33
0.13
0.07
0.37
0.23
H3K4me3
0.33
0.24
0.60
0.34
0.24
0.11
H3K27ac
0.03
0.10
0.12
0.39
0.38
0.20
Spermatogonia
H3K27me3
0.11
0.31
0.26
0.23
0.39
0.33
H3K4me3
0.18
0.03
0.21
0.13
0.17
0.09
H3K27ac
0.19
0.49
0.06
0.38
0.39
0.27
Spermatids
H2AZ
0.48
0.14
0.33
0.12
0.13
0.14
H3K9ac
0.54
0.11
0.19
0.23
0.24
0.22
H3K4me1
0.19
0.32
0.09
0.19
0.23
0.14
H3K4me3
0.50
0.04
0.18
0.39
0.12
0.13
H3K27ac
0.04
0.08
0.26
0.16
0.36
0.08
Notes: Data are averaged over 100 independent trials. Statistical tests employed were the Kolmogorov–smirnov (Ks) test, the t-test (t), and the Wilcoxon rank sum test (wilcox). Adjusted P-values less than 0.05 were considered significant.
A shuffle test where the genes are shuffled simultaneously for all samples was also used for confirmation. This means, if the ith histone modification of the jth sample xij is exchanged with xi'j, the ith histone modification is always exchanged with the i'th histone modification for all samples other than jth sample, too. Hereafter, we call this kind of shuffling “simultaneous shuffling”. Thus, this simultaneous shuffling did not affect the correlation coefficients between sample histone modifications. For example, the hierarchical clustering shown in Figure 1B remained unchanged. Conversely, shuffling completely destroyed the inference of apparent miRNA-target-specific histone modification, as shown in Table 3. Thus, Figure 1A computed from the P-values would change drastically. Figure 2 shows a typical hierarchical clustering using P-values computed from simultaneously shuffled histone modifications. Interestingly, it is almost identical to Figure 1B computed from the logarithmic ratio of histone modifications, Δxij. This suggests that the difference between Figures 1A and 1B did not come from an artifact caused by the MiRaGE procedure, but reflects a biologically significant event captured by the MiRaGE procedure. This also supports the view that our findings are not artifactual.
Hierarchical clustering (UPGMA) of simultaneously shuffled mouse samples Notations are the same as Figure 1 (A). P-values were computed by (A) t-test, (B) Wilcoxon test, and (C) Kolmogorov-Smirnov test.
Finally, we tested what would happen if multivariate analysis was employed. In the MiRaGE method, all mRNA expression is attributed to the considered miRNA. This is clearly an overestimation or double count, because mRNA expression is affected by all miRNAs that target each gene, not just the considered miRNA. To address this concern, we tried to infer mRNA expression (logarithmic ratio Δxij) as a function of the target gene table of miRNAs, using lasso.22 Lasso tries to infer mRNA expression as a function of all miRNAs that target each mRNA and a shrinkage algorithm excludes irrelevant miRNAs; therefore, double counts and/or overestimation of apparent miRNA-target-specific histone modification are expected to be suppressed. Figure 3 shows the comparison between P-values obtained by the MiRaGE method and the regression coefficients obtained by lasso. It is clear that they are well and significantly correlated, although some differences could be observed. Lasso and MiRaGE methods employ numerical inference; therefore, some discrepancies are unavoidable without experimental validation. Critically, we can state that the overestimation and/or double count possibly included in the MiRaGE method do not destroy the inference. Although the results for the P-values obtained by the Wilcoxon and Kormogorov–Smirnov tests are available in Figures S3 and S4, they are essentially the same as that for the P-values obtained by the t-test.
Comparison between P-values and regression coefficients. Horizontal axis shows the regression coefficients attributed to each miRNA by lasso. Vertical axis shows the P-values (G < G’) obtained and attributed to each miRNA by the MiRage method, using the t-test. COR, Spearman correlation coefficients; P, attributed P-values to correlation coefficients.
Apparent miRNA-target-specific histone modification is also observable in human sperm
All the findings discussed above were for mice. Is apparent miRNA-target-specific histone modification observable in humans? We applied the same procedures to human sperm. Table 4 shows the results for human sperm (the full list of miRNAs associated with adjusted P-values are available in Supplementary File 1). Interestingly, independent of the histone modification considered and statistical methods employed, there are a substantial number of miRNAs that apparently regulate histone modification. Thus, the observed apparent miRNA-target-specific histone modification occurs not only in mice but also in humans, which suggests that it is ubiquitous to mammalian spermatogenesis, verification of which requires further experimentation.
Number of human sperm miRNAs whose target genes are associated with significantly more or less modified histones, as inferred by the MiRaGE method.
G<G’
G>G’
KS
t
WILCOX
KS
t
WILCOX
H3K27ac
138
131
130
39
30
29
H3K4me1
137
141
137
23
31
23
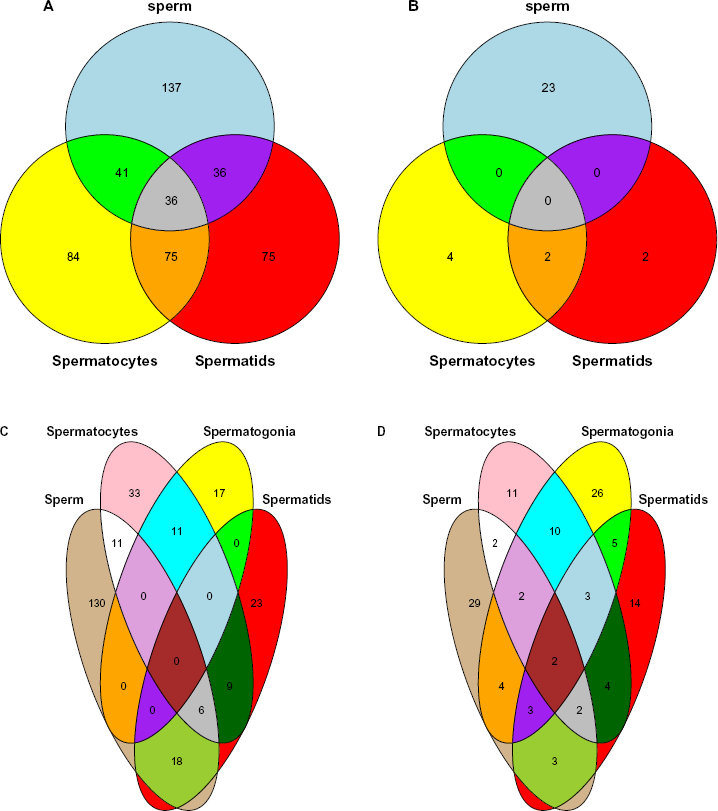
In order to see if conserved miRNAs share the same apparent miRNA-target-specific histone modification commonly, we have drawn Venn diagrams between histone modifications (Fig. 4, see Methods). There are many conserved miRNAs associated with common apparent miRNA-target-specific histone modification (individual names available in Supplementary File 2). It also supports the reliability of apparent miRNA-target-specific histone modification.
Venn diagrams that compare apparent microRNA-target-specific histone modifications between human and mouse. Apparent microRNA-target-specific histone modifications were compared between conserved miRNAs of human (sperm) and mouse (spermatocytes, spermatogonia, and spermatids). Full lists of individual miRNA names were available in Supplementary File 2. See Methods for more details. (A) G < G’, H3K4me1, (B) G > G’, H3K4me1, (C) G < G’, H3K27ac, and (D) G > G’, H3K27ac.
Dependence of histone modification on the number of miRNA target genes caused apparent miRNA-target-specific histone modification
Although the apparent miRNA-target-specific histone modification observed in this study is
biologically informative and thus feasible,
not likely caused by an artifact of the algorithms employed, and
universal between at least humans and mice, and is thus expected to be universal in mammalian spermatogenesis,
one may still wonder if it is a real phenomenon, because all the results shown here were derived from bioinformatic analyses and not from experimental investigation. To confirm the existence of apparent miRNA-target-specific histone modification, we investigated its origin. Table 5 shows a comparison of the amount of histone modification between genes targeted by more miRNAs than average and those targeted by fewer than average. In most cases, the amount of histone modification is distinct. In our analysis, we divided the genes into two groups: genes targeted by the considered miRNAs, and those not targeted by the considered miRNA but by any other miRNAs. Genes targeted by more miRNAs were more likely to be classified into the former group. Thus, if the amount of histone modification is dependent on the number of miRNAs that target the gene, then an apparent miRNA-target-specific histone modification will be observed (Fig. 5). One may also wonder what the effect would be of replacing the target gene table with one predicted by another algorithm. Thus, we compared the amount of histone modification between genes targeted by more or less than the average numbers of miRNAs using the target gene table from TargetScan.23 The P-values obtained using TargetScan were generally less significant. In TargetScan, only conserved target genes are considered. Thus, it has a tendency to ignore genes targeted by a smaller number of miRNAs; therefore, genes targeted by fewer miRNAs are more likely to be excluded from the TargetScan target gene table. TargetScan is generally thought to generate fewer false positives, which inevitably results in more false negatives, ie, exclusion of potential target genes.24 Usually, TargetScan's gene table is believed to be the most reliable. The present example suggests that this may not always be true: TargetScan's accuracy is dependent on the context. If we had used the TargetScan gene table unquestioningly, the miRNA regulation of target genes would be weaker and we might have missed the phenomenon altogether. Thus, it is important to choose miRNA target gene prediction algorithms bearing in mind the context and purpose.
P-values attributed to histone modification compared between genes targeted by more or less miRNAs than the mean.
HISTONE MODIFICATION
SEED MATCH (THIS STUDY)
TARGETSCAN
P-VALUES
ADJUSTED P-VALUES
P-VALUES
ADJUSTED P-VALUES
Spermatocytes
H3K27ac
1.32 × 10-03
2.36 × 10-03
1.41 × 10-03
4.24 × 10⁻³
H3K4me3
6.76 × 10-05
1.62 × 10-04
3.83 × 10⁻¹
[4.60 × 10⁻¹]
H3K27me3
1.38 × 10⁻²¹
1.65 × 10⁻²⁰
3.18 × 10⁻⁶
1.27 × 10⁻⁵
H3K4me1
6.18 × 10⁻¹
[6.18 × 10⁻¹]
2.18 × 10⁻¹
[3.28 × 10⁻¹]
Spermatids
H3K27ac
1.27 × 10⁻⁵
3.83 × 10⁻⁵
5.45 × 10⁻¹
5.95 × 10⁻¹
H2AZ
1.37 × 10⁻³
2.36 × 10⁻³
9.42 × 10⁻⁷
5.65 × 10⁻⁶
H3K4me1
4.48 10-1
[4.89 × 10⁻¹]
6.86 × 10⁻²
[1.37 × 10⁻¹]
H3K4me3
2.83 × 10⁻¹
[3.40 × 10⁻¹]
6.46 × 10⁻¹
[6.46 × 10⁻¹]
H3K9ac
4.91 × 10⁻⁹
1.96 × 10⁻⁸
4.14 × 10⁻⁹
4.97 × 10⁻⁸
Spermatogonia
H3K27ac
1.71 × 10⁻¹
[2.28 × 10⁻¹]
1.09 × 10⁻¹
[1.87 × 10⁻¹]
H3K27me3
3.14 × 10⁻¹⁷
1.88 × 10⁻¹⁶
1.88 × 10⁻³
4.51 × 10⁻³
H3K4me3
9.84 × 10⁻³
1.47 × 10⁻²
3.74 × 10⁻¹
[4.60 × 10⁻¹]
Notes:P-values were computed by the t-test. Adjusted P-values in parenthesis are not significant (ie, greater than 0.05). Although the results for P-values computed by Wilcoxon test and Kolmogorov–smirnov test were available as Supplementary File 3, there were no significant differences. All mRNAs targeted by at least one miRNA were considered for the computation.
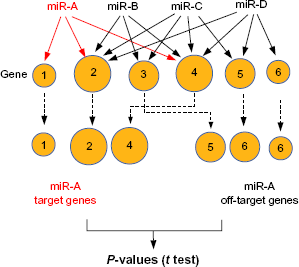
schematics explaining the P-values of the dependence of histone modification on miRNAs. There are four miRNAs that target six genes. Although in this example we assumed that histone modifications increase as more miRNAs target the genes, it could be that histone modifications decrease as more miRNAs target the genes, depending upon the types of considered histone modification. The sizes of circles reflect the amount of histone modification. If we consider miR-A, genes 1, 2, and 4 are classified as target genes and 3, 5, and 6 are off-target genes. Thus, target genes are regarded as being associated with more histone modifications. Genes with less histone modification are rarely classified as target genes; therefore, it is more likely that genes targeted by an miRNA have more histone modifications than off-target genes.
Confirmation using an independent dataset
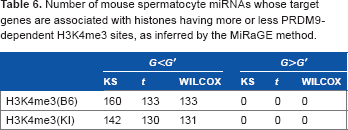
In the previous sections, we confirmed that the apparent miRNA-target-specific histone modification is not likely an artifact but seemingly a real biological effect from several points of views. However, one may still wonder if it was caused by some unknown bias introduced by the experimental procedures that we could not discern. To reduce this possibility, we applied our methodology to an alternative dataset provided by another research group. Baker et al.25 identified PRDM9-dependent H3K4me3 sites by comparing modified chromatin from mice coisogenic for PRDM9 in 12-day post-partum mouse spermatocytes. Thus, although their experimental design cannot be regarded to be very close to that analyzed in the previous sections, if the apparent miRNA-target-specific histone modification is also identified in their work, this suggests the universality of the apparent miRNA-target-specific histone modification in spermatogenesis. Table 6 shows the results for the independent dataset (the full list is available as Supplementary File 4). It is clear that many miRNAs have target genes associated with histone having more or less PRDM9-dependent H3K4me3 sites. Thus, apparent miRNA-target-specific histone modification during spermatogenesis could be observed in different datasets.
Number of mouse spermatocyte miRNAs whose target genes are associated with histones having more or less PRDM9-dependent H3K4me3 sites, as inferred by the MiRaGE method.
G<G’
G>G’
KS
t
WILCOX
KS
t
WILCOX
H3K4me3(B6)
160
133
133
0
0
0
H3K4me3(KI)
142
130
131
0
0
0
Biological function of apparent miRNA-target-specific histone modification
Although the apparent miRNA-target-specific histone modification seems to be a real phenomenon, it would be more convincing if we could suggest what its biological function is. Unfortunately, we have no suggestions regarding the biological function of apparent miRNA-target-specific histone modification, nor do we have any suggestions regarding experimental confirmation of apparent miRNA-target-specific histone modification. Recently, Ihara et al.26 investigated the enrichment of histones, which is believed to be caused by histone modification and to affect gene expression in spermatogenesis. Thus, observation of apparent miRNA-target-specific histone enrichment in these data would support its existence.
Table 7 shows the results of apparent miRNA-target-specific histone enrichment in spermatogenesis (full list is available as Supplementary File 5). Although the number of miRNAs whose target genes are significantly associated with more or less histone enrichment is small, the number is not zero. Thus, it is plausible that the apparent miRNA-target-specific histone modification has a biological function in spermatogenesis.
Number of mouse spermatocyte miRNAs whose target genes are associated with histone enrichment, as inferred by the MiRaGE method.
G<G’
G>G’
KS
t
WILCOX
KS
t
WILCOX
mtm6
1
12
0
20
3
20
mtm7
0
11
0
25
7
23
mtm8
12
12
5
16
7
12
D23
4
0
0
0
4
4
Biological origin of long-range interaction between MIRNA regulation and histone modification
One may wonder whether the findings here are biologically realistic, because miRNA regulation of target genes and histone modification take place at the opposite ends of a gene (the former at the 3’ UTR and the latter at the 5’ UTR). Although there have been no reports that studied this kind of long-range interaction between miRNA regulation and histone modification, some studies have reported the long-range interactions between histone modification and RNAi, which contributes to post-transcriptional suppression similar to miRNA.27 For example, Zofall et al.28 found that histone H2A.Z cooperates with RNAi and heterochromatin factors to suppress antisense RNAs. The location of H2A.Z on the DNA is far from where RNAi binds to the DNA: H2A.Z binds to the 5’ UTR of the transcript, while the RNAi should bind to the 3’ UTR of considered transcript. Zofall et al.29 also reported that RNAi nucleation and DNA-binding factor nucleation spread in opposite directions, starting from opposite ends of the gene to cooperate with heterochromatin assembly factors. Conversely, Yu et al found30 that sequences in the 3’ UTR of an mRNA-coding gene inhibited the ability of siRNAs to promote heterochromatin formation, which takes place in the 5’ UTR of the gene. Although no similar processes have been reported in humans or mice (all studies were restricted to fission yeast), it would not be surprising if similar mechanisms are found later and long-range interactions between miRNA regulation and histone modification turn out to be real.
Conclusions
In this paper, we used bioinformatics to identify the apparent miRNA-target-specific histone modification in mouse and human spermatogenesis. Such histone modification was biologically informative and feasible, and was unlikely to be caused by an artifact generated by the algorithm used. Also, such histone modification reflected the dependence of histone modifications on the frequency of being targeted by an individual miRNA; therefore, it is likely a real biological effect. However, the mechanism of apparent miRNA-target-specific histone modification is unknown and requires further experimentation and analysis.
Methods
Brief explanation of the MiRaGE method
This is a brief explanation of the MiRaGE method. For more details, see the previous publications.10,11
Although MiRaGE was originally invented to infer miRNA regulation of target gene expression from target mRNA expression, it has also been used successfully to infer miRNA regulation of promoter methylation.2,3 Briefly, MiRaGE first computes the amount of differential mRNA expression/promoter methylation/histone modification of the ith gene at the jth sample, Δxij (see below for actual definition). It then computes the differential values to group the genes into two sets: genes targeted by the considered miRNA, or genes not targeted by the considered miRNA but targeted by any other miRNAs. The exclusion from the analysis of genes not targeted by any miRNAs is due to the interrelations between genes targeted by any miRNAs. Thus, genes targeted by any miRNAs should be considered separately from genes targeted by no miRNAs. For example, each miRNA must compete with the protein machinery, such as AGO proteins, that mediates its function. If the amounts of certain miRNAs increased, these miRNAs might occupy protein machineries that otherwise could be used by other miRNAs.31 This would affect the expression of mRNAs not targeted by these miRNAs but targeted by any other miRNAs. However, this does not affect genes targeted by no miRNAs. Conversely, if certain mRNAs’ expressions increased, they would absorb miRNAs that otherwise could bind to other mRNAs.32 Thus, the amount of genes targeted by any miRNAs affects the expression of other genes targeted by any miRNAs but does not affect that of genes not targeted by any other miRNAs. Thus, mRNAs targeted by no miRNAs were excluded from the analysis. Then, the P-values computed by the three statistical tests, ie, the t-test, the Wilcoxon rank sum test, and the Kolmogorov-Smirnov test, were attributed to individual miRNAs. Despite the simplicity of this methodology, it has worked well for various applications.33–36 The obtained P-values were adjusted using the Benjamini– Hochberg criterion.37
In the following, we explain MiRaGE methods along the line by which it was used in this study. Suppose xij is the histone modification (or enrichment) of the ith gene and jth treated sample. The differential histone modification between treated and control samples would then be
where xic is the histone modification (or enrichment) of the control sample. Δxijs are divided into two groups: genes targeted by the considered miRNA (set G), and genes not targeted by the considered miRNA but targeted by any other miRNAs (set G’). Here, targets are identified by a simple seed match.10,11 Statistical tests are then performed to compute the P-values to reject the null hypothesis that {xij|i ∈ G} is equivalent to {xij|i ∈ G’} in favor of (a) {xij|i ∈ G} > {xij|i ∈ G’} or (b) {xij|i ∈ G} < {xij|i ∈ G’}. Hereafter, we denote the probability defined by (a) as PG>G’ and that by (b) as PG<G,. All three statistical tests mentioned in the above (the t-test, Wilcoxon rank sum test, and Kolmogorov–Smirnov test) were employed for P-value computations. In this study, only conserved miRNAs were considered (the full list of considered miRNAs is available as Supplementary File 1).
Histone modification data studied
Histone modification data was downloaded from the Gene Expression Omnibus (GEO) using GEO IDs: GSE49621 (Mouse) and GSE57095 (human). Mouse data were obtained from a custom download in the Supplementary file of superseries GSE49624, as shown in Table 8. Human sperm data were obtained as sequencing data from GEO IDs: GSM1375208–-GSM1375210. The human control dataset was also obtained from GEO ID: GSM392714. The obtained SRA format files were converted to fastq files using fastq-dump (sratoolkit.2.3.5), and the fastq files were mapped to the hg19 human genome using bowtie238 with default settings. The resulting sam files were then converted to sorted bam files and merged (there were two replicates) using samtools39 (sam and bam file formats are the formats that attribute various quantities to genome location. In this case, the quantities are histone modification). Finally, macs40 performed the peak calling.
Association of histone modification with genes was computed by integration of histone modifications between 1000 bases downstream and upstream from the TSS in the hg19 human genome and the mm9 mouse genome.
Comparisons of apparent microRNA-target-specific histone modifications between conserved miRNAs of human and mouse
In order to compare the apparent miRNA-target-specific histone modification between conserved miRNAs of human and mouse, we first listed the apparent miRNA-target-specific histone modification that were recognized as significant by all three statistical tests, ie, t-test, Wilcoxon rank sum test, and Kolmogorov-Smirnov test, for both H3Kme1 and H3K27ac, using adjusted P-values provided in Supplementary File 1. Then, conserved miRNAs between human and mouse were listed based upon miRviewer.41 Since three and four independent experiments were performed for H3Kme1 and H3K27ac, respectively, based upon these results, Venn diagrams (Fig. 4) were drawn and full lists of identified miRNAs were included in Supplementary File 2.
Independent histone modification data for confirmation
Independent histone modification data was downloaded from GEO using GEO ID: GSE52628. For B6 and KI cell lines, GSE52628_H3K4me3_B6_merge_ChIP.BedGraph.gz and GSE52628_H3K4me3_KI_merge_ChIP.BedGraph.gz in Supplementary file were used for the MiRaGE method, respectively. Because no control data were available in these datasets, xic was constantly taken to be 1 independent of i.
Histone enrichment dataset
Histone enrichment data was downloaded from GEO using GEO ID: GSE56281. GSM1358290_mtm6.sorted.bedGraph.gz in Supplementary file of GSM1358290, GSM1358291_mtm7.sorted. bedGraph.gz in Supplementary file of GSM1358291, and GSM1358292_mtm8.sorted.bedGraph.gz in Supplementary file of GSM1358292 were first downloaded. Because no control data were available in these datasets, xic was constantly taken to be 1 independent of i. GSE56281_D23_IP.sorted.bedGraph.gz and GSE56281_D23_input.sorted.bedGraph.gz in Supplementary file of GSE56281 were downloaded and used as treated and control data, respectively. Also, in these datasets, the values had already been converted to be logarithmic values; therefore, exp(xij) was used instead of xij, while xic has not been converted, thus xic was used for input.
Inference of apparent microRNA-target-specific histone modification using lasso
To infer the apparent miRNA-target-specific histone modification by multivariate analysis, we employed lasso.22 Δxij is modeled as
where θik takes 1 if the ith gene is targeted by the kth miRNA; otherwise it is 0. βks are those computed by the lars function in the lars package in R for the maximum number of nonzero βk. The obtained βks were plotted and compared with the P-values obtained by MiRaGE and attributed to the kth miRNA.
Statistical analysis using functions/packages in R
Most statistical analyses in this study were performed with various packages/functions in R.42 Hierarchical clustering (UPGMA) was performed by the hclust function with the setting method = “average”. Lasso was performed by the lars function in the package lars with default settings. Three statistical tests used the three functions: t.test, ks.test, and wilcox. test in R. Adjusted P-values were computed using the p.adjust function with the setting method = “BH”.
Author Contributions
Conceived and designed the experiments: YHT. Analyzed the data: YHT. Wrote the first draft of the manuscript: YHT. Agree with manuscript results and conclusions: YHT. Developed the structure and arguments for the paper: YHT. Made critical revisions: YHT. The author reviewed and approved of the final manuscript.
Supplementary Data
Supplementary File 1
P-values and adjusted P-values. P-values (PG<G’ and PG>G’) and adjusted P-values for mouse and human samples. Each sheet name indicates which sheet includes what kind of data.
Supplementary File 2
Individual miRNA names presented in Venn diagram (Fig. 4).
Individual names of miRNAs associated with apparent microRNA-target-specific histone modifications shown in Figure 4. MiRNAs conserved between human and mouse are shown in red.
Supplementary File 3
P-values attributed to histone modification compared between genes targeted by more or less miRNAs than the mean.
P-values shown in Table 5 for t-test, Wilcoxon test, and Kolmogorov-Smirnov test.
Supplementary File 4
P-values and adjusted P-values.
P-values (PG<G’ and PG>G’) and adjusted P-values for independent histone modification data for confirmation.
Supplementary File 5
P-values and adjusted P-values.
P-values (PG<G’ and PG>G,) and adjusted P-values for histone enrichment.
Supplementary File 6
Supplementary Figures S1, S2, S3 and S4.
References
1.
SuZ., XiaJ., ZhaoZ.Functional complementation between transcriptional methylation regulation and post-transcriptional microRNA regulation in the human genome.BMC Genomics.2011; 12(Suppl 5): S15.
2.
TaguchiY-H.Correlation between miRNA-targeted-gene promoter methylation and miRNA regulation of target genes. F1000 Res.2013; 2: 21.
3.
TaguchiY-H.MicroRNA-mediated regulation of target genes in several brain regions is correlated to both microRNA-targeting-specific promoter methylation and differential microRNA expression. BioData Min.2013; 6: 11.
4.
ChuangT-J, ChiangT-W.Impacts of pretranscriptional DNA methylation, transcriptional transcription factor, and posttranscriptional microRNA regulations on protein evolutionary rate. Genome Biol Evol.2014; 6: 1530–41.
5.
CedarH., BergmanY.Linking DNA methylation and histone modification: patterns and paradigms. Nat Rev Genet.2009; 10: 295–304.
6.
BalasubramanianD., Akhtar-ZaidiB., SongL.H3K4me3 inversely correlates with DNA methylation at a large class of non-CpG-island-containing start sites. Genome Med.2012; 4: 47.
7.
HammoudS.S., LowD.H., YiC., CarrellD.T., GuccioneE., CairnsB.R.Chromatin and transcription transitions of mammalian adult germline stem cells and spermatogenesis. Cell Stem Cell.2014; 15(2): 239–53.
8.
SayedD., AbdellatifM.MicroRNAs in development and disease. Physiol Rev.2011; 91: 827–87.
9.
GovinJ., CaronC., LestratC., RousseauxS., KhochbinS.The role of histones in chromatin remodelling during mammalian spermiogenesis. Eur J Biochem.2004; 271: 3459–69.
10.
TaguchiY-H.Inference of target gene regulation by miRNA via MiRaGE server. In: WanJ., ed. Introduction to Genetics – DNA Methylation, Histone Modification and Gene Regulation.Hong Kong: iConcept Press; 2013: 175–99.
NavarroA., MonzoM.MicroRNAs in human embryonic and cancer stem cells. Yonsei Med J.2010; 51: 622–32.
15.
NichollsP.K., HarrisonC.A., WaltonK.L., McLachlanR.I., O'DonnellL., StantonP.G.Hormonal regulation of sertoli cell micro-RNAs at spermiation. Endocrinology.2011; 152: 1670–83.
16.
LiuT., HuangY., LiuJ.MicroRNA-122 influences the development of sperm abnormalities from human induced pluripotent stem cells by regulating TNP2 expression. Stem Cells Dev.2013; 22: 1839–50.
17.
LiuT., ChengW., GaoY., WangH., LiuZ.Microarray analysis of microRNA expression patterns in the semen of infertile men with semen abnormalities. Mol Med Rep.2012; 6: 535–42.
18.
YanN., LuY., SunH.A microarray for microRNA profiling in mouse testis tissues. Reproduction.2007; 134: 73–9.
19.
MeunierL., SiddeekB., VegaA.Perinatal programming of adult rat germ cell death after exposure to xenoestrogens: role of microRNA miR-29 family in the down-regulation of DNA methyltransferases and Mcl-1. Endocrinology.2012; 153: 1936–47.
20.
WuJ., LiaoM., ZhuH.CD49f-positive testicular cells in Saanen dairy goat were identified as spermatogonia-like cells by miRNA profiling analysis. J Cell Biochem.2014; 115: 1712–23.
21.
Madison-VillarM.J., MichalakP.Misexpression of testicular microRNA in sterile Xenopus hybrids points to tetrapod-specific microRNAs associated with male fertility. J Mol Evol.2011; 73: 316–24.
22.
TibshiraniR.Regression shrinkage and selection via the lasso. J R Stat.1996; 58: 267–88.
23.
LewisB.P., BurgeC.B., BartelD.P.Conserved seed pairing, often flanked by adenosines, indicates that thousands of human genes are microRNA targets. Cell.2005; 120: 15–20.
24.
CreightonC.J., NagarajaA.K., HanashS.M., MatzukM.M., GunaratneP.H.A bioinformatics tool for linking gene expression profiling results with public databases of microRNA target predictions. RNA.2008; 14: 2290–6.
IharaM., Meyer-FiccaM.L., LeuN.A.Paternal poly (ADP-ribose) metabolism modulates retention of inheritable sperm histones and early embryonic gene expression. PLoS Genet.2014; 10: e1004317.
27.
Reyes-TurcuF.E., GrewalS.I.Different means, same end-heterochromatin formation by RNAi and RNAi-independent RNA processing factors in fission yeast. Curr Opin Genet Dev.2012; 22: 156–63.
28.
ZofallM., FischerT., ZhangK.Histone H2A.Z cooperates with RNAi and heterochromatin factors to suppress antisense RNAs. Nature.2009; 461: 419–22.
29.
ZofallM., GrewalS.I.RNAi-mediated heterochromatin assembly in fission yeast. Cold Spring Harb Symp Quant Biol.2006; 71: 487–96.
30.
YuR., JihG., IglesiasN., MoazedD.Determinants of heterochromatic siRNA biogenesis and function. Mol Cell.2014; 53: 262–76.
31.
NagataY., ShimizuE., HibioN., Ui-TeiK.Fluctuation of global gene expression by endogenous miRNA response to the introduction of an exogenous miRNA. Int J Mol Sci.2013; 14: 11171–89.
32.
EbertM.S., SharpP.A.MicroRNA sponges: progress and possibilities. RNA.2010; 16: 2043–50.
33.
TaguchiY-H.Inference of target gene regulation via miRNAs during cell senescence by using the MiRaGE server. Aging Dis.2012; 3: 301–6.
34.
YoshizawaM., TaguchiY-H, YasudaJ.Inference of gene regulation via miRNAs during ES cell differentiation using MiRaGE method. Int J Mol Sci.2011; 12: 9265–76.
35.
TaguchiY-H, YasudaJ.MiRaGE: inference of gene expression regulation via microRNA transfection II. In: HuangD-S, GanY., PremaratneP., HanK., eds. Bio-Inspired Computing and Applications: 6840 of Lecture Notes in Computer Science.Berlin: Springer; 2012: 129–35.
36.
TaguchiY-H, YasudaJ.Inference of gene expression regulation via microRNA transfection. In: HuangD-S, ZhaoZ., BevilacquaV., FigueroaJ.C., eds. Advanced Intelligent Computing Theories and Applications: 6215 of Lecture Notes in Computer Science.Berlin: Springer; 2010: 672–9.
37.
BenjaminiY., HochbergY.Controlling the false discovery rate: a practical and powerful approach to multiple testing. J R Stat Soc.1995; 57(1): 289–300.