
Abstract
Phylogenetic analysis based on multi-loci data sets is performed by means of supermatrix (SM) or supertree (ST) approaches. Recently, methods that rely on species tree (SppT) inference by the multi-species coalescence have also been implemented to tackle this problem. Generally, the relative performance of these three major strategies has been calculated using simulation of biological sequences. However, sequence simulation may not entirely replicate the complexity of the evolutionary process. Thus, issues regarding the usefulness of in silico sequences in studying the performance of phylogenetic methods have been raised. Here, we used both classical simulation and empirical data to investigate the relative performance of ST, SM, and the SppT methods. SM analyses performed better than the ST and SppTs in simulations, but not in empirical analyses where some ST methods significantly outperformed the others. Additionally, SM was the only method that was robust under evolutionary model violations in simulations. These results show that conventional biological sequence simulation cannot adequately resolve which method is most efficient to recover the SppT. In such simulations, the SM approach recovers the established phylogeny in most instances, whereas the performance of the ST and SppT methods is downgraded in simpler cases. When compared, the analyses based on empirical and simulated sequences yielded largely inconsistent results, with the latter showing a bias towards a seemingly superiority of SM approaches.
Introduction
Biological sequence simulation is typically used to investigate the performance of phylogenetic methods.1,2 In the absence of known phylogenies, this strategy is the only approach available to measure statistical consistency, efficiency, robustness, and accuracy. The simulation of biological sequences has indeed played a central role in understanding the limitations and scope of the classical algorithms including distance matrix, parsimony, maximum likelihood (ML), and Bayesian inference.1,3–5
The accurate replication of the evolutionary process that generates real nucleotide and amino acid sequences is, however, a challenging task. In silico sequence evolution, as implemented in the main simulation programs,6,7 relies on established evolutionary models that are known to be incapable of capturing the full intricacy of the evolutionary process. 8 Issues such as heterotachy or rate variation among branches are not fully addressed by these simulation algorithms. Indels, another common biological feature of sequence alignments, are also frequently ignored. 9
Furthermore, conventional simulation approaches equate gene trees and species tree (SppT), even though the processes which generate gene trees have been shown to be biologically different from those applied to SppTs.10,11 For example, if population-level phenomena within the SppT, ie, the multispecies coalescent, 12 is not considered, the possibility of incomplete lineage sorting on the simulated data set is disregarded.
In this context, one might inquire about the consequences of such simplistic model assumptions for the evaluation of phylogenetic methods. The supermatrix/supertree debate exemplifies this problem. The increasing availability of molecular data led researchers to consider potential approaches to multiple-sequence alignments. 13 One approach, the supermatrix (SM) or total-evidence approach, addresses multiple-sequence data by concatenating individual genes in a superalignment. 14 Such alignments are then analyzed by allowing the gene partition to possess independent evolutionary parameters. However, the phylogenetic tree is shared by all partitions. Another strategy is dubbed the supertree (ST). In contrast to the SM approach, the ST approach uses individual genes to estimate independent gene trees. The phylogeny is obtained by summarizing the information from the gene trees using a particular algorithm.15,16
It has been suggested that by concatenating several gene sequences, the SM approach reduces the stochastic error inherent in phylogenetic inference because the number of sites analyzed is substantially increased. 17 However, the issue of systematic error becomes a concern as the number of sites increases. As stated above, existing models of sequence evolution cannot fully capture all aspects of the evolutionary process. Therefore, the estimates obtained from large datasets using incorrect models will be biased, ie, inconsistent. 13 Moreover, because individual gene trees may differ from the SppT, concatenation seems to represent a counterintuitive approach.
Several studies were conducted to compare the performance of these alternative approaches on real and simulated data sets.18,19 Although many studies have demonstrated the superiority of the SM approach to the ST method, 20 other works have shown that the two methodologies are complementary. 21 Furthermore, the recent development of methods that model gene tree variation to estimate the SppT has raised questions about the power of the analyses performed on single, concatenated data sets.11,22,23
In this study, we show that conventional biological sequence simulation cannot adequately resolve which method is most efficient to recover the species phylogeny. When using simulated data, the SM approach recovered the true phylogeny in most instances, whereas the performances of the ST and SppT methods were downgraded. On the empirical data set, however, SM was not the most efficient strategy to deal with multi-loci data. When compared, the analyses based on empirical and simulated sequences yielded largely inconsistent results, with the latter showing a bias towards a seeming superiority of SM approaches. We therefore propose that, generally, the conventional simulation of biological sequences is overly conservative and that alternative strategies should be adopted to evaluate phylogenetic methodologies.
Materials and Methods
We have studied the performance of the SM, ST, and SppT approaches using both classical simulation and empirical data. Traditionally, simulation studies have been used in phylogenetics because they allow the evaluation of statistical measures, such as the accuracy and precision of an estimate. In theory, empirical data are not suitable for the analysis of such features because the true phylogeny is rarely known. If the accumulated empirical evidence for a phylogenetic hypothesis is very high, however, one can confidently assume that the true phylogeny of a lineage is known. This assumption is valid for the phylogenetic affinities of certain mammalian lineages. Accordingly, we have used the abundant information available from mammal genome studies to furnish the empirical data for our analysis.
Simulation
To verify the behavior of the different approaches, we have simulated data under biological scenarios in which phylogenetic inference is difficult. First, cladogenetic events in our topologies were forced to occur over a time span ranging from the Cambrian period (500 Ma) to the late Miocene epoch (7 Ma). Ultrametric tree topologies, with branch lengths measured in millions of years, were then multiplied by the evolutionary rates to yield the trees, with branch lengths measured in average number of substitutions/site, which were then used to simulate the artificial alignments. All evolutionary parameters used in the simulation were sampled from probability distributions inferred from real data. Tree topologies, substitution rates, gene lengths, and evolutionary model parameters used in the simulation listed below.
Tree topologies
Three different topologies were created to investigate the influence of tree shape on phylogenetic inference using the SM, ST, and SppT approaches (Fig. 1). All three topologies contained 64 terminals. The first was completely symmetric (Fig. 1A) and the second, completely pectinate (Fig. 1B). The third topology (Fig. 1C) was adapted from the phylogeny of Dunn et al. 24 In all topologies, root age was set at 500 Ma and the time duration of each branch was set proportionally along the tree (Fig. 1).
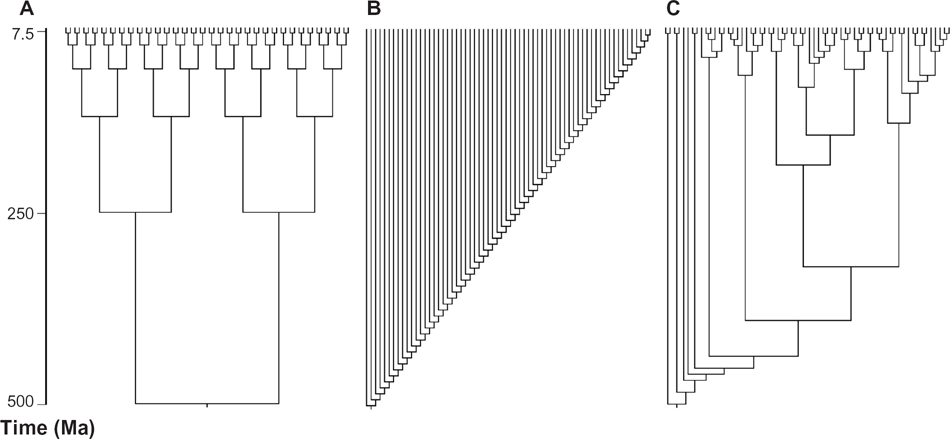
Tree topologies used in this study. Branch lengths are proportional to time in million years. (A) Symmetrical tree, (B) asymmetrical tree and (C) biological tree topology.
Substitution rates
The empirical distribution of evolutionary rates (Fig. 2A) was obtained from alignments of orthologous gene pairs from

Empirical distribution of (A) evolutionary rates and (B) gene length.
Sequence lengths
Sequence pairs collected in OrthoMCL were also used to obtain the empirical distribution of nucleotide sequence lengths used in the simulation analyses (Fig. 2B).
Substitution model parameters
The HKY + G4 model of sequence evolution was used to simulate the in silico alignments. The parameters of the model were the transition/transversion ratio (κ), the alpha parameter of the gamma distribution (a), and the equilibrium nucleotide frequencies (πA, πT, πC and πG). We obtained the probability distribution of these parameters by analyzing 6,673 alignments of ten species of Mammalia (
Sampling strategy
To incorporate the correlation between parameters, we adopted the following sampling procedure. To make an artificial gene, we first sampled an evolutionary rate from the empirical distribution. We then independently sampled a gene length. The evolutionary rate and gene length were not correlated in the empirical data, so this independent sampling procedure is justified. To avoid complicated correlations between evolutionary rate and each model parameter, we accessed empirical values for κ, α, πA, πT, πC and πG from all genes and sampled them together according to the rate estimated for the corresponding alignment.
Finally, biological sequence simulation requires trees with branch lengths measured in substitutions/site. Therefore, each branch of the ultrametric trees displayed in Figure 1 (measured in Ma) was multiplied by an evolutionary rate determined by the mean rate sampled. The evolutionary rate used in this calculation was obtained by sampling from a uniform distribution with a mean equal to the mean rate and a standard deviation set to 0.001 and 0.0001, as described below.
Simulation software
We simulated 30 sets of genes for each topology with each standard deviation in the rate distribution. In each set, we performed the previous sampling strategy 50 times to simulate 50 genes for each of the three tree topologies. Simulations were conducted in the EVOLVER program of the PAML 4.4 package. 7
Phylogenetic analysis and comparison of topologies
Maximum likelihood (ML) phylogenetic inference was implemented in PhyML 3.0 using the HKY85 + G4 model of sequence evolution. The ML topologies were estimated for each gene individually and for the SM composed of the concatenated alignments of the 50 genes in each set. Individual gene topologies were submitted to MRP29–31 using Clann 32 to construct matrices that were later submitted to Paup. 33 For SppT, the PHYBASE package 34 of the R programming environment (www.r-project.org) was used to implement STAR and STEAC analyses, both using the Neighbor-Joining method. We also evaluated the robustness of the phylogenetic tree inferences derived from the SM, ST, and SppT methods to violations of the evolutionary model. To this end, we conducted all analyses using the JC69 model of sequence evolution.
Comparisons between inferred tree topologies and true phylogenies were performed in the ape package 35 of the R programming environment with the Penny and Hendy 36 distance (HP distance) and by the TreeCMP method. 37 The algorithm also implements the Rzhetsky and Nei correction 38 to consider polytomies. This method disregards branch lengths.
Empirical data set
To construct the empirical data sets, we have selected 16 mammal species with genomes currently under assembly (www.ensembl.org) and with well-supported phylogenetic affinities. The species selected were

Standard mammal phylogeny assumed in this study.
Using the empirical data, we constructed 100 sets of genes selected from the 2,699 orthologous alignments. In each set, sampling was performed to construct an alignment with at least 80,000 nucleotide sites. The genes were sampled until this minimal number of sites was reached. The phylogenetic analysis was conducted as described for the simulated data. However, model choice was implemented using the BioPerl Modeltest function. Again, trees were compared using the same metrics applied in the analysis of the simulated data.
Results
Figure 4 shows the percentage of recovery of the true tree for empirical and simulated sequences, as based on the phylogenetic methods used (SM, ST, and SppT estimation, respectively) and simulation conditions (high and low between-lineages evolutionary rate variation). The results obtained using the HP distance and the TreeCmp method were in agreement, thus we only present the statistics for the HP distance. The analyses using simulated datasets and based on a symmetrical topology tree recovered the true tree in all instances, regardless of rate variation within branches and the model used in the reconstruction of the phylogeny (HKY and JC). These results are likely to be related to the lack of short branches on deep nodes of the topology, and were omitted from Figure 4.

Percentage of true tree recovery in empirical analyses compared with simulation results for different evolutionary models and rate variation between lineages (rv). (A) Supermatrix analyses (maximum likelihood on PhyML 3.0); (B) supertree analyses (MRP); and (C) both species tree methods–-STAR and STEAC.
The empirical analyses showed recovery rates of 82% for the ST method, followed by 60% and 58% for the SM and STAR SppT methods, respectively. Only the STEAC SppT method recovered the true tree in less than 50% of analyses. Overall, the SM method leads to higher recovery rates than the ST and SppT approaches when the simulation is simpler. The latter phylogenetic methods, in turn, had a higher rate of success at recovering the true phylogeny under high rate variation for both evolutionary models investigated. In the next sections we detail these results for each of the methods investigated.
Supermatrix
In the analyses based on the asymmetrical topology, the SM approach (Fig. 4) recovered the correct tree in all of the simulations performed under low rate variations and with the same model used in the simulation. Accuracy was slightly lower in those analyses using a simpler model proving that the method is highly robust and resists evolutionary model violation. The effect of higher rate variation was stronger and when the less parametric model was tested with higher rate variance; the true tree was recovered in less than 15% of analyses. This last scenario was the only one for this topology in which the use of SM based on simulated sequences performed worse than that based on empirical sequences.
The SM analyses based on a biological topology followed a similar pattern. However, all recovery rates were higher for this simulated topology. SM analyses had over 45% recovery rate for the true tree in simulations under the less parametric model and higher rate variation, with the smaller recovery rate for this topology.
Supertree
The ST method (Fig. 4) was associated with the highest recovery rate when based on the use of empirical sequences. The results of the analysis with empirical data were, however, largely inconsistent with those based on simulated sequences. In the analysis assuming an asymmetrical tree topology, low rate variation and the correct evolutionary model recovery rates were close to 64%. These rates dropped to 10%, however, in the analyses under the less parametric model. None of the analyses conducted assuming higher rate variation recovered the true phylogenetic tree. This also shows that the ST method was not robust and had a drastic loss in recovery rate in cases with model violation.
The analyses based on the same model used in the simulation, and assuming a low rate variation, produced results similar to those conducted under the same scenario but based on an asymmetrical topology. As expected, the analyses assuming a less parametric model choice had a slight reduction in true tree recovery rates. However, the analyses with higher rate variation were associated with higher recovery rates than those under the same model and low rate variation. Interestingly, analyses with the same model used in simulation for biological topology were associated with higher recovery rates than those produced using empirical sequences, the only case for this method.
Species tree
Two SppT methodologies were evaluated (Fig. 4). In both cases, the rate with which the true phylogeny was recovered using empirical data was lower than those observed using the other two approaches. The performance of the STAR method was only slightly inferior to that of the SM, whereas STEAC was associated with a very poor performance.
In the analyses based on the asymmetrical topology, STAR and STEAC true tree recovery rates were lower than empirical. Also, for both methods, analyses under higher rate variation and less parametric models showed drastic reductions in recovery rates. STEAC was unable to recover the true tree on any analysis under less parametric model or higher variation of rates. STAR analyses, conversely, had a small percentage when only one of these difficulties was applied, but was also unable to recover the true tree in any analyses in the most difficult scenario.
Analyses based on biological topology had a completely different result. Simulation results outperformed empirical in almost every case. The only case where simulated results were inferior to empirical was STAR method analyses under the same model used for simulation with low rates. This was also the only case in which analyses under the same model of the simulated data had worse results than its replicate under the less parametric model.
SppT analyses based on biological topology also showed an increase in performance when a higher variation of evolutionary rates was used in sequence simulation.
All analyses made under the same model used in the simulation performed much better than their replicates analyzed under the less parametric model, as seen for ST analyses. This indicates that SppT methods are not as robust as SM and, therefore, are susceptible to error when some parameters of evolutionary models are disregarded.
Discussion
We sought to evaluate the extent to which biological sequence simulation may affect the assessment of the performance of SM, ST, and SppT methods under different assumptions regarding the topology, substitution rates, and the evolutionary model. Our results showed that simulated sequences produce a biased assessment of performance of these methods. In the less challenging scenario, when sequences evolved under low between-lineage rate variations, a bias towards a seemingly superiority of the SM method was observed. Conversely, under higher rate variations, SppT methods were favored. Although SM analyses did not perform better than ST in empirical, it is important to mention that it was the only method that was robust to evolutionary model violations.
The ST was the method with the highest performance in the analyses using empirical data. In simulated data, however, ST yielded lower recovery percentages in nearly every scenario simulated. Therefore, there is a bias against ST analyses in simulations. This is especially true for the analyses based on the asymmetrical topology, in which the ST method had the worst performance. This poor performance of ST on recovering the asymmetrical topology may be explained by the presence of very short branches, which have been previously reported to hamper the MRP algorithm. 41 In this study, the authors also argue that very short branches may be unrealistic. During the evolution of several lineages, however, episodes of rapid diversification frequently occur, resulting in short internal branches. 42
Unfortunately, studies that have incorporated more realistic simulation strategies to evaluate phylogenetic methods generally considered trees with a reduced number of terminals.43–45 Swenson et al 46 is an exception, since they used a large number of terminals in their comparisons. As reported here, they also found SM approaches to outperform ST in most simulated scenarios. Moreover, their analysis showed that increasing the number of taxa also increased the relative advantage of SM over ST. The same pattern was found by Kupczok et al, 21 who used datasets with 25 and 69 taxa. Their results imply that incongruent gene trees, which are biologically expected in empirical data due to population-level phenomena, can have a negative effect on SM. This may explain the failure of SM in empirical data analysis. In this sense, ST and SppT methods are more efficient for identifying the true phylogenetic signal in cases where conflict between gene trees exists.
SppT methods, as implemented in STAR and STEAC, presented very different performances, with STAR having true tree recovery rates that were always higher than STEAC. Recently, Liu et al 47 also showed that STAR outperformed STEAC in all of the simulations tested. In this work, in contrast to the present study, the authors did not conduct a comparison between the SppT algorithms and SM or ST methods; moreover, the number of terminals used was small. The good performance of STAR was also reported by Allman et al. 48 In the present study, although STAR outperformed STEAC, its general performance was not superior to SM and ST.
In conclusion, in this study we have shown that the evaluation of the performance of phylogenetic methods that deal with multi-loci data sets may be seriously biased if the simulation of biological sequences is overly simplistic. Thus, to accurately incorporate the complexity of empirical data sets, simulation software should not only consider indels, but also the discordance between gene trees and the SppT that naturally occur in real data due to the action of population-level phenomena.
Footnotes
Acknowledgements
This study is part of the requirements for BOA's doctoral degree in genetics at the Federal University of Rio de Janeiro.
Author Contributions
Conceived and designed the experiments: BOA, CGS. Analyzed the data: BOA. Wrote the first draft of the manuscript: BOA, CGS. Contributed to the writing of the manuscript: BOA, CGS. Agree with manuscript results and conclusions: BOA, CGS. Jointly developed the structure and arguments for the paper: BOA, CGS. Made critical revisions and approved final version: BOA, CGS. All authors reviewed and approved of the final manuscript.
Funding
This work was funded by Brazilian Research Council (CNPq) grant 308147/2009–0 and FAPERJ grants E-26/103.136/2008, 110.838/2010, 110.028/2011 and 111.831/2011 to CGS.
Competing Interests
Author(s) disclose no potential conflicts of interest.
Disclosures and Ethics
As a requirement of publication the authors have provided signed confirmation of their compliance with ethical and legal obligations including but not limited to compliance with ICMJE authorship and competing interests guidelines, that the article is neither under consideration for publication nor published elsewhere, of their compliance with legal and ethical guidelines concerning human and animal research participants (if applicable), and that permission has been obtained for reproduction of any copyrighted material. This article was subject to blind, independent, expert peer review. The reviewers reported no competing interests.