
Abstract
Inhibiting Hsp90 chaperone roles using 17AAG induces cytostasis or apoptosis in tumor cells through destabilization of several mutated cancer promoting proteins. Although mitochondria are central in deciding the fate of cells, 17AAG induced effects on tumor cell mitochondria were largely unknown. Here, we show that Hsp90 inhibition with 17AAG first affects mitochondrial integrity in different human tumor cells, neuroblastoma, cervical cancer and glial cells. Using human neuroblastoma tumor cells, we found the early effects associated with a change in mitochondrial membrane potential, elongation and engorgement of mitochondria because of an increased matrix vacuolization. These effects are specific to Hsp90 inhibition as other chemotherapeutic drugs did not induce similar mitochondrial deformity. Further, the effects are independent of oxidative damage and cytoarchitecture destabilization since cytoskeletal disruptors and mitochondrial metabolic inhibitors also do not induce similar deformity induced by 17AAG. The 1D PAGE LC MS/MS mitochondrial proteome analysis of 17AAG treated human neuroblastoma cells showed a loss of 61% proteins from membrane, metabolic, chaperone and ribonucleoprotein families. About 31 unmapped protein IDs were identified from proteolytic processing map using Swiss-Prot accession number, and converted to the matching gene name searching the ExPASy proteomics server. Our studies display that Hsp90 inhibition effects at first embark on mitochondria of tumor cells and compromise mitochondrial integrity.
Introduction
The Hsp90 protein in association with many transcription factors, signal transduction receptors and kinases, proteins such as actin and tubulin promotes cell survival.1–3 Between normal and tumor cells, Hsp90 from tumor cells displays high affinity for binding and stabilizing mutated oncoproteins. Therefore pharmacological inhibition of Hsp90 using anti-Hsp90 drugs such as 17AAG has emerged as a novel antitumor strategy to combat cancer. The Hsp90 inhibition thus destabilizes Hsp90 binding with the client proteins, which induces either cytostasis or apoptosis.4,5
The mainstream of cancer treatments employs agents to impede cell division and growth signals. Mitochondria are the focal points for a large variety of pro- and antiapoptotic stimuli 6 ; therefore play essential role in the stress-induced cellular programming. 7 Cancer cells are more active than normal cells in metabolic reactive oxygen species (ROS) generation and therefore are constantly exposed to oxidative stress. 8 Neoplastic lesions are also associated with altered mitochondrial morphology corroborating with abnormal mitochondrial energetics, thus deciding the fate of tumor initiation, progression and regression. 9 An association between mitochondrial dysfunction and cancer has already been reported by Warburg in the early 1930. 10 The differences in the molecular composition of the mitochondrial inner membrane between normal and cancer cells majorly encompass the increased levels of cholesterol, varying the total phospholipid content and the changes in individual phospholipids. 11 These differences provided information on the sensitivity and stability of tumor mitochondria.
Differences between normal cells and cancer cells offer the potential for clinical use of mitochondria as markers for the detection of cancer and also suggest that mitochondria ought to be potential targets for anticancer agents. Pervasively mitochondrial defects play important roles in the development and progression of cancer,12,13 as a consequence inducing mitochondrial dysfunction thought to induce irreversible cell damage.14,15 In eukaryotic cells, mitochondria form a tubular network, 16 and the mitochondrial reticulum preserves the mitochondrial topology. 17 Shortly, after the discovery that mitochondrial membrane potential (MMP) is often damaged in cancer, mitochondria have become the attractive target to induce apoptosis and to overcome resistance to chemotherapy.13,18 In comparison with the conventional chemotherapeutic drugs that aimed at one or two signaling pathways, Hsp90 inhibitors inhibit all the six hallmarks of cancer, therefore Hsp90 inhibition proposed to act as a combinatorial attack on cancer cells.19–21 This increased the possibility that Hsp90 inhibitors may also display tumor selective targeting of mitochondria.
Mitochondria are morphologically vibrant organelles 22 ; therefore Hsp90 inhibitors may disrupt mitochondrial homeostasis in cancer cells. Large portion of mitochondrial proteins is not made but imported from nuclear coded genes with the help of Hsp90 and Hsp70 chaperone machines. And any interference with either of the chaperone machinery therefore hinders import of mitochondrial proteins. In support of this speculation, Margineantu et al 23 have showed that Hsp90 inhibitors induce accretion of mitochondrial proteins, which was majorly due to the decreased mitochondrial protein turnover. There were no reports that how Hsp90 inhibition directly affects the mitochondria. Given that an early mitochondrial changes decide the fate of cells, 24 we examined the effect of 17AAG on mitochondrial swelling, changes in mitochondrial membrane potential and the mitochondrial architecture in normal and different human tumor cells. From the morphological and proteome analysis, we report that 17AAG effectively targets tumor cell mitochondria.
Materials and Methods
Materials
17 AAG obtained from invitrogen (Invitrogen, USA). Radicicol, cisplatin, novobiocin, rotenone, cycloheximide, cyclosporine A, cobalt chloride, vincristine, cytochalasin D, diferuloylmethane, calcium chloride, dichlorodihydrofuorescein (DCFDA) procured from Sigma (Sigma-Aldrich). The fluorophores, DiOC6(3) and JC-1, protonophore CCCP, CMXRos (Mitotracker Red), DAPI purchased from Invitrogen- Molecular Probes (Invitrogen). DMEM (Dulbecco's Modified Eagle's Medium), penicillin, streptomycin and FBS (fetal bovine serum) were from Gibco BRL Research Laboratories (Gibco-BRL Ltd). The anticytochrome c and peroxidase conjugated antirabbit IgG antibody purchased from (SantaCruz), Chemilumeniscence western blotting kit purchased from Roche.
Isolation of mitochondria from rat liver
Freshly excised rat liver from male Wistar rat was minced in a Dounce homogenizer with pestle in a sucrose buffer (20 mM mannitol, 70 mM sucrose, 1 mM EGTA, 10 mM Hepes and 1x protease cocktail) to single suspension and subjected to differential centrifugation. The mitochondria isolated by modified differential centrifugation procedure, homogenized sample centrifuged at 1000 × g for 10 min at 4 °C, supernatant collected and recentrifuged at 12000 × g for 15 min. The pellet considered as crude mitochondrial fraction, optical density measured at 590 nm, confirmed with immunoblot with anticox IV antibody, and used for ex vivo mitochondrial swelling experiments. All the animal experiments were carried out according to the institutional standards approved by the institutional ethical committee.
Cell cultures and treatments
Human neuroblastoma cells- IMR-32, human cervical cancer- HeLa, human glioblastoma cells-HNGC2, human liver cancer cells- HepG2 obtained from American Type Cell Culture (ATCC). Cells maintained in DMEM containing 10% FBS in the presence of penicillin (100 U/ml) and streptomycin (50 μg/ml) at 37 °C in a humidified incubator with 5% CO2 supply. For treatments, 1 × 10⁵ cells grown on cover glass (22 × 22 mm, Fisher Scientifics) in a 6-well culture dish (Nunc) incubated in complete medium with the drug at different time intervals. Different concentrations of 17AAG (0.5 μM-10 μM) tested with tumor cells and the effective drug concentration standardized by analyzing its ability to degrade 80% Hsp90 client protein, Raf-1. Other drug concentrations standardized by cytotoxicity or cell cycle inhibition using trypan blue exclusion or Fluorescence Activated Cell Sorting (FACS) of propidium iodide (PI) stained cells respectively. The stock solutions of drugs 17AAG, radicicol, cisplatin, paclitaxel, diferuloylmethane, rotenone, cyclosporine A and cytochalasin D were prepared in dimethylsulfoxide. The vincristine, cobalt chloride, novobiocin, calcium chloride and digitonin were prepared in double distilled sterile water. Hydrogen peroxide (H2O2) was diluted and used either in the culture medium or buffer directly from the stock.
Subcellular fractionation of mitochondria from tumor cells
Briefly, normal and tumor cells were washed with PBS, and resuspended in isotonic buffer A (20 mM mannitol, 7 mM sucrose, 1 mM EGTA, 10 mM HEPES, pH 7.5), supplemented with protease inhibitors (1 mM phenylmethylsulfonyl fluoride; PMSF, 10 μg/mL leupeptin, 10 μg/mL pepstatin A, 10 μg/mL soybean trypsin inhibitor, and 10 μg/mL aprotinin), and homogenized gently using Dounce glass homogenizer with 40 strokes. The sample was centrifuged at 3500 rpm for 10 min and the supernatant was collected and recentrifuged at 12,000 rpm for 10 min (Sorval 5B, SS34 rotor). The pellet containing the mitochondria was suspended in a buffer (400 mM mannitol, 50 mM Tris.Cl, pH 7.2, 5 mg/ml BSA, 10 mM KH2PO4) and used for further experiments.
Monitoring the ex vivo swelling of mitochondria
The isolated mitochondria (0.5 mg/ml) from normal rat liver and human neuroblastoma cells were incubated in a KCl-based buffer (150 mM KCl, 25 mM NaHCO3, 1 mM MgCl2, 1 mM KH2PO4, 20 mM Hepes, 1 mM Glutamate and 1 mM Malate, pH 7.4). Mitochondrial swelling was measured as a decrease in the optical density at 520 nm using a split beam spectrophotometer (Perkin-Elmer, Cetus). The mitochondrial swelling was induced with 150 μM Ca2+ and 0.1 mM inorganic phosphate. For recovery, 100 μM CsA was added to the reaction mixture. The absorbance was measured for 30 min with each treatment and the values obtained were converted to percentages.
Cytochrome c assay
The cytochrome c assay was performed colorimetrically by cytochrome c reduction using potassium ferricyanide [K3Fe(CN)6]. The conversion of heme ions from Fe3+ to Fe2+ was monitored by adding sodium hydrosulfide (Na2S2O4). The difference in oxidized and reduced cytochrome c was measured at 550 nm and 542 nm respectively. The cytochrome c release was calculated using the following formula,
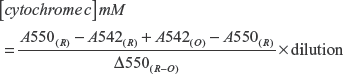
The cytochrome c values represented in the bar diagram were normalized with control and expressed in percentages.
Measurement of change in mitochondrial membrane potential (Δψm)
The Δψm quantified by flow cytometric analysis of cells stained with JC-1. Cells after respective drug treatments were incubated with 40 nM of JC-1 in the presence or absence of 50 μM CCCP for 15 min at 37 °C. The fluorescence was measured by fluorescence activated cell sorter (MoFlo, Becton-Dikinson, SanJose, CA) and analyzed using Cell-Quest software. The values obtained as ratio between dual florescence red versus green was measured and normalized with control fluorescence. Similarly for some experiments, DiOC6(3) was employed to measure the change in the membrane potential. A decrease in green florescence indicated as a change in the membrane potential. The values obtained were converted to percent change and represented in a bar diagram.
Transmission electron microscopy (TEM)
Cells untreated and drug treated were fixed with 5% glutaraldehyde solution in 0.1 M sodium cacodylate buffer (pH 7.4) and post fixed using 1% osmium tetroxide in 0.1 M sodium cacodylate buffer. Cells washed with 0.1 M potassium phosphate buffer, pH 7.4, and dehydrated with increasing acetone concentrations (30%, 50%, 70%, 90% and 100%). First the cells were treated with propylene oxide and polymerized with araldite resin (1:1 ratio) in silicon moulds. Cells were sectioned using Reichert Ultracut-S ultramicrotome, thin sections (80 nm) placed on copper grids, washed with sterile double distilled water, stained with Uranyl acetate (2%) for 30 min and observed with a JEOL transmission electron microscope (Model JEM-2010, Tokyo, Japan).
Laser scanning confocal microscopy
Untreated and treated cells were incubated in a medium containing 50 nM of MitoTracker Red for 30 min at culture conditions. Cells were washed and fixed with 4% paraformaldehyde for 15 min, and permeabilized with 0.1% Triton X-100 for each 10 min. The cover glasses after PBS wash were mounted on to the glass slides with ProLong Antifade reagent containing DAPI (50 nM, Invitrogen), sealed with nail polish and observed using laser scanning confocal microscopy (Leica TCS SP5).
Reactive oxygen species (ROS) measurements by flow cytometry analysis (FACS)
The untreated and 17AAG treated cells for 6 h, 12 h, and 24 h intervals were first washed with PBS, incubated with 2 μM 2′-7′-dichlorofluorescin diacetate (DCFDA) for 15 min, 37 °C in the dark. The dye DCFDA can passively diffuse into cells and is colorless and nonfluorescent until the acetate groups are cleaved by intracellular esterases to yield the fluorescent fluorophore, 5-(and-6)-carboxy-2′,7′-dichlorofluorescein (DCF). The cells were washed twice with PBS and the intensity of DCF fluorescence was measured by FACS (FACS Calibur).
Gel electrophoresis and in-gel digestion for 1D PAGE LC- MS/MS
For each 1D PAGE LC-MS/MS experiments 40 μg of the mitochondrial preparation from untreated and drug treated cells (9 × 10⁷) fractionated on a 12% SDS-PAGE. The gels were stained with Coomassie Brilliant Blue (R250) for one hour, destained and washed with MilliQ water several times. Each gel lane was sliced and washed 3 times for 30 min each in 50% Acetonitrile (ACN) with 25 mM Ammonium Bicarbonate (ABC, pH 8.0) to remove excess Coomassie stain, followed by one wash with 50% ACN, and the final wash with 100% ACN without bicarbonate buffer each for 5 min to dehydrate the gels. Excess ACN was removed and the gel slices were vacuum dried for 30 min. The dried gels were rehydrated and trypsinized with 30 μl cold Trypsin (Promega) solution (10 μg/ml in 25 mM ABC pH 8.0) and incubated at 37 °C for 16 h. The tryptic peptides were extracted by soaking the gel slices in 50 μl of 50% ACN and 5% trifluoroacetic acid (TFA) for 60 min with gentle agitation at room temperature. The supernatant was collected and transferred to a second clean microfuge tube. The gels were extracted again with another 50 μl aliquot of 50% ACN and 5% TFA for 60 min. The two extracts were pooled and vacuum dried to complete dryness for one hour. The samples were reconstituted in 12 μl of 5% ACN and 0.1% TFA and loaded on SDS-PAGE.
1D PAGE LC-MS/MS analysis
All 1D LC-MS/MS experiments were carried out using ESI- mass spectrometer with linear ion trap mass analyzer (LTQ-IT; Thermo Fischer, Waltham, MA, USA), equipped with Finnigan Surveyor MS Pump Plus. The sample (10 μl) was loaded with constant flow of 2 μl/min onto a reverse phase Micro LC column BioBasic C18 (ThermoFisher, Waltham, MA, USA). Peptides eluted on a gradient of 90 min for each gel slice starting with 95% water, 5% ACN, 0.1% TFA for the first 20 min in which 10 min were for retention of peptides in the sample buffer. Acetonitrile gradient was set from 5%-95% over the next 70 min followed by 95% water wash for the last 10 min. Chromatographically separated peptides were sprayed through a 20 cm metal needle emitter and the mass spectrometer ran in the data-dependent mode to gain MS and MS/MS spectrums switching automatically between MS and MS/MS modes. One full MS scan from 200 to 2000 m/z was followed by 7 data-dependent MS/MS scans recorded. The electrospray voltage was set at 4.5 kV, and capillary temperature at 200 °C. The peptides fragmented using CID with normalized collision energy of 35%. Top 7 precursor ions were selected for MS/MS analysis. The raw files picked up were compiled and subjected to bioinformatics analysis.
Bioinformatics analysis
The mass spectrums searched against the protein sequences of the IPI human database (version 37) from NCBI using SEQUEST algorithm were incorporated in the BioWorks Browser (Version 3.2 EF2, Thermo Electron Corporation.). Enzyme specificity was set to full trypsin digestion with only one missed cleavage. Methionine oxidation was set as a variable modification. The other parameters were set as follows: precursor ion tolerance as 1 amu and fragment ion tolerance as 0.35 amu. Peptide identification was accepted if they passed the filter set to delta CN value as 0.100, Rsp as 5, Xcorr vs charge values as 1.90 (+1 charge), 2.20 (+2 charge) and 3.30 (+3 charge) and protein probability as 0.001. Protein identifications were accepted only if they contained at least one unique peptide (from untreated and 17AAG treatments).
Statistical analysis of the data
Data represented as SE ± mean. The control groups were compared with drug treated group and the significance value was calculated by paired student's t-test using SigmaPlot 11 software. A p value, < 0.05 was accepted as significant.
Results
17AAG treatment induces ex vivo mitochondrial swelling
17AAG selectively binds to the N-terminal ATP-binding region of Hsp90, therefore competes with ATP for binding. In tumor cells, Hsp90 exists in a high affinity conformation therefore compared to normal cells it displays a 100-fold higher affinity towards 17AAG binding. 25 Mitochondrion swelling is a hallmark of mitochondrial dysfunction. 26 Isolated mitochondria undergo swelling because of opening nonselective permeability transition (PT) with uptake of water and solutes when exposed to various uncouplers. 27 PT pores have two open conductance states, after low-level of induction regulated PT pores opened by Ca2+ can be blocked by CsA, but after higher levels of induction unregulated PT pores are Ca2+ independent and CsA insensitive. 28
Many chemotherapeutic drugs are known for opening of PT pores, and CsA inhibits PT pore opening induced by such drugs. We wanted to test whether 17AAG has any effect on PT pore opening, if so, we wanted to examine whether it is CsA dependent or independent. Towards this, the isolated mitochondria from normal and tumor cells were examined for ex vivo mitochondrial swelling either with 10 μM 17AAG or 150 μM calcium for 30 min in the presence and absence of CsA. Normal mitochondria treated with Ca2+ showed 84% swelling and a 63.3% recovery with CsA, while 17AAG treatment showed 31% swelling and the CsA treatment reversed 17AAG induced swelling only by 25.7% (Fig. 1A, P, < 0.001). In human neuroblastoma, the ex vivo mitochondrial swelling observed with Ca2+ was 86.2% and with 2 μM 17AAG it was found to be 66.4%, which was almost double to 17AAG induced mitochondrial swelling in normal cells. Between 17AAG and Ca2+, Ca2+ treated cells showed 55.3% recovery with CsA and with 17AAG treatment there was only 22.7% recovery (Fig. 1B, P, < 0.001). Since primary cell mitochondria used in the present study arose from liver cells, human hepatocellular carcinoma cells were used to study the drug effects. Similar to the results obtained with human neuroblastoma, in hepatocarcinoma cells, while Ca2+ induced swelling recovered by cyclosporine A, 17AAG induced swelling showed only a slight recovery (Fig. 1C, P, < 0.001). These findings suggested that 17AAG undeniably is responsible for the irreversible mitochondrial swelling in tumor cells. Since 17AAG induced effects on mitochondria were specific to tumor cells, we used only human neuroblastoma tumor cells for later experiments.
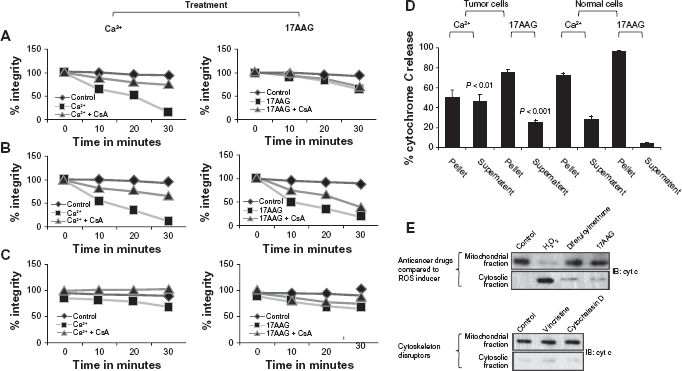
Effect of 17AAG treatment on ex vivo mitochondrial swelling and cytochrome c release.
To understand whether ex vivo mitochondrial swelling correlates with mitochondrial damage through cytochrome c release, 29 cytochrome c reduction assay was performed after 2 h incubation of mitochondria with 10 μM 17AAG, 150 μM Ca2+. The assay was performed using potassium ferricyanide reduction from separating the supernatant and pellet fractions of mitochondria after centrifugation at 4000 rpm for 15 minutes. Calcium induced an extra 1.6-fold (P, < 0.01) and 17AAG induced 6.6-fold (P, < 0.001) cytochrome c release from the mitochondria of tumor cells was compared to the mitochondria from normal cells (Fig. 1D). To study the effect of 17AAG on mitochondria integrity, IMR-32 cells were examined for cytochrome c release with different anticancer agents like diferuloylmethane, vincristine, cytochalasin D and hydrogen peroxide for 8 h in comparison with cells treated with 2 μM 17AAG. After respective drug treatments, the mitochondria and cytosolic fractions were separated and immunoblotted with anticytochrome c antibody. While diferuloylmethane, vinscristine and 17AAG showed retention of cytochrome c in the mitochondria, H2O2 treatment damaged mitochondria, as measured by the release of cytochrome c (Fig. 1E).
17AAG treatment induces change in mitochondrial membrane potential (Δψm)
The mitochondrial membrane potential is a biomarker for mitochondrial damage. 30 To examine whether 17AAG treatment induces any change in Δψm, using a lipophilic cationic dye JC-1, we measured Δψm by FACS. Under normal physiological conditions, in healthy cells, the JC-1 dye stains the mitochondria bright red. The negative charge found out by the intact mitochondrial membrane potential allows the lipophilic dye, bearing a delocalized positive charge, to enter the mitochondrial matrix where it accumulates. The JC-1 dye aggregates in the mitochondria and the aggregates fluoresce red. When the mitochondrial membrane potential collapses, the JC-1 dye cannot accumulate in the mitochondria, therefore remains in the cytoplasm in a green fluorescent monomeric form. A decrease in the red/green fluorescence ratio was measured after 2 μM 17AAG treatment. We employed protonophore CCCP as a positive control to induce Δψm (Fig. 2A). 17AAG treatment showed a decrease in membrane potential by 28.82% in a 6 h treatment, which subsequently lowered to 10.12% by 12 h treatment and increased to 18.32% by 24 h treatment (Fig. 2B, P < 0.001) suggested the 17AAG induced mitochondria changes observed as early by 6 h treatment.
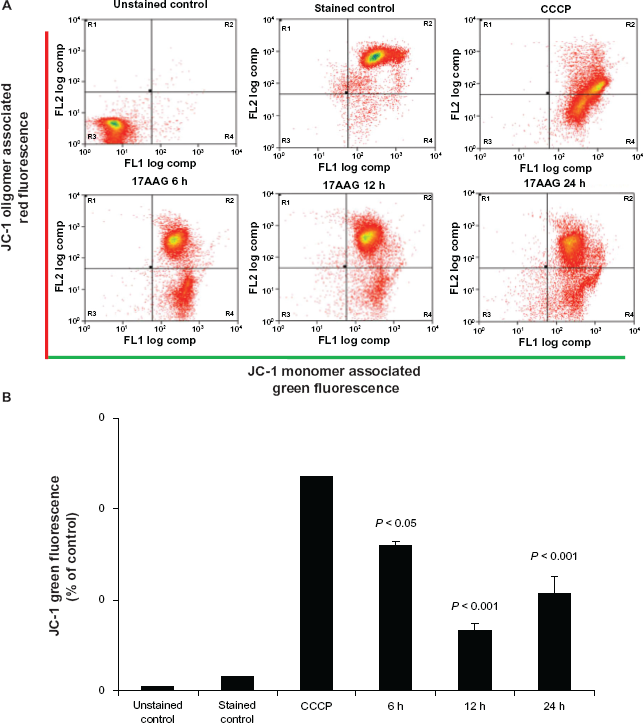
Fluorescence activated cell sorting analysis of mitochondrial membrane potential.
Effect of 17AAG and other Hsp90 inhibitors on mitochondrial deformity
Though the molecular basis of mitochondrial polarization is well explained by the chemiosmotic theory, it is also influenced by the intracellular and extracellular environments. 31 Besides intracellular and extracellular environments, a control over cell shape and size can also determine mitochondria integrity. 32 Therefore we recorded mitoarchitectural changes in IMR-32 cells on 17AAG treatment by laser scanning confocal microscopy, and saw mitochondrial deformity associated with mitochondria elongation in time-dependent manner (Fig. 3A). To explain the cell type specific effects of 17AAG, HeLa and HNGC2 cells were also treated with 17AAG and examined for mitochondrial changes. We followed 17AAG treatment induced elongation of mitochondria in both the cells types (Fig. 3B and 3C), implying the significance of Hsp90 inhibition in tumor cells in mitochondria targeting.
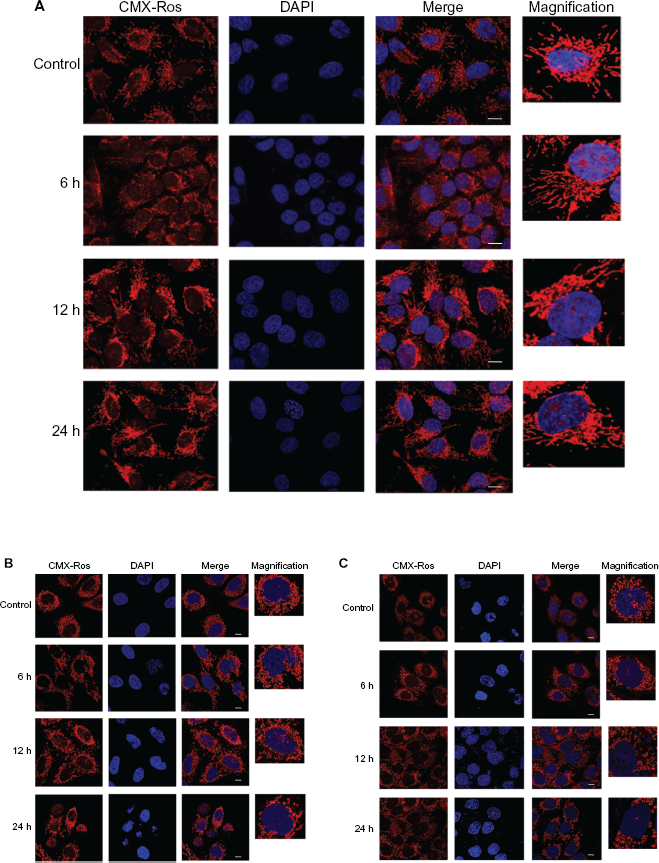
17AAG induced changes in mitochondrial morphology.
Several groups of Hsp90 inhibitor drugs were developed and set for preclinical evaluation. Among them, radicicol, cisplatin and novobiocin that are structurally unrelated to 17AAG but shown to inhibit Hsp90. Radicicol is a macrolactone antibiotic known to bind to the N-terminal domain of Hsp90. 33 Cisplatin is a platinum-based chemotherapeutic drug that binds both N- and C-terminal domains of Hsp90. 34 Novobiocin is aminocoumarin antibiotic that can specifically binds to Hsp90 at the C-terminal nucleotide binding pocket. 35 The neuroblastoma tumor cells were treated with 2 μM concentrations of radicicol and cisplatin, 0.1 mM concentrations of novobiocin for 8 h, and after staining with CMXRos cells were analyzed using laser scanning confocal microscope. To compare Hsp90 inhibition effects on mitochondria, nonHsp90 drugs, paclitaxel and vincristine were used at a concentration of 5 μM each at similar experimental conditions. In support of the data we obtained from 17AAG treatments in Figure 3, we noted similar mitochondria elongation effects with radicicol, cisplatin, and novobiocin, but not with paclitaxel and vincristine as the latter treatments induced formation of circular mitochondria (Fig. 4 A).
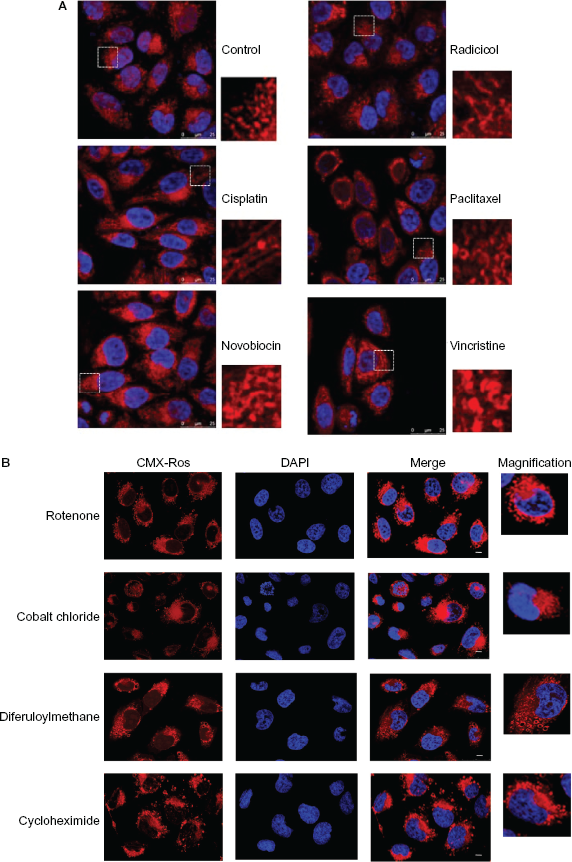
Analysis of mitochondrial morphology with metabolic inhibitor drugs.
From the previous results, we did not get any information whether Hsp90 inhibition is inducing metabolic block or merely altering the mitoarchitecture. Usually, mitochondrial changes reported when mitochondrial protein turnover blocked 36 or on mitochondrial dysfunction. 37 To understand mitoacrhitectural effects of 17AAG, we examined mitochondria of IMR-32 cells with metabolic inhibitors, rotenone 38 and cycloheximide, 39 and ROS inducers diferuloylmethane 40 and cobalt chloride. 41 We noted all the treatments resulting in forming spherical, giant mitochondria surrounding the nucleus (Fig. 4B), suggesting 17AAG induced mitoarchitectural changes may be independent of metabolic stress.
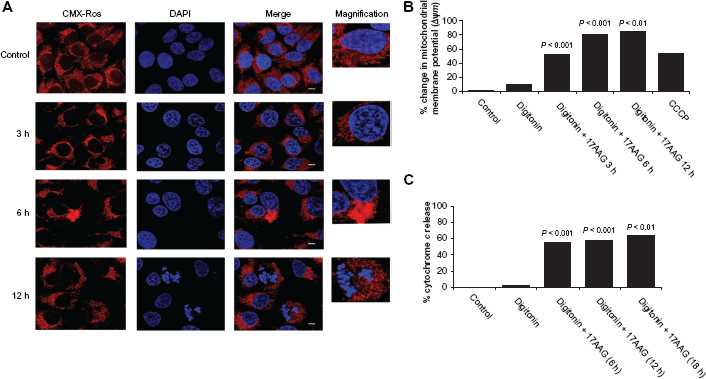
Effect of 17AAG on digitonin permeabilization
There were reports that digitonin combination with anticancer agents improves drug intake and increases anticancer effects. 42 Digitonin selectively disrupts the lipid membranes enriched in sterols. Digitonin complexes with unesterified 3-β-hydroxysterols including cholesterol and promotes to disrupt cholesterol-rich cellular membranes. Mitochondrial membrane also contains large amounts of cholesterol and can easily be disrupted by digitonin. However, in case of isolated mitochondria, digitonin causes nonspecific effects such as release of cytochrome c and Ca2+,43 and at higher concentrations such as 48 μM and 64 μM it causes similar changes. 44 Therefore in the present study, we have used 8 μM concentration of digitonin and this concentration is standardized in such a way that it should not affect mitochondrial integrity. Digitonin was used to promote 17AAG import to mitochondria and to study its mitochondria selective effects. A permeabilization of IMR-32 cells with digitonin (30 min) concentrations before 17AAG treatment neither resulted in elongation nor spherical formation of mitochondria, but induced apoptosis by 12 h (Fig. 5A) and on prolonged treatments (by 24 h treatment) cells were found unviable. Apoptosis activation has correlated with significant changes in Δψm and cytochrome c release (Fig. 5B and 5C).
Effect of reactive oxygen species (ROS) on early mitochondrial deformity
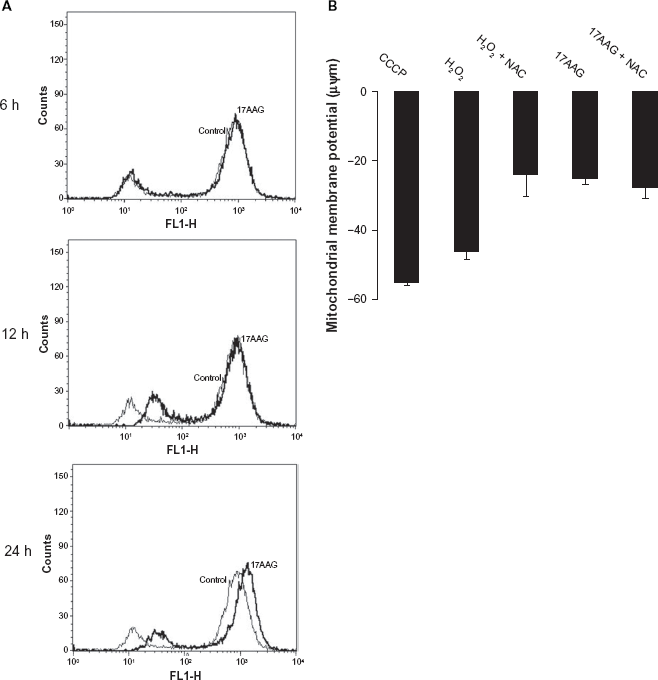
A gradual increase in mitochondrial depolarization in our study suggested a possible increase in the intracellular reactive oxygen species (ROS) 41 . Therefore we measured intracellular ROS levels using fluorophore DCFDA that passively diffuses into cells. The dye, DCFDA is colorless and nonfluorescent until the acetate groups are cleaved by intracellular esterases to yield the dichlorofluorescein (DCFH). The resulting DCFH reacts with ROS and forms dichlorodihydrofluorescein (DCF). An increase in DCF fluorescence is an indicative of increased cellular oxidation because of increased intracellular ROS measured. We saw a moderate increase in ROS levels with 17AAG treatment and especially at 6 h it is negligible (Fig. 6A). A gradual increase in ROS levels by 12 h and 24 h treatments may relate to mitochondrial signaling, functional blocking, thus resulting in damage to mitochondria. We also measured mitochondrial membrane integrity using DiOC6(3) by FACS in the presence and absence of ROS scavenger, N-acetyl cysteine (NAC, 1 mM), in combination with 17AAG (2 μM). Hydrogen peroxide (H2O2, 50 μM, 45 min) was used as a positive control to induce ROS. We noted a decrease in H2O2 induced negative change in mitochondrial membrane potential in combination with NAC but not with 17AAG combination suggesting that 17AAG induced effects may be independent of ROS (Fig. 6B).
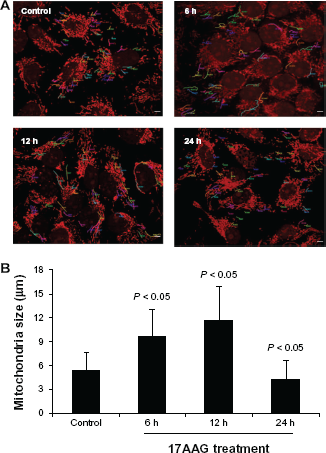
17AAG induced changes are because of increased elongation
To further confirm 17AAG induced mitochondrial elongation, laser scanning confocal images were subjected to morphometric analysis using the software provided with the Leica TCS SP5 microscope. Individual mitochondria were randomly painted with different colors and then each mitochondrion was measured (Fig. 7A, n = 60). We noted 81% and 118% increase in the mitochondria length after 17AAG treatment for 6 h and 12 h intervals respectively compared to untreated mitochondria. In a 24 h treatment, we saw 21% decrease in the length compared to control (Fig. 7B, P < 0.05). An increase in ROS levels by 24 h 17AAG treatment (Fig. 6A) may be playing a role in decreasing the mitochondrial elongation by affecting its role.
Morphometric analysis of mitochondria after 17AAG treatment.
17AAG treatment induces vacuolization and engorgement of mitochondria
To gain ultrastructural details of mitochondrion, TEM analysis was performed on 17AAG treated IMR-32 cells. From the electron micrographs we noted a time-dependent increase in both elongation and vacuolization of mitochondria after the drug treatment (Fig. 8A). To get statistical value from the electron micrographs, TEM images from different experiments were analyzed using ‘Gatan software’, and measured the length and thickness of individual mitochondrion. A representative bar diagram of mitochondrial length and thickness comparing the control (n = 20) and 17AAG treatment (n = 24) cells was plotted. A 4 h treatment resulted in a significant increase in mitochondrial length by 12% (P < 0.001) and thickness by 18% (P < 0.01), a 6 h treatment increased the length by 106% and thickness by 81% (P < 0.001). However, by 8 h of 17AAG treatment the length increased by 263% while the thickness showed only 85% (P < 0.001) increase (Fig. 8B).
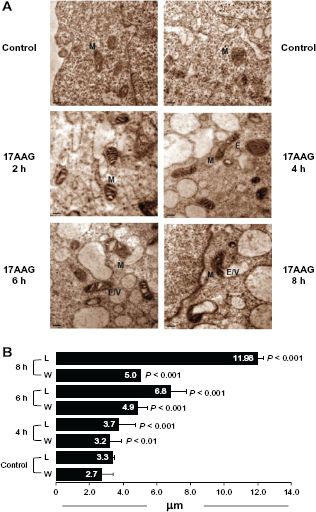
Transmission electron microscopic analysis of mitochondria.
Mitochondrial proteome of human neuroblastoma cells
The 2-DE is an extensively used method for proteome analysis; however, this approach provides information on total cell proteome. Our 2-DE of control IMR-32 cells gave 238 ± 3 (P < 0.001) and 17AAG treatment gave 195 ± 10 (P < 0.001) spots when counted on a CBB stained 2-DE gel. The results show that 17AAG treatment induces only 19% loss of total cellular proteins (data not presented). Since the total cell lysate contains majority of cytoplasmic and nuclear proteins, to enrich mitochondrial proteins in our study, we adapted 1D PAGE LC MS/MS analysis. The 1D PAGE LC MS/MS was majorly used for the analysis of low complex mixture of proteins separated by gel electrophoresis or treated as a mixture. Mitochondria preparations were examined for purity since several reports stated that the mitochondrial preparations contained cytoplasmic contamination. The mitochondrial purity was assessed by dot blot analysis of mitochondrial proteins, cox IV and mortalin (Fig. 9).
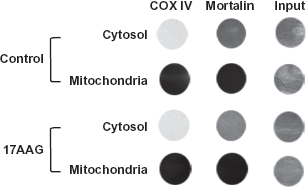
Confirmation of mitochondria purity by immunoblot analysis using dot blot technique. Five micrograms of protein used for spotting. Mitochondria marker proteins anticox IV and antimortalin antibodies were used for immunoblot analysis. The input represents equal loading of total proteins from Ponceau-S stained NC paper.
Annotated MS/MS spectrums from five independent experiments was compiled averaging to 927,54 spectrums in the control and 878,98 spectrums in the 17AAG treatment used for the present analysis. The molecular, biological and cellular component for each protein was assigned based on Gene Ontology (GO) classification 45 . The homologues of each protein were searched in NCBI Homologue database. 46
From the analysis, we found that from the control cells, out of 171 proteins, 119 were identified by at least one unique peptide sequence signature as mitochondrial proteins. Single peptide PMF identification and annotated spectrums are provided for each protein (Supplemental Fig. 1). A list of proteins that was identified from the analysis is enclosed as supplementary information with right protein ID, Gene ID and protein with respective peptide sequence (Table 1). The 17AAG treatment identified only 67 proteins with at least one unique peptide sequence. The IDs got by 1D PAGE LC MS/MS were filed to PRIDE database (www.ebi.ac.uk/pride) with the accession numbers, control: 12861–12870 and 17AAG treatment: 1364613650. From the primary assessment itself we found that 8 h 17AAG treatment resulted in loss of 61% proteins (Table 1). The major classes that emerged from this analysis were chaperones (11.76%), Ras family of proteins (6.72%), metabolic enzymes that included mitochondria, membrane and oxidative phosphorylation related (48.74%), cytoskeletal proteins (6.72%), ribosomal proteins (16.81%) and chromatin related proteins (9.24%). The presence of cytoskeletal proteins such as actin and actin-related proteins reinforces that mitochondria are tightly associated with cytoskeletal proteins. Hsp90 inhibition would have affected extramitochondrial roles such as import and several signaling events and further loss of several metabolic enzymes suggests functionally compromised mitochondria. The loss of DNA and RNA metabolism suggested the turn down of mitochondrial transcription and translation.
Peptide and protein identification in a comparative table format between control and 17AAG treated IMR-32 cells. The numbers under control and 17AAG treatment shows the number of peptides matched with the represented protein ID in our screening.
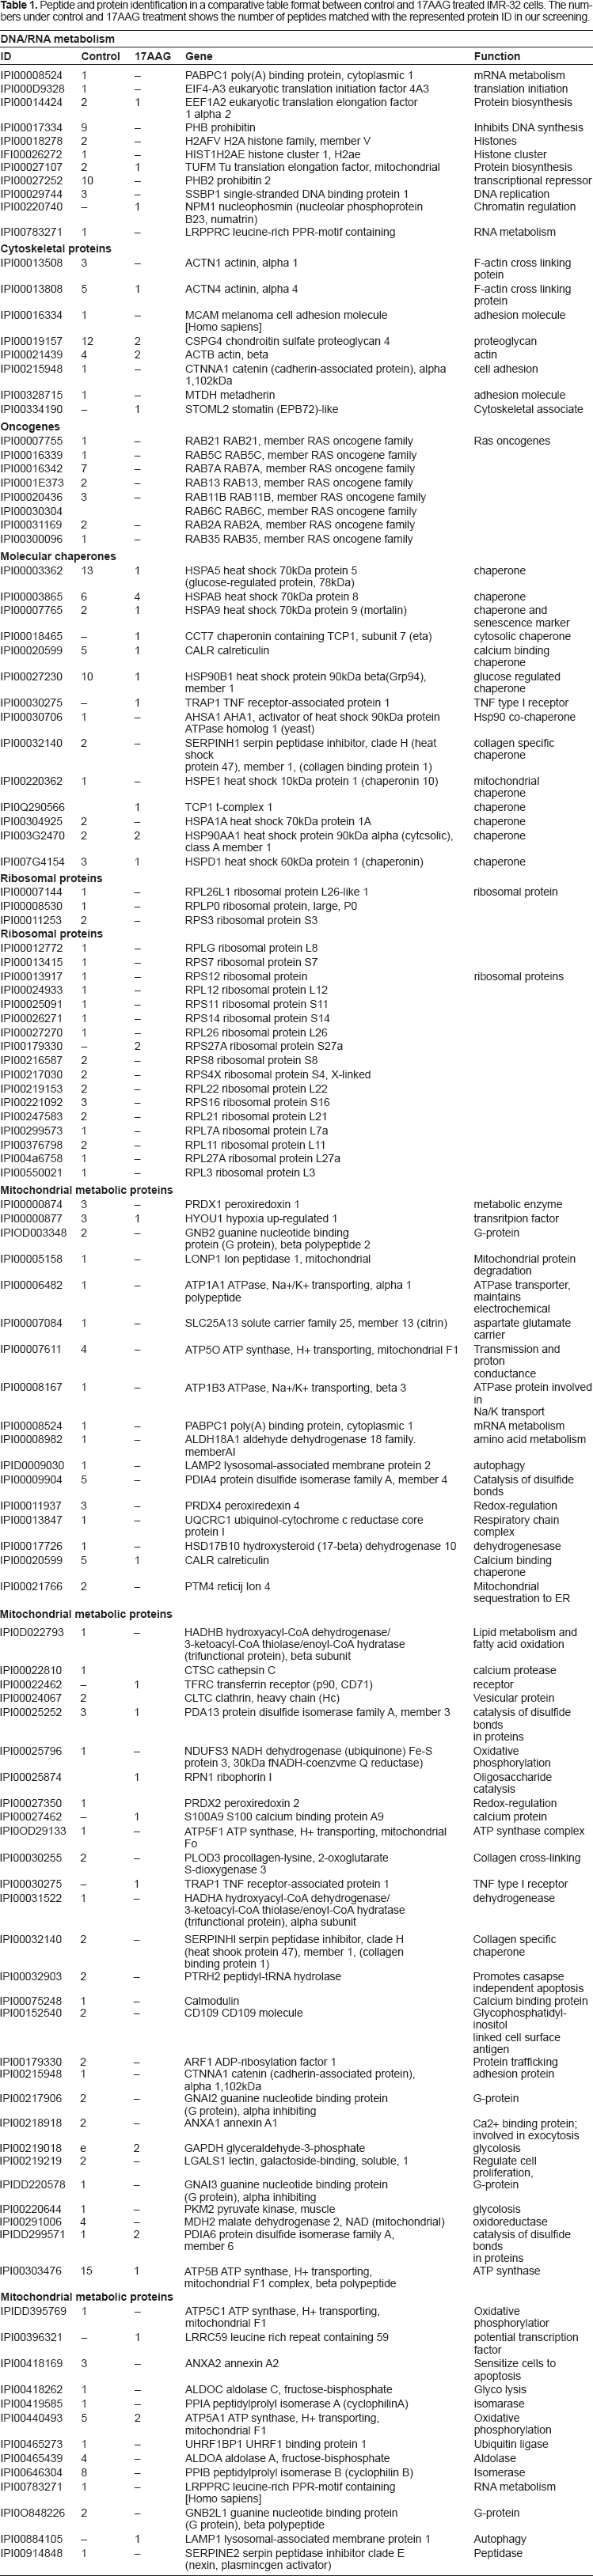
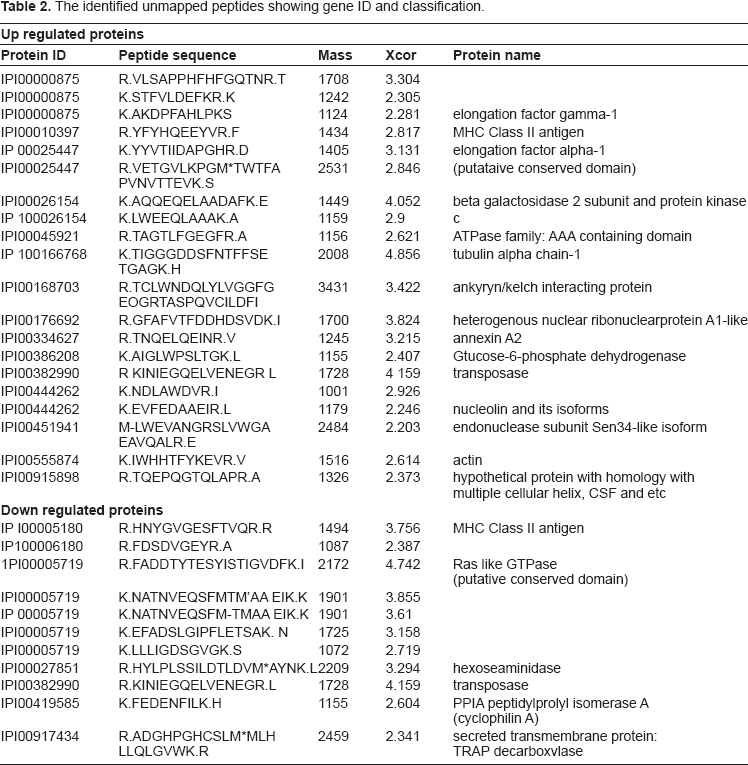
We have identified 16.8% proteins unmapped but down-regulated and 9.24% proteins up-regulated by 17AAG treatment. The down-regulated proteins were majorly from oxidative phosphorylation, actin family of proteins and transcription-translation proteins, whereas the up-regulated proteins were Ras-like GTPases, peptidyl prolyl isomerases and transposases (Table 2). Hsp90 is known to interact with ATPase family of proteins, however, its association with GTPase family of proteins was found limited.1,47
The identified unmapped peptides showing gene ID and classification.
Discussion
There is growing evidence that mitochondria are potential targets to fight against cancer and various other pathological disorders. 48 Pharmacological inhibition of Hsp90 has also emerged as a novel strategy to combat cancer since Hsp90 inhibition induces tumor selective combinatorial attack on multiple signaling molecules. 25 Hsp90 inhibition is also connected in inhibiting mitochondria-initiated apoptosis. New class of drugs such as mitochondria-directed Hsp90 antagonists provided information on how Hsp90 regulates mitochondria.49,50 Like cytoplasmic chaperones, mitochondrial chaperones were also associated in regulating protein folding and unfolding mechanisms to preserve mitochondrial protein homeostasis. 51 However, Hsp90 inhibition effects on mitochondrial organization are largely not known. From the present study, we display that the treatment of tumor cells with 17AAG alone induces mitochondrial dysfunction. From the kinetic studies, we showed that mitochondrial destabilization was an early step of Hsp90 inhibition, and was because of increased mitochondria elongation and matrix vacuolization.
From the biochemical analysis, we showed that 17AAG induces ex vivo mitochondrial swelling, a change in Δψm, mitochondrial elongation and vacuolization. The differential response of 17AAG in isolated mitochondria (ex vivo) from the in vivo effects may argue with the selective targeting. The sucrose gradient has shown to improve mitochondria integrity in isolated mitochondria. However, multiple reports show that the concentrations above 20 mM are suitable but not enough to improve mitochondrial integrity, suggesting that mitochondria isolations despite care can still affect its integrity. The effect on cytochorme c release may be a combined effect of 17AAG with in vitro mitochondria isolation procedure. Isolated mitochondria are lacking their association with cytoskeletal and cytoplasmic constituents, thus cannot mimic exact in vivo condition. This could be one reason why we see a different response in isolated mitochondria, which therefore may not be related to the effect of 17AAG. Because of the limits imposed on isolation procedures to get intact mitochondria, we have not used isolated mitochondria in evaluating drug effects in our following experiments. However, the analysis of mitochondria from intact cells using different anti-Hsp90 drugs confirmed that indeed it is Hsp90 inhibition that caused a change in mitochondrial destabilization.
Mitochondria forms interconnected networks within the cell, 22 and they reach equilibrium between two states in healthy cells by regulating the relative rates of organelle fusion and fission. 52 Our data suggested fusion of mitochondria as observed from micrographs. However, the electrograph data suggested that 17AAG treatment induced both elongation and engorgement of mitochondria. More interestingly, the early deformity noted in different chemotherapeutic treatments suggested that only Hsp90 inhibition induced such deformity.
A drop in mitochondrial membrane potential occurs when there is advancing apoptosis with release of cytochrome c into the cytosol. However, in our study, we see no cytochrome c release but a change in membrane order suggesting a direct effect of the drug on mitochondrial membrane. Earlier it has shown that Hsp90 inhibitor, geldanamycin affects plasma membrane integrity when used in higher concentrations (18 μM). However, information on drug induced effects on mitochondrial membrane is scanty and therefore needs future studies. Since cholesterol-rich membrane micro domains are rich with signaling complexes, we have confirmed with our preliminary experiments that Hsp90 also localizes to such regions on plasma membrane (unpublished observations). Digitonin may be helping in the sensitization of such domains for 17AAG intake.
While many roles of mitochondria are common to different cells, a recent proteomic survey suggested that about half of the mitochondrial proteins are tissue-specific and may reflect on diversity in mitochondrial architecture. 54 Although we could get large information on time-dependent mitochondrial elongation induced by 17AAG at 6 h and 12 h, a decrease in mitochondria length by 24 h was found to be interesting. Mitochondrial proteomics offer a great understanding of mitochondrial roles. 55 Our studies though provided gross information on how 17AAG affected the mitochondrial integrity and deformity, they did not provide any information on molecular and protein networks that were affected by the treatment. The most direct approach for studying the mitochondrial proteome is to purify mitochondria from cells and identify proteins using mass spectrometry (MS). Most widely used mitochondrial proteomics are through 2-DE which separates proteins according to isoelectric points (pI). However, 2-DE suffers from the disadvantage that majority of mitochondrial proteins are hydrophobic, low molecular weight and basic proteins, which cannot be resolved 56 . Therefore, in the present study, we have adapted 1D PAGE LC MS/MS to study mitochondrial proteomics. From our MS analysis, we report that 17AAG treatment massively affected mitochondrial proteins resulting in 61% loss of mitochondrial proteins compared to the control. Hsp90 being a sticky protein is known to associate with several cellular proteins. 3 In addition to disassociation of chaperone complex proteins, inhibition of Hsp90 inhibits its association with several client proteins, which might have resulted in destabilized protein complexes and therefore could have resulted in severe protein loss.
Our MS analysis provided insights to the mitochondrial proteins that were targeted by 17AAG treatment. The different groups of proteins affected by 17AAG include chaperones, metabolic enzymes, oncogenes and nucleic acid ingredients. The analysis of these groups has not provided clues for destabilization of mitochondria. However, novel groups of unmapped proteins especially the GTPase family of proteins which contained reputed peptide signatures suggested possible role of these GTPases in mitochondria stabilization. 57 Our results appeared to be contrasting with Margineantu et al (2007) who showed accumulation of mitochondrial proteins, we report early mitochondrial deformity. Further, they used lower concentrations of 17AAG (0.4 μM) with prolonged incubation time (24 h) for their study, whereas, in the present study, we used 2.0 μM 17AAG and the early mitochondrial effects we reported were by 6 h of 17AAG treatment. Since Hsp90 and Hsp70 chaperones were involved in the import and export of proteins to mitochondria, the inhibition of Hsp90 chaperone limited the import and export, this would have accumulated proteins in the mitochondria. Accumulation of proteins does not always infer role, but reflects on increased proteotoxicity. Since low doses of chemotherapeutic agents show either delayed cellular response or recovery from drug-induced cellular effects, the direct effect on mitochondria after 24 h would be an outcome of inhibition of several biochemical events.
In summary, we examined Hsp90 inhibition effects on three tumor cells types; HeLa, HNGC2, and IMR-32. Our data displays that Hsp90 inhibition first targets mitochondria in three different cell types, therefore 17AAG-induced cellular effects were not cell type specific. Further using different anti-Hsp90 drugs in comparison with nonHsp90 drugs, we demonstrated that 17AAG effects were not drug specific, but Hsp90 inhibition specific. From our study, we clearly show that Hsp90 inhibition by itself affects the mitochondrial integrity inducing its deformity, which subsequently leads to the loss of mitochondrial proteins. Since Hsp90 has been identified as a potential biomarker to target cancer and 17AAG is already in the clinical evaluation to treat cancer, our findings may gain utmost importance in anticancer treatment studies using anti-Hsp90 inhibitors.
Disclosure
This manuscript has been read and approved by all authors. This paper is unique and is not under consideration by any other publication and has not been published elsewhere. The authors and peer reviewers of this paper report no conflicts of interest. The authors confirm that they have permission to reproduce any copyrighted material.
Footnotes
Abbreviations used in this paper
Acknowledgments
Department of Biotechnology supported the work in authors' laboratory.