
Abstract
The aims of the study were to assess the usefulness of expression macroarrays to determine the pattern of expression of cytokines, chemokines and molecules related to immune system activation pathways, in non-stimulated intact intestinal tissue specimens from patients with active CD (aCD) and on a gluten-free diet (GFD), to compare it with two groups of controls with either normal or altered mucosal architecture, and to establish putative targets for diagnostic markers or therapeutic intervention. We have experienced the lack of sensitivity to detect signal of genes with low level of expression. In spite of that, active CD seems to show a Th1 cytokine pattern, but with signs of Th2 activity. Cytokines such as IL-9, IL-11, IL-21 or MIF might be involved in mucosal inflammation in CD. In GFD, some memory cells and DC's activity remains, and factors that maintain this remnant activation might be responsible of the fast mucosal response on gluten challenge. STAT3 and STAT5 pathways, and their regulatory molecules SOCS's may result keys for understanding mucosal inflammation in gut and putative targets for further research.
Introduction
Celiac Disease (CD) is an immune-mediated enteropathy caused by the ingestion of gluten, a group of store proteins of certain cereals (wheat, rye, barley and probably oats) in genetically predisposed individuals (Maki and Collin, 1997). The typical celiac intestinal mucosa shows flattened villi, crypt hyperplasia, and intraepithelial infiltration of lymphocytes (IEL). The current treatment is a life-long strict gluten-free diet (GFD), after which a complete remission of the symptoms and mucosal recovery are found.
T cells have a central role in the immunopathogenesis of CD, and cytokines released during a T cell-mediated hypersensitivity may trigger the development of the enteropathy (MacDonald and Spencer, 1988; Sollid, 2000). Specific lamina propria T helper cells recognize gluten peptides modified by the enzyme tissue transglutaminase in the context of HLA-DQ2 or DQ8 molecules (Godkin and Jewell, 1998; Schuppan, 2000; Sollid, 2002). It has been reported that the immune response to gluten may follow two complementary (and sometimes parallel) pathways, mediated by the adaptive and innate immunity (Maiuri, Ciacci et al. 2003).
Previous reports on cytokine expression in CD have studied biopsies from untreated patients (Nilsen, Jahnsen et al. 1998; Monteleone, Pender et al. 2001; Forsberg, Hernell et al. 2002), after ex vivo stimulation with gluten. Gluten-specific T helper cell clones, HLA-DQ restricted, isolated from the intestine of CD patients show a TH1 cytokine pattern following gluten challenge (Lundin, Scott et al. 1993; Nilsen, Lundin et al. 1995), and a similar profile, characterized by high expression of IFNγ, but no IL12, has been found by mRNA expression in biopsy homogenates (Nilsen, Jahnsen et al. 1998; Troncone, Gianfrani et al. 1998; Monteleone, Pender et al. 2001), or isolated T cell populations (Forsberg, Hernell et al. 2002), from patients with active CD. Gluten challenge has been reported to induce also the expression of IL-2, IL4, IL5, IL6, and TNFα (Nilsen, Jahnsen et al. 1998), as well as IL-18, IL-15 (Maiuri, Ciacci et al. 2000; Monteleone, Pender et al. 2001; Salvati, MacDonald et al. 2002), and TGFβ, but not of IL10 (Nilsen, Jahnsen et al. 1998; Lionetti, Pazzaglia et al. 1999; Forsberg, Hernell et al. 2002; Hansson, Ulfgren et al. 2002).
These findings may be secondary to the acute response triggered by gluten on tissue specimens or isolated T cell populations, but not reflect the situation in vivo of a long-standing inflammatory reaction occurring in CD patients at diagnosis. The use of intact non-stimulated intestinal tissue specimens may help to identify the cytokine profile in the intestine with a well-established on-going chronic inflammation.
The aims of the study were to assess the usefulness of low density expression arrays (or macroarrays) to determine the pattern of expression of cytokines, chemokines and molecules and transcription factors related to immune system activity pathways, in non-stimulated intact intestinal tissue specimens from adults and children with active CD (aCD) and on a gluten-free diet (GFD), and to compare it with two groups of controls with either normal or altered mucosal architecture, and to establish putative targets for diagnostic markers or therapeutic intervention.
Patients and Methods
Patients
Intestinal biopsy specimens where collected from 8 CD patients, (mean age 20 years, range 3–52 years). From these, 4 cases were untreated (active Celiac Disease group aCD) and 4 cases were on a gluten-free diet for at least 3 months (GFD group). All patients attended the Adult and Pediatric Gastroenterology Clinics, Hospital Clínico Universitario of Valladolid, as part of the routine diagnostic procedures for suspicion or follow up of CD. Adult intestinal small bowel biopsies were obtained during upper gastrointestinal endoscopy using a fybergastroscope with forceps (Olympus, Tokyo, Japan), and jejunal biopsies from children were obtained using a pediatric Crosby capsule. Patients with active CD showed altered biopsy histology, positive anti-transglutaminase antibodies and the HLA-DQ2 genotype, and the diagnosis was later confirmed by the remission of symptoms and recovery of the histological and serological markers after treatment. Mucosal abnormalities in biopsies were described following the modified Marsh classification (Marsh, 1992; United European Gastroenterology, 2001). CD patients on GFD presented normal mucosal histology and negative anti-transglutaminase antibodies.
Two other groups of patients were studied: A) a group of controls with normal biopsy histology, which includes 4 patients, (mean age 27.7 years, range 8–53), who underwent diagnostic investigations due to clinical suspicion of a gastrointestinal disorder which was later ruled out due to the finding of a normal biopsy histology, and no signs of intestinal infection, inflammation or allergy (Healthy Control group, HC). B) 2 adult patients (mean age 35 years, range 14–56) with signs of non-specific intestinal inflammation, altered intestinal biopsy histology, and negative both serological markers of CD and the HLA-DQ2 genotype, but presenting small bowel symptoms (Diseased or Pathologic Control group, PC). Informed consent was obtained from patients and/or their parents following the institutional protocols and recommendations, and the study protocol was approved by the ethics committee of the University Hospital.
Sample preparation (RNA extraction and cDNA preparation)
After collection, samples were immediately submerged in 1mL of RNA-Later® solution (Ambion Inc, TX, USA) and stored at –20 °C to preserve RNA integrity until processing. Total RNA was purified from intact biopsy specimens using the TRIZOL® reagent (Invitrogen, Life Technologies, USA). Samples were placed in sterile tubes, submerged in 1mL of TRIZOL, and homogenised using a DIAX 900 tissue homogeniser (Heidolph, Germany), followed by the steps detailed in the protocol provided by the manufacturer. Following steps, transcription with annealing by random primers, linear polymerase reaction (LPR) and labelling by means of biotin-16-dUDP, were carried out using the SuperScript® First-Stand Synthesis System for RT-PCR Kit (Invitrogen, Life Technologies, USA) and SuperArray Ampolabelling (LPR) kit, according to the instructions of the manufacturers to produce biotin-labeled probes.
Gene expression testing
GEArray ™ Q Series (SuperArray Bioscence Cop. USA) membranes were used to test human inflammatory cytokines/chemokines and receptors (HS-015.2, GEArray® Q Series Human Inflammatory Cytokines and Receptors Gene Array), and JAK/STAT pathways and transcription factor molecules (HS-039, GEArray® Q Series Human JAK/STAT Signaling Pathway Gene Array). The membranes were hybridated with the biotin-labeled probes following the manufacturer's protocol. Previously, a label test was performed by successive dilution of the probes to assess the suitable working dilution.
After hybridation step, the membranes were revealed with SuperArray GEArray ™ chemiluminiscent detection kit and autoradiographied.
Each kind of Q Series presented 114 clovershaped dots formed by 4 spots of 60 mer oligonucleotids corresponding to 96 specific genes, 5 housekeeping genes and blank dots.
Inflammatory cytokines/chemokines and receptors membranes allow testing the following specific genes expression:
BLR1, CCR1, CCR2, CCR3, CCR4, CCR5, CCR6, CCR7, CCR8, CCR9, XCR1, CX3CR1, Chemiokine (CXC) motif Receptor (CXCR) 4, IFNγ, IL-10, IL-10Rα, IL-10Rβ, IL-11, IL-11Rα, IL-12p35, IL-12p40, IL-12Rβ1, IL-12Rβ2, IL-13, IL-13Rα1, IL-13Rα2, IL-15, IL-15Rα, IL-16, IL-17, IL-17R, IL-18, IL-18R1, IL-1α, IL1β, IL-1R1, IL-1R2, IL-2, IL-20, IL-21, C19orf10, IL-2Rα, IL-2Rβ, IL-2Rγ, IL-4, IL-5, IL-5Rα, IL-6, IL-6R, IL-6ST, IL-9, IL-9R, Leptin (LEP), Linfotoxin (LT)α, LTβ, LTβR, MIF, CCL1, CCL11, CCL13, IL-3, CCL15, CCL16, CCL17, CCL18, CCL19, CCL2, CCL20, CCL21, CCL22, CCL23, CCL24, CCL25, CCL3, CCL4, CCL5, CCL7, CCL8, CXCL10, CXCL11, CXCL13, CXCL5, CXCL6, XCL1, XCL2, CX3CL1, Small inducible cytokine subfamily E (SCYE) 1, CXCL12, Stromal cell-derived factor (SDF2), TGFα, TGF 1 1, TGFβ2, TGFβ3, TNF, TNFRSF1α y TNFRSFβ.
And JAK/STAT pathways and transcription factors membranes, the following:
Alpha 2 Macroglobulin (A2M), BCL2-Related Gene (BCL-X), Cyclin D1, Cyclin-dependent kinase inhibitor 1 a (CIP1 o CDKN1A) 1a, CCAAT/Enhacer binding protein beta (CEBPβ), Creb Binding Protein (CREBBP), V-crk sarcoma virus CT10 oncogene holomolog (avian)-like (CRKL), C-reactive protein pentraxin-related (CRP), CSF1R, CSF2RB, Casein beta (CSN2), CXCL9, EGFR, EPOR, Fc Fragment Of IgE High Affinity I Receptor For alpha subunit (FCER1α), Fc Fragment Of IgE Low Affinity II Receptor (FCER2), Fc Fragment Of IgG High Affinity I Receptor For alpha subunit (FCGR1α), Interferon alpha inducible protein clone IFI-6–16 (G1P3), GATA3, Guanylate Binding Protein 1 (GBP1), Interferon Induced Protein IFI-15K (G1P2), High Mobility Group At-Hook 1 (HMGa1), IFNαR1, IFNαR2, IFNγ, IFNγR1, IFNγR2, Immunoglobulin heavy constant delta (IGHD), IL-10Rα, IL-10Rβ, IL-10Rα, IL-22Rα1, IL-2Rα, IL-2Rγ, IL-4, IL-4R, GP130 o IL-6ST, Indoleamine-pyrrole 2,3 dioxygenase (INDO), IRF1, p48/IRF9, JAK1, JAK2, JAK3, O V-Jun Avian Sarcoma Virus 17 Oncogene Homolog (JUN), JUNB, SMAD1, SMAD2, SMAD3, SMAD4, SMAD5, SMAD6, SMAD7, SMAD9, V-Maf Avian Musculoaponeurotic Fibrosarcoma Oncogene Homolog (MAF), Cell Division Cycle 46 (CDC46 o MCM5), MHC Class II Transactivator (MHCIITA), PIAS2, MMP3, Myeloproliferative Leucemia Virus Oncogene (MPL), V-Myc Avian Myelocytomatosis Viral Oncogene Homolog (MYC), Nuclear Receptor Coactivator 1 (NCOA1), NF-κB1, NMYC Interactor (NMI), Nitric Oxide Synthase 2A (NOS2A), Oligoadenylate Synthetase 1 (OAS1), OSM, PIAS1, PIAS3, PIAS4, Oncogen PIM1, Protein Tyrosin Phosphatase non receptor type 1 (PTPTN1), PTPNS1, CD45 o PTPRC, Adaptor Protein (SH2B), SOCS1, SOCS2, SOCS3, SOCS4, SOCS5, SOCS6, Specificity Protein 1 (SP1), Hematopoietic transcription factor PU-1, Oncogene C-Src, Signal Transducing Adaptor Molecule (STAM), STAT1, STAT2, STAT3, STAT4, STAT5A, STAT5B, STAT6, STIP1 Homologous U box containing protein 1 (STUB1), FAS Antigen (FAS), TYK2, Upstream Transcription factor 1 (USF1) and transcription factor YY1.
As housekeeping genes: pUC18 (3 dots), Glyceraldehyde 3 Phosphate Dehydrogenase (GAPDH, 2 dots), Cyclophilin A (PPIA, 4 dots), Ribosomal Protein L 13a (RPL13A, 2 dots) and β-Actin (2 dots).
Densitometric measurements and statistic analysis
Films were scanned and processed with GEArray Expression Analysis Suite version 1.0 of Superarray Bioscience Corporation, USA (http://geasuite.superarray.com/) for densitometric analysis. The average density of each spot was measured with “clover” mode on. Background was corrected with the “local background” mode. The results were normalized with the housekeeping genes expression. The application considers “absent” gene (non-expressed) when the spot density is lower than the 75 percentile of the average local background of the spots non-classified as “bleeding”. The remainders are considered “present” (expressed). Bleeding spots are those ones with an average density higher than the average value of all the spots and that it differs from its local background less than 30%. All genes classified as “absent” or “bleeding” were visually assessed and 0 values was assigned to “absent” ones and the value of the normalized measure of density with the general background correction to “bleeding” ones.
Differential gene expression between two groups was carried out by calculating the ratio of the median values of expression for each gene. Genes with a ratio equal or higher than 2 were considered over-expressed, and equal or lower than 0.5 sub-expressed. The statistical significance of these differences was checked by non-parametric tests: Krustall-Wallis and Mann-Whitney U tests. This simple statistical treatment was previously use for a similar approach with microarrays in IBD (Costello, Mah et al. 2005).
Results
Inflammatory cytokines and chemokines. (Tables 1 and 2)
Medians fold ratios (mARN) and p values of comparations amongst groups of expression of Cytokines and Chemokines genes.
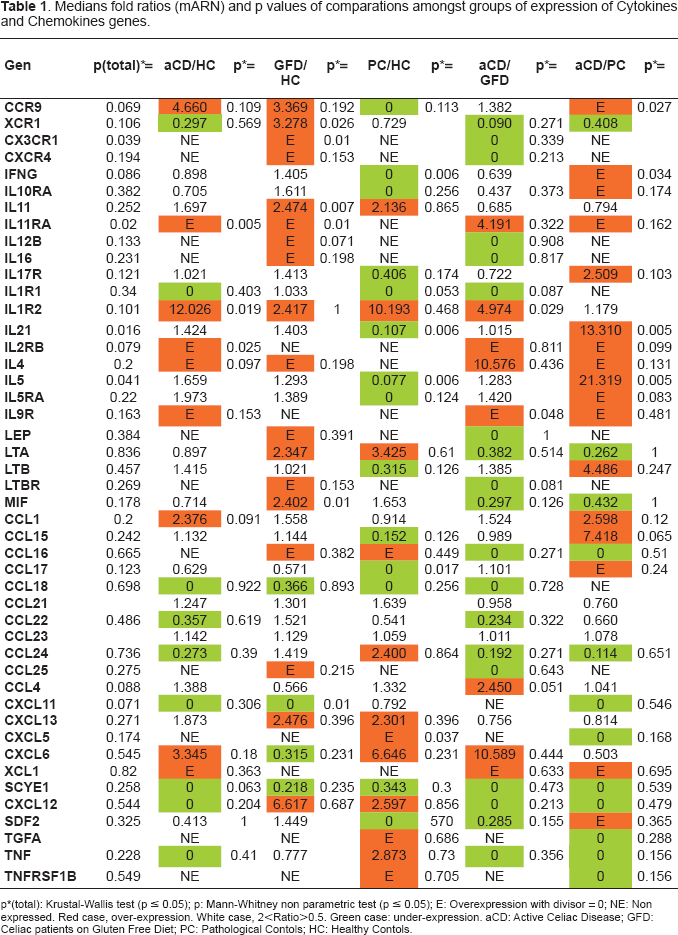
p(total): Krustal-Wallis test (p ≤ 0.05); p: Mann-Whitney non parametric test (p ≤ 0.05); E: Overexpression with divisor = 0; NE: Non expressed. Red case, over-expression. White case, 2<Ratio>0.5. Green case: under-expression. aCD: Active Celiac Disease; GFD: Celiac patients on Gluten Free Diet; PC: Pathological Contols; HC: Healthy Contols.
Resume of molecules with differential expression between groups, by functional families in cytokines/chemokines array. r: fold ratio. p: statistical significance by Mann-Whitney test.
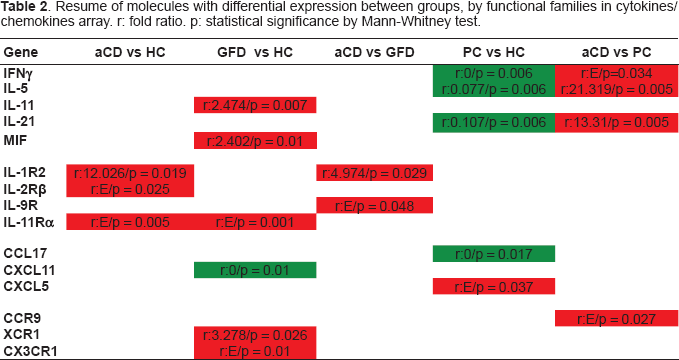
IL-11Rα (r:E/p = 0.005), IL-1R2 (r:12.026/p = 0.019) and IL-2Rβ (r:E/p = 0.025) genes resulted over-expressed and none under-expressed in active Celiac Disease (aCD) as compared with Healthy Controls (HC). However, XCR1, CX3CR1, IL-11, IL-11Rα and MIF are over-expressed in GFD CD small intestine vs HC (r:3.278/p = 0.026, r:E/p = 0.01, r:2.474/p = 0.007, r:E/p = 0.001 and r:2.402/p = 0.01 respectively) and the gene of the chemokine CXCL11 under-expressed (r:0/p = 0.01).
IL-1R2 and IL9R resulted over-expressed in aCD when compared with GFD (r:4.974/p = 0.029 and r:E/p = 0.048).
When compared with Diseased (pathologic) Controls (PC), CCR9 (r:E/p = 0.027), IFNγ(r:E/p = 0.034), IL-21 (r:13,31/p = 0.005) and IL-5 (r:21,319/p = 0.005) were over-expressed in aCD group. However, only CXCL5 (r:E/p = 0.037) resulted over-expressed in PC as compared with HC, and IFNγ (r:0/p = 0.006), IL-21 (r:0.107/p = 0.006), IL-5 (r:0.077/p = 0.006) and chemokine CCL17 (r:0/p = 0.017) were under-expressed.
JAK/STAT pathway. (Tables 3 and 4)
Medians fold ratios (mARN) and p values of comparations amongst groups of expression of JAK/STAT pathway genes.
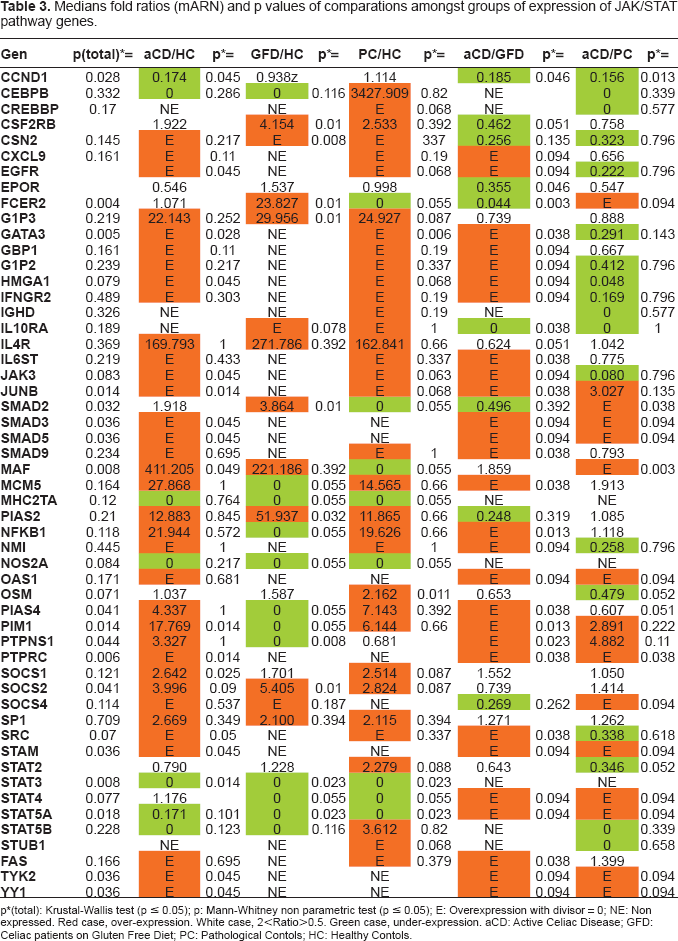
p(total): Krustal-Wallis test (p ≤ 0.05); p: Mann-Whitney non parametric test (p ≤ 0.05); E: Overexpression with divisor = 0; NE: Non expressed. Red case, over-expression. White case, 2<Ratio>0.5. Green case, under-expression. aCD: Active Celiac Disease; GFD: Celiac patients on Gluten Free Diet; PC: Pathological Contols; HC: Healthy Contols.
Resume of molecules with differential expression between groups, by functional families of JAK/STAT pathway array. r: fold ratio. p: statistical significance by Mann-Whitney test.
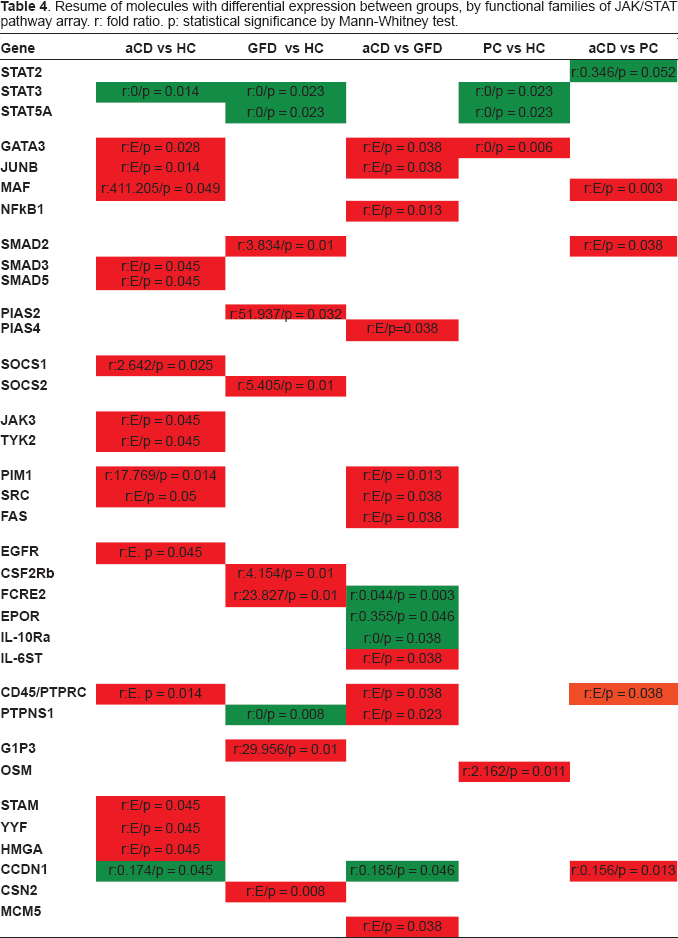
EGFR (r:E, p = 0.045), GATA3(r:E/p = 0.028), HMGA (r:E/p = 0.045), JAK3 (r:E/p = 0.045), JUNB (r:E/p = 0.014), SMAD3 (r:E/p = 0.045), SMAD5 (r:E/p = 0.045), MAF (r:411.205/p = 0.049), PIM1 (r:17.769/p = 0.014), PTPRC (r:E, p = 0.014), SOCS1 (r:2.642/p = 0.025), SRC (r:E/p = 0.05), STAM (r:E/p = 0.045), TYK2 (r:E/p = 0.045) and YYF (r:E/p = 0.045) were over-expressed in aCD intestinal mucosa as compared with HC group, while CCND1 (r:0.174/p = 0.045) y STAT3 (r:0/p = 0.014) resulted under-expressed.
In GFD group, CSF2RB (r:4.154/p = 0.01), CSN2 (r:E/p = 0.008), FCRE2 (r:23.827/p = 0.01), G1P3 (r:29.956/p = 0.01), SMAD2 (r:3.834/p = 0.01), PIAS2 (r:51.937/p = 0.032) and SOCS2 (r:5.405/p = 0.01) were over-expressed and PTPNS1 (r:0/p = 0.008), STAT3 (r:0/p = 0.023) and STAT5A (r:0/p = 0.023) under-expressed when compared with HC group.
When compared aCD and DSG groups, we found GATA3 (r:E/p = 0.038), IL6ST (r:E/p = 0.038), JUNB (r:E/p = 0.038), MCM5 (r:E/p = 0.038), NF-κB1 (r:E/p = 0.013), PIAS4 (r:E/p = 0.038), PIM1 (r:E/p = 0.013), PTPNS1 (r:E/p = 0.023), PTPRC (r:E/p = 0.038), SRC (r:E/p = 0.038) and FAS (r:E/p = 0.038) over-expressed in aCD group and CCND1 (r:0.185/p = 0.046), EPOR (r:0.355/p = 0.046), FCER2 (r:0.044 p = 0.003) and IL-10Rα (r:0/p = 0.038) under-expressed.
SMAD2, MAF and PTPRC are also over-expressed in aCD group vs PC group (r:E/p = 0.038, r:E/p = 0.003 y r:E/p = 0.038) respectively, and CCND1 (r:0.156/p = 0.013), STAT2 (r:0.346/p = 0.052) under-expressed. And PC group had GATA3 (r:0/p = 0.006) and OSM (r:2.162/p = 0.011) over-expressed, and STAT3 and STAT5A (r:0/p = 0.023 and r:0/p = 0.023, respectively) under-expressed when compared with HC group.
Discussion
Expression arrays techniques have resulted important tools in genomic studies, such as in positional genetics as in the study of tissues physiology and in the changes induced by disease in them. However, these techniques are susceptible of methodologic and interpretative variability, resulting in an obstacle for findings reproducibility and comparison amongst different laboratories (Li, Gu et al. 2002). Low density arrays or macroarrays are more user-friendly variants than microarrays, designed specifically for one system or pathway, to explore some tens or a few hundreds of genes. However we have not to forget that both versions are screening tools, and that the findings should be considered as a first approach, and susceptible of been validated by other techniques.
This technique has been used by numerous research groups and its limitations are well known. We have experienced the lack of sensitivity to detect signal of genes with low level of expression. Perhaps, increasing the number of cycles of the sample amplification, it would be possible to achieve the number of copies and to enhance the performance of the hybridation. Another pitfall for sensitivity is the use of intact whole tissue (intestinal mucosa in our case). In this case the coexistence of multiple cell lineages would tend to mask some changes of expression in one of the lineages. This technique shows better performances with homogeneous samples (of one cell lineage)(Torres-Munoz, Stockton et al. 2001).
We found an inter-assay variability for the same sample similar to the intra-assay one (determined for housekeeping genes -Data not shown-) in an acceptable range. However, we found a wide biological variability for each one of the analytes amongst the several samples of the same group, what claims for a higher casuistic for more robust results.
We should not forget that arrays techniques were designed with the aim of detect wide variations in the expression of multiple genes, to determine pathways or patterns of gene activation/repression with gross differences (being used inicially in oncology). This means, wide changes in multiple related genes behaviour, in a parallel manner, and not to observe individual differences in one gene separately. We have tried to extrapolate from this use to a group of diseases with subtler changes, and we have found that the sensitivity of the technique result a limiting factor. Complex tissues tend to buffer the changes in one of its several components versus to very homogeneous tissues, as tumors are. On the other hand, the quantity of the difference of gene expression used to be lower in diseases non so extrem as neoplastic tissues.
As a consequence of all the previously exposed, we have not pretended to draw any conclusion about isolated molecules, but to get an overall view of the immunologic activity in each group of patients, regarding to the cytokine/chemokine pattern and the activation pathways activated.
The quantitative expression analysis of cytokine and chemokines in intestinal mucosa mucosa shows that, although Th1 pattern factors are expressed, Th2 pattern related molecules have also a role in active CD intestinal mucosa. Cytokine receptor IL-11Rα, IL-1R2 and IL-2R gene expression is increased in active EC as compared with healthy controls and IL9R as compared with CD patients in remission. Both IL-1 1Rα and IL-9R are receptors related to Th2 response regulation. IL-11 is regulated by the anti-inflammatory cytokine IL10. IL-9 is growth factor whose receptor is expressed in eosinophils, very abundant in CD intestinal mucosa, and it may contribute synergically with IL-13 to mucosal inflammation. This double faced immune pattern may be also found in ulcerative colitis, whose immune pattern is simplistically described as Th2, but it shows increased presence of typically Th1 cytokines in injured colonic mucosa (Gordon, Di Sabatino et al. 2005).
Cytokines IFNγ, IL-21 and IL-5 genes seem specifically expressed in active CD mucosa, but not in diseased controls. IL-5 also is a cytokine related to the regulation of eosinophil activation, as IL-9, and it is a paradigmatic component of Th2 pattern (Broide, Hoffman et al. 1999). The presence of IL-5 in CD is controversial. It has not been found in CD intestinal mucosa by some authors (Nilsen, Johansen et al. 1998), but described by others (Desreumaux, Delaporte et al. 1998).
IL-21 is a cytokine that modules as Th1 immune response as Th2 type, and it has been related to innate immune response and NK cells activity (Mehta, Wurster et al. 2005). IL-21 gene maps in a genome region that recently has been described as linked to CD susceptibility (van Heel, Franke et al. 2007), and its expression has been found increased in CD. IFNγ has been yet previous described as the main cytokine responsible of mucosal damage in CD (Wapenaar, van Belzen et al. 2004; Leon, Sanchez et al. 2005; Leon, Garrote et al. 2006), but not specific of this disease. There are also other target genes involved in the in active phase of this enteropathy, as IL-1R2 or IL-2Rβ. IL-1R2 is a receptor induced by IL-4, and it might have a role in negative regulation of IL-1 expression (Colotta, Re et al. 1993). IL-2Rβ is the signal transducer of IL-2 and IL-15, and it is an important receptor as in innate as in adaptive response, controlling T lymphs expansion and autoimmunity (Suzuki, Kundig et al. 1995).
Surprisingly, in the group of CD patients in GFD, we found overexpression in a group of chemokine receptor genes related to dendritic cell (DC) functionality: CX3CR1 y XCR1. The first one is expressed in monocytes, NK and memory cells (Sozzani, Allavena et al. 1999) and it is involved in the emission of transepithelial dendrites by CDs, with the possible function of sampling antigens in gut lumen, with the consequent impact in inflammation or tolerance triggering (Niess, Brand et al. 2005; Rescigno and Chieppa, 2007). XCR1 is the receptor for lymphotactin, highly expressed by myeloid cells and chemoattractant of NK cells and T lymphocytes, amongst other non well known actions (Luttichau, Johnsen et al. 2007). These expressions might indicate an increased basal activity of DC's in CD, even in remission.
There are other proinflammatory factors over-expressed in GFD CD patients as the macrophage migration inhibitory factor (MIF). This molecule is involved in inflammatory and autoimmune processes. A polymorphism in the gene promoter of MIF has been related to CD genetic susceptibility (Nunez, Rueda et al. 2007). In contrast with our results, O'Keeffe et al. found overexpression of MIF in intestinal epithelial cells of active CD patients (O'Keeffe, Lynch et al. 2001).
Cytokines, chemokines and growing factors regulate large aspects of hematopoiesis and immune response through interaction with their specific receptors. These ones trigger their responses through signalling pathways activity.
In our results, we find overexpressed molecules of pathways related to Th2 pattern in active CD intestinal mucosa. There is an increase in the expression of GATA3 and JUNB genes in the group of active CD patients as compared with healthy control group or GFD group. GATA3 mediate in the Th1 pattern inhibition and Th2 induction. JUNB and MAF (also overexpressed in aCD group) are also related with NF-kB activity. MAF seems specific of CD in activity, with and increased expression above healthy or diseased controls. It is an activating factor of cell differentiation (Blank and Andrews, 1997), and also promoter of Th2 immune response, through IL4 gene upregulation (Valanciute, le Gouvello et al. 2004). MAF expression is controlled by NF-kB (Nenci, Becker et al. 2007). JUNB is an oncogene, member of AP-1 family of transcription factors. When T lymphs are stimulated the degradation process of JUNB is increased, controlling the cytokine production of effector T cells (Gao, Labuda et al. 2004). JUNB is also capable of inducing proinflammatoy response through NF-kB activation (Mathas, Hinz et al. 2002). GATA3 and STAT6 compose a tandem that induces the polarization of Th0 lymphocytes towards Th2. In previous studies no differences have been found between CD patients and controls in GATA3 expression (Monteleone, Monteleone et al. 2004).
The oncogene SCR codifies for a kinase that has been related with several signalling pathways of some importance in cell growth, migration or cell survival. It is activated by several kinds of receptors: integrins, cytokines or growing factors and it is a factor in charge of regulating the cell communication for cell growth (Azarnia, Reddy et al. 1988), in relation with TRANCE, a family member of TNF (Wong, Besser et al. 1999). Experiments of in vitro inhibition of scr in intestinal epithelial cell lines have resulted in a parallel decrease of stat3, an important mediator of the antiapoptotic response. So, SCR expression prevents cell apoptosis, increasing the mucosal inflammation (Bhattacharya, Ray et al. 2006). We find increased expression of SCR gene in the group of active CD compared with diseased controls.
In CD patients in remission (GFD), we find a decrease in STAT3 and STAT5 expression, with an increase in SOCS2, SMAD2 and PIAS2 as compared to healthy controls. STAT3 is related to signal transmission of cytokine receptors sharing gp130 (IL-6, IL-11, IL-12 or IL-23 receptors), while STAT5 is related to some members of γC receptor family (IL-2, IL-9 or IL-21 receptors) or to the single chain receptor family (EPO, GH or prolactine receptors). STAT3 pathway activity and its final actions on gene expression is modulated by SOCS3 and IL-10 (Kinjyo, Inoue et al. 2006; Qasimi, Ming-Lum et al. 2006). STAT3 pathway activation had been previously described in Inflammatory Bowel Disease and in EC (Mazzarella, MacDonald et al. 2003; Musso, Dentelli et al. 2005) and it may mediate in IL-17 production. SOCS2 increased expression might explain the decrease of STAT5 expression, as SOCS2 down-regulates gene products that activate STAT5 (IL-6, IL-9, EPO or GH), and it may result the key for intestinal inflammation controlling in these patients. PIAS2 product is a nuclear level inhibitor of STAT4 (Chen, Daines et al. 2004), and down-regulator of proinflammatory genes expression. SMAD2 is a positive transcription factor in TGFβ signalling pathway (Becker, Fantini et al. 2006), the main regulatory cytokine in intestinal mucosa.
Diseased controls present an expression pattern of the molecules of the activation pathways between the patients with active CD and patients in GFD, with an increase of GATA3 expression, but a low expression of STAT3 or STAT5.
In conclusion, active CD seems to show a Th1 cytokine pattern, but with signs of Th2 activity. Cytokines such as IL-9, IL-11, IL-21 or MIF might be involved in mucosal inflammation in CD. In spite of the mucosal recovery following GFD, some memory cells and DC's activity remains, and factors that maintain this remnant activation might be responsible of the fast mucosal response on gluten challenge, and they should be inquired. STAT3 and STAT5 pathways, and their regulatory molecules SOCS's may result keys for understanding mucosal inflammation in gut and putative targets for research.
Competeting interests
No exist
Funding
This work has been partially funded by the Spanish Ministry of Education (FPU, AP2002–2696), the Spanish Ministry of Health (FIS, PI020895; 02/3068) and the Junta de Castilla y Leon (SAN1052-VA02/05 VA057/04).