
Abstract
Background
The Kt/V value demonstrates the dose of hemodialysis (HD). However, because of several existing methods for calculating delivered dialysis dose, Kt/V values can, in fact, be different for the same set of pre-/post-dialysis blood urea concentrations.
Methods
In the study presented here, another formula was derived for calculating Kt/V from the pre- and post-dialysis BUN. We prospectively compared the Kt/V values obtained using this new formula and the Kt/V values obtained via the other existing formulae to see whether reliance on the latter approach was likely to lead to errors in over- or underprescribing dialysis regimens. Data were processed on 268 dialysis patients.
Results
The estimated Kt/V (Kt/Vest) values were statistically different (p < 0.05) from the calculated Kt/V values from other models, except for those Kt/V values calculated according to the lowrie (P = 0.112), Keshaviah (P = 0.069), Daugirdas First Generation (P = 0.059), Basile (P = 0.102), Ijely (P = 0.286) and Daugirdas Second Generation (P = 0.709). The best correlations were seen with the Daugirdas second generation formula (R = 0.958 and R2 = 0.919).
Conclusion
Since the best correlations were seen between Kt/Vest and the Daugirdas second generation Kt/V we can demonstrate that these two models are more accurate than the other models.
Introduction
The single-pool urea kinetic model (UKM), utilizing “Kt/V” (the normalized whole body urea clearance), is widely used to help assess the adequacy of hemodialysis (HD). In the classic Gotch-Sargent urea kinetic model, the dialysis parameters are used for prescribing the dose of dialysis therapy (i.e. Kt/V) (Sargent JA et al. 1980). Recent studies have shown how efficient the use of urea kinetic modeling (UKM) is in the quantification and monitoring of dialysis (Depner TA, 1994), and also in predicting patient mortality (Held PJ et al. 1996). On this basis, there is increasing recognition of the need for, and acceptance of, Kt/V as a surrogate for dialysis dose delivered in many renal units (Barth RH, 1993; Hakim RM, 1992). However, the need for some time to be spent using a computer programme has led to attempts to use various ‘shortcuts’, including ‘bed side’ Kt/V models, which can be used by nephrologists as they evaluate patients clinically.
The estimation of Kt/V by various models–-utilizing pre- and post-dialysis blood urea nitrogen (BUN) concentrations–-provides a simple technique for calculating the delivered Kt/V value (Lowrie EG et al. 1983; Jindal KK et al. 1987; Kesheviah PR et al. 1988; Barth RH 1988; Calzavara P et al. 1988; Daugirdas JT, 1989; Basile C et al. 1990; Ijely GK et al. 1991; Daugirdas JT, 1993; Kerr PG et al. 1993). Unfortunately, as has been observed (Movilli E, 1996), that these simplifications rely on various assumptions, which, depending on the extent to which they are valid, can lead to very marked and highly clinically relevant differences in calculated Kt/V (Adrian Covic et al. 1998). However, the accuracy of such techniques has been questioned. One possible reason for the noted inaccuracies may be recirculation, both vascular access and cardiopulmonary-related, resulting in some postdialysis blood sampling techniques encountering a diminution in the blood urea concentration (Sherman RA and Kapoian T, 1998). Another possible reason for the inaccuracies is the frequently observed postdialysis rebound of serum urea (Alloatti S et al. 1998). In this scenario, the postdialysis blood urea concentration is artificially low (by 10%–22%) immediately after HD due to the continued diffusion of urea from the intracellular to the extracellular space. This artificially low urea concentration immediately after dialysis leads to an overestimate of the efficiency of the dialysis calculated by Kt/V (by 15%–40%) if the true, equilibrated blood urea concentration is not used in the calculation, which it is not when using the single-pool urea kinetic model (Kt/Vsp). The measurement of the urea concentration at equilibrium for determining the equilibrated Kt/V value (Kt/Veq) requires that a blood sample be drawn approximately 30 minutes after HD, which is an encumbrance for dialysis patients. In order to avoid this encumbrance, some formulae for calculating Kt/Veq from Kt/Vsp have been developed, the most popular of which is the Daugirdas correction formula (Daugirdas JT, 1995).
The purpose of this study was to derive a new method for dialysis dose calculation and to evaluate the best-known bedside simplified models in an attempt to rank them in order of precision and accuracy.
Methodology
Data were processed on 268 dialysis patients (mean age 48.21 ± 13.38, 141 male, 127 female) on 3-times-per-week dialysis regimens. Patients and treatment characteristics are shown in Table 1.
Patient characteristics.
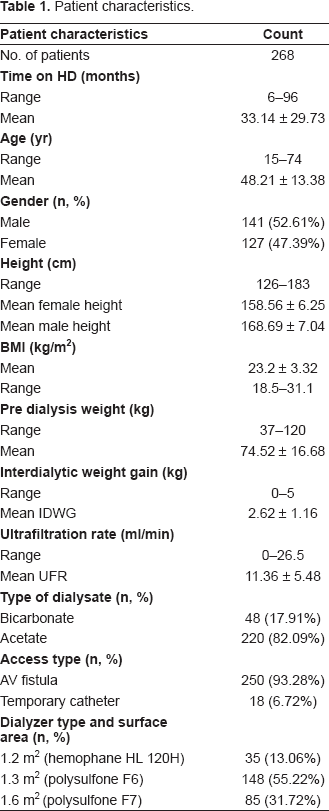
The overall study period was 3 months from June 1, 2006 to August 31, 2006. For each patient, age, gender, height, type of vascular access, location of access, pre-weight, post-weight, pre-blood pressure, post-blood pressure, type of dialysate, weight gain and HD duration were recorded. For the study period, the following dialysis parameters were unchanged: dialysis session time 240 min (machine start to machine stop); dialysate flow 500 ml/min; blood flow 300 ml/min; same dialysis membrane for each patient 1.2 m2 Cellulosynthetic (hemophane: HL 120H), 1.3 m2 polysulfone (F6) and 1.6 m2 polysulfone (F7); and same dialysate sodium/calcium/conductivity profile and dialysate temperature. A Fresenius model 4008B dialysis machine equipped with a volumetric ultrafiltration control system was used in each dialysis. Special attention was paid to the real dialysis time, so that time-counters were fitted to all machines for all sessions, to record effective dialysis duration (excluding any unwanted interruptions, e.g. due to dialysis hypotensive episodes). For each dialysis session for each patient the following were recorded: BUN at beginning (C0), and at the end (Ct) of the session (latter obtained 3 min after slowing the pump speed to 50 ml/min (Lai YH et al. 1995), which value correlated extremely well with that of a sample taken 30 min after the cessation of dialysis (Chirananthavat T et al. 2006), true dialysis time T, the intradialytic weight loss (UF), patients dry weight (Wt); and hematological profile was obtained. The recirculation rate was measured using slow flow technique recommended in the DOQI guidelines (NKF-DOQI dialysis adequacy guidelines, 1997).
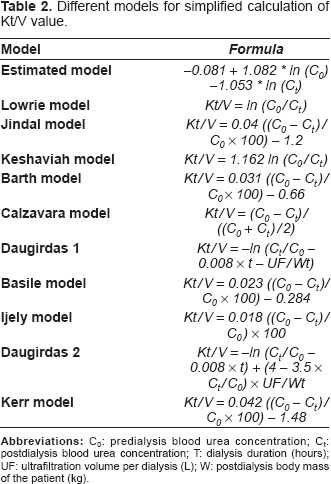
For this study the dialysis dose Kt/V was calculated according to our estimated model and also according to the Daugirdas, Lowrie, Keshaviah, Barth, Jindal, Calzavara, Ijely, Basile, and Kerr models (Lowrie EG et al. 1983; Jindal KK et al. 1987; Kesheviah PR et al. 1988; Barth RH, 1988; Calzavara P et al. 1988; Daugirdas JT, 1989; Basile C et al. 1990; Ijely GK et al. 1991; Daugirdas JT, 1993; Kerr PG et al. 1993). For all treatments, the delivered Kt/V values were also calculated as equilibrated values according to the Daugirdas correction formula. Table 2 summarizes the simplified models used for comparison.
Different models for simplified calculation of Kt/V value.
Statistical analysis was performed with SPSS 10.0 and NCSS 2004 software packages using Student's t test, correlation analysis and regressions to the mean. Significance was taken as two-tailed P < 0.05. For each patient's dialysis session, the absolute difference between the standard and observed Kt/V was derived; by taking all dialysis sessions for all patients, a mean delta (mean of the absolute values of the differences) was derived for each compared method. Also, the mean difference and the standard deviation for that mean difference, along with a 95% confidence interval of those differences, were calculated. Logistic regression analysis was used to estimate the analytical expression for Kt/V by utilizing pre- and post-dialysis blood urea nitrogen (BUN) using curve fitting software packages. The curve fitting was done using Data Fit version 8.0.32. The estimated dialysis dose (Kt/Vest) model that was derived from regression analysis is shown in equation 1:
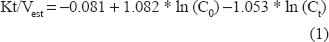
Figure 1 shows the model plot where X1 represents the Pre-dialysis BUN, X2 represents Postdialysis BUN and Y represents Kt/V.
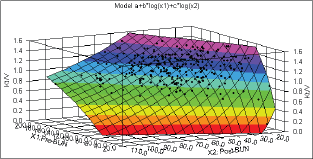
Regression analysis for dialysis dose estimation.
Results
The regression analysis revealed that the R-squared, which denotes the percentage of variation in the dependent variable that can be explained by the independent variables is 0.9451, meaning that approximately 94.5% of the variability of the pre-dialysis BUN and post-dialysis BUN is accounted for by the variables in the model. In this case, the adjusted R-squared indicates that about 94.47% of the variability of effect of pre-dialysis BUN and post-dialysis BUN on Kt/V is accounted for by the model, even after taking into account the number of predictor variables in the model. The adjusted R-squared is a measure of how well the independent, or predictor, variables predict the dependent, or outcome, variable. The adjusted R-squared adjusts the R-square for the sample size and the number of variables in the regression model. Therefore, the adjusted R-square is a better comparison between models with different numbers of variables and different sample sizes. The adjusted R-squared can be computed as:
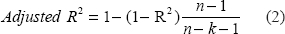
Where, n = sample size and k = number of predictors. The results of regression analysis are summarized in Table 3.
Regression analysis results for estimating Kt/V from pre-dialysis BUN and post-dialysis BUN.
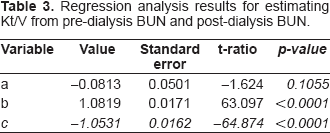
The regression coefficient of each X variable provides an estimate of its influence on Y, representing the amount the dependent variable Y changes when the corresponding independent variables change 1 unit. The variable a is the constant, where the regression line intercepts the y axis, representing the amount the dependent Y will be when all the independent variables are 0. T-tests are used to assess the significance of individual X variable coefficients, specifically testing the null hypothesis that the regression coefficient is zero. A common rule of thumb is to drop from the equation all variables not significant at the 0.05 level or better. The value of standard error of estimate is 0.05112. The standard error of estimate indicates the accuracy of a prediction model and can be computed by the equation of the standard deviation of the error variable. The smaller the standard error of estimate, the better the prediction.
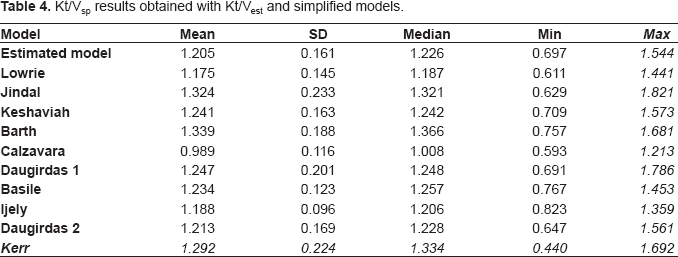
Kt/Vsp results obtained from the estimated model and from the simplified models are shown in Table 4. The estimated Kt / V (Kt / Vest) values were statistically different (p < 0.05) from the calculated Kt/V values from other models, except for those Kt/V values calculated according to the lowrie (P = 0.112), Keshaviah (P = 0.069), Daugirdas First Generation (P = 0.059), Basile (P = 0.102), Ijely (P = 0.286) and Daugirdas Second Generation (P = 0.709). For the group as a whole the biggest absolute difference from Kt/Vest mean values was obtained using Barth's and Jindal's, models (delta of 0.134 and 0.119 respectively (P < 0.05)). The best correlations were seen with the Daugirdas second generation formula (R = 0.958 and R 2 = 0.919).
Kt/Vsp results obtained with Kt/Vest and simplified models.
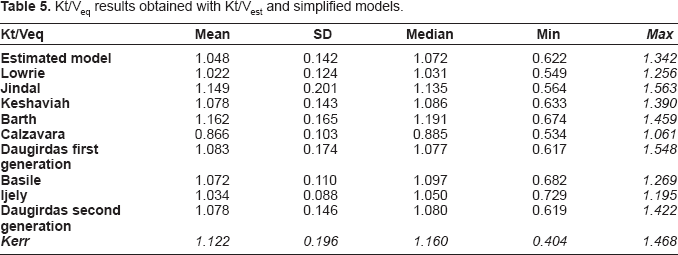
The Kt/V values were also calculated as equilibrated values according to the Daugirdas correction formula for calculating an equilibrated Kt/V (Kt/Veq) from a single-pool Kt/V (Kt/Vsp) according to equation (3) Daugirdas JT, 1995:

The descriptions of the equilibrated Kt / V results obtained from the estimated model and from the simplified models are shown in Table 5.
Kt/Veq results obtained with Kt/Vest and simplified models.
Discussion
Numerous studies have confirmed the association between the adequacy of the delivered dose of HD and patient outcome (Held PJ et al. 1996). Held et al. 1996 demonstrated that mortality risk was lower by 7% with each 0.1 higher level of delivered Kt/V. All of this research has confirmed that the Kt/V value represents a very important parameter for chronically hemodialyzed patients. However, calculated Kt/V values have the potential to be used erroneously because of variability in the measurement of the delivered dose. Namely, for the same set of pre-/post-dialysis blood urea concentrations, Kt/V values calculated by the various available models could result in a dialysis dose ranging from low and clinically unacceptable to high and clinically adequate.
Our results confirmed a statistically significant variability in delivered Kt/V calculation methods, and demonstrated wide differences in resultant Kt/V values. As Kt/V represents an extremely valuable parameter for the dialyzed patient, we recommend that notice be given with regard to the calculation method used in determining every Kt/V value so that the value obtained can be realistically compared to other Kt/V values. That approach would provide an actual adequate dialysis dose per single dialysis treatment. K/DOQI recommends the Daugirdas second-generation formula for delivered dialysis dose (Kt/V) calculation and emphasizes that the literature clearly supports delivery of a minimum HD dose of at least Kt/V = 1.2; however, K/DOQI does not suggest what constitutes an optimal dose (NKF- DOQI dialysis adequacy guidelines, 1997). K/DOQI also recommends that the dose of HD be measured at least monthly. To allow a sensible interpretation of our data, great care was employed in the design and execution of this study to eliminate potential confounding factors, such as changes in haematocrit, dry weight, ultrafiltration, time on dialysis and urea rebound. We demonstrated significant differences between Kt/Vest and other delivered and prescribed Kt/V values.
Grouping models containing ln (Co/Ct) terms–-Kt/Vest, Kesheviah, Lowrie, Daugirdas–-and those incorporating the (Co–Ct)/Co ratio (i.e. the urea reduction)–-Jindal, Barth, Calzavara, Ijely, Basile, and Kerr–-there was a better correlation for all models employing the logarithmic transformation (R 2 = 0.949–0.947 cf. R 2 = 0.937– 0.939). Also, there was a better correlation for all models employing the nonlogarithmic transformation (R 2 = 0.995–0.997). The differences between calculated Kt/Vsp by various models and Kt/Vest values are shown in Table 6.
Differences between calculated Kt/Vsp values and Kt/Vest.
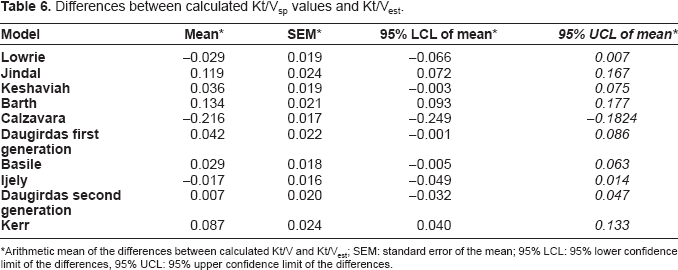
Arithmetic mean of the differences between calculated Kt/V and Kt/Vest; SEM: standard error of the mean; 95% LCL: 95% lower confidence limit of the differences, 95% UCL: 95% upper confidence limit of the differences.
The differences between equilibrated Kt/V by various models and [eq Kt/Vest] values are shown in Table 7. The statistical analysis revealed that the equilibrated estimated Kt/V values (eq Kt/Vest) were statistically different (p < 0.05) from the equilibrated Kt/V values from other models, except for those Kt/V values calculated according to the lowrie (P = 0.114), Keshaviah (P = 0.083), Daugirdas First Generation (P = 0.069), Basile (P = 0.124), Ijely (P = 0.301) and Daugirdas Second Generation (P = 0.932). We also analyzed the formulae with respect to the type of dialysis access, single-vs double-needle. Here, for single-needle access the minimum difference was seen using the Kesheviah formula (0.041) whilst for double-needle patients this was seen using the Kerr formula (0.031).
Differences between calculated Kt/Veq values and [eqKt/Vest].
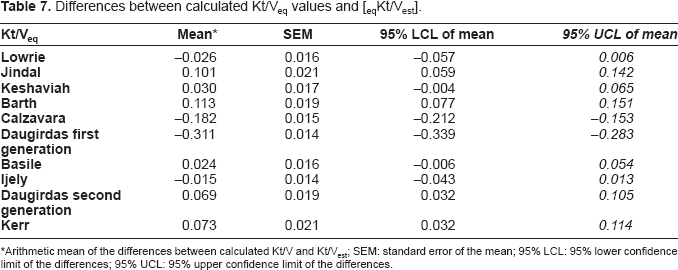
Arithmetic mean of the differences between calculated Kt/V and Kt/Vest; SEM: standard error of the mean; 95% LCL: 95% lower confidence limit of the differences; 95% UCL: 95% upper confidence limit of the differences.
Nonetheless, despite a significant difference, we can advise using Ijely's formula as a nonlogarithmic counterpart to the Daugirdas formula and using our estimated (Kt/Vest) formula as a logarithmic formula. Ijely's formula is simple, does not use an expression of a natural logarithm, and can be obtained with a simple pocket calculator in routine clinical practice. We demonstrated that the least mean of the absolute values of the differences to be between Kt/Vest values and Daugirdas Second Generation' Kt/V values for single pool Kt/V. For equilibrated Kt/V the least mean of the absolute values of the differences was seen between Kt/Vest values and Ijely's Kt/V. Additionally, we unveiled no significant difference between Daugirdas' Kt/V values and Kt/Vest. The calculation of the Daugirdas Kt/V value necessitates the use of a personal computer with specific software. Additionally, for the Kt/V Ijely calculation there is no need for the ultrafiltration volume, duration of the dialysis treatment, or postdialysis body mass; only the pre-/postdialysis blood urea concentration is necessary. We could not demonstrate correlation between Kt/V Ijely and ultrafiltration volume.
Conclusion
Since K/DOQI does recommend the Daugirdas second-generation formula for delivered dialysis dose (Kt/V) calculation, every dialysis center should obtain a personal computer with adequate software. Logarithmic methods are to be preferred. Since the best correlations were seen between Kt/Vest and the Daugirdas second generation Kt/V we can demonstrate that these two models are more accurate than the other models. Lastly, every calculated Kt/V value should have bookmarks pertaining to both the calculation formula used and the postdialysis blood sampling method. In conclusion, no ‘bedside’ formula is more accurate, but some are less accurate than others.
Footnotes
Acknowledgements
The author thanks all medical staff at the nephrology department in Ahmad Maher Teaching Hospital, Cairo, Egypt for their invaluable support during the course of this study.