
Abstract
The pathogenesis of cerebral atrophy (CA) is not clear. Previous studies show a high incidence of preterm CA in hemodialysis patients. This study aims to investigate the factors influencing CA and to derive a CA prediction nomogram in maintenance-hemodialysis patients. First, brain volumes of hemodialysis patients (≤55 years) were compared against age- and sex-matched healthy controls, and differences were revealed in bilateral insular cisterns width, maximum cerebral sulci width, Evans index, ventricular-brain ratio, frontal atrophy index, and temporal lobe ratio. Then, the patients were divided equally into “no or mild” or “severe” CA groups. Potential factors influencing CA were screened. Kt/V (urea removal index) and hemoglobin levels negatively correlated with CA degree, and were used to establish a nomogram within randomly assigned training and validation patient groups. The areas under the receiver operating characteristic curves (AUROC) for training and validation groups were 0.703 and 0.744, respectively. When potassium and calcium were added to the nomogram, the AUROC for training/validation group increased to 0.748/0.806. The nomogram had optimal AUROC for training (0.759) and validation (0.804) groups when albumin was also included. Hemodialysis patients showed reduced anterior brain volumes and the nomogram established herein may have predictive value for developing CA.
Introduction
Cerebral atrophy (CA) is a loss of brain cells and the connections between them. 1 A variety of conditions and diseases cause CA, such as stroke, 2 cerebral palsy, 3 neurodegenerative 4 and infectious diseases. 5 Neuroimaging hallmarks of CA include reduced brain volume, increased ventricular volume, enlarged superficial sulci, and reduced gray and white matter volumes. 6 Patients with CA suffer from cognitive impairment, movement disturbance, and neuropsychiatric disorders. Symptoms and severity of CA depend on the specific cause and location of damage. 4 The exact pathogenesis of CA is unclear. A mix of genetic and environmental factors may be involved, 7 and its high incidence causes a huge socio-economic burden. Therefore, CA is receiving increasing attention in medical research.8,9 Alarmingly, CA is particularly prominent in hemodialysis patients with causes being incompletely understood.
Healthy individuals rarely develop CA before an age of 55 years.10–13 But hemodialysis patients are prone to develop CA already under the age of 50.10,12,14–16 The increased risk for CA in hemodialysis patients compared to the general population may be related to factors such as uremic intoxication, volume overload, inflammation, and disturbances of mineral metabolism.17,18 Vascular damage and chronic anemia are proposed to be another crucial contributor to CA in hemodialysis patients who commonly develop early-onset systemic hypertension, vascular calcification, dyslipidemia, and chronic cardiac insufficiency. 13 In addition, malnutrition is highly prevalent in uremic patients and is known to give rise to functional and structural alterations in non-uremic human brains. 13 Moreover, the hemodialysis population exhibits multiple endocrine and metabolic abnormalities, which are potential additional factors fostering preterm CA. 19 Thus, hemodialysis patients were selected as the target population to investigate the potential factors affecting CA.
This study aims to investigate the factors influencing CA and to derive a nomogram for predicting CA in hemodialysis patients. This may also help to better understand CA pathogenesis and to develop early detection and intervention strategies to delay or, ideally, prevent CA.
Materials and methods
Ethics statement
The Dalian Municipal Central Hospital Ethics Committee approved the study (2021-009-03). Each patient gave written informed consent on admission for any diagnostic and therapeutic procedure and was informed that non-personal information may be used for clinical investigations. All relevant information was obtained from the clinical database of the Dalian Municipal Central Hospital because of the retrospective approach, but without re-informing the patients. Only anonymous data were used, and patients’ privacy was not violated, so the waiver of post-hoc written informed consent for using the data for scientific purposes was approved by the Ethics Committee. The study was conducted according to the principles expressed in the Declaration of Helsinki.
Patients
Maintenance-hemodialysis patients admitted to the Nephrology ward of the Dalian Municipal Central Hospital between April 2010 and June 2021 were retrospectively included. The inclusion criteria were: (1) hemodialysis duration ≥3 months; (2) underwent head computed tomography (CT); (3) age ≤55 years. The exclusion criteria were: (1) a history of head trauma, skull defects and brain tissue shifting affecting the assessment of brain volume; (2) a history of other diseases affecting brain volume such as: drug abuse, alcoholism, epilepsy, hydrocephalus, neurodegenerative diseases, massive ischemic or hemorrhagic stroke, and cerebral neoplasms. The flow diagram of patient selection and group assignment is shown in Figure 1.
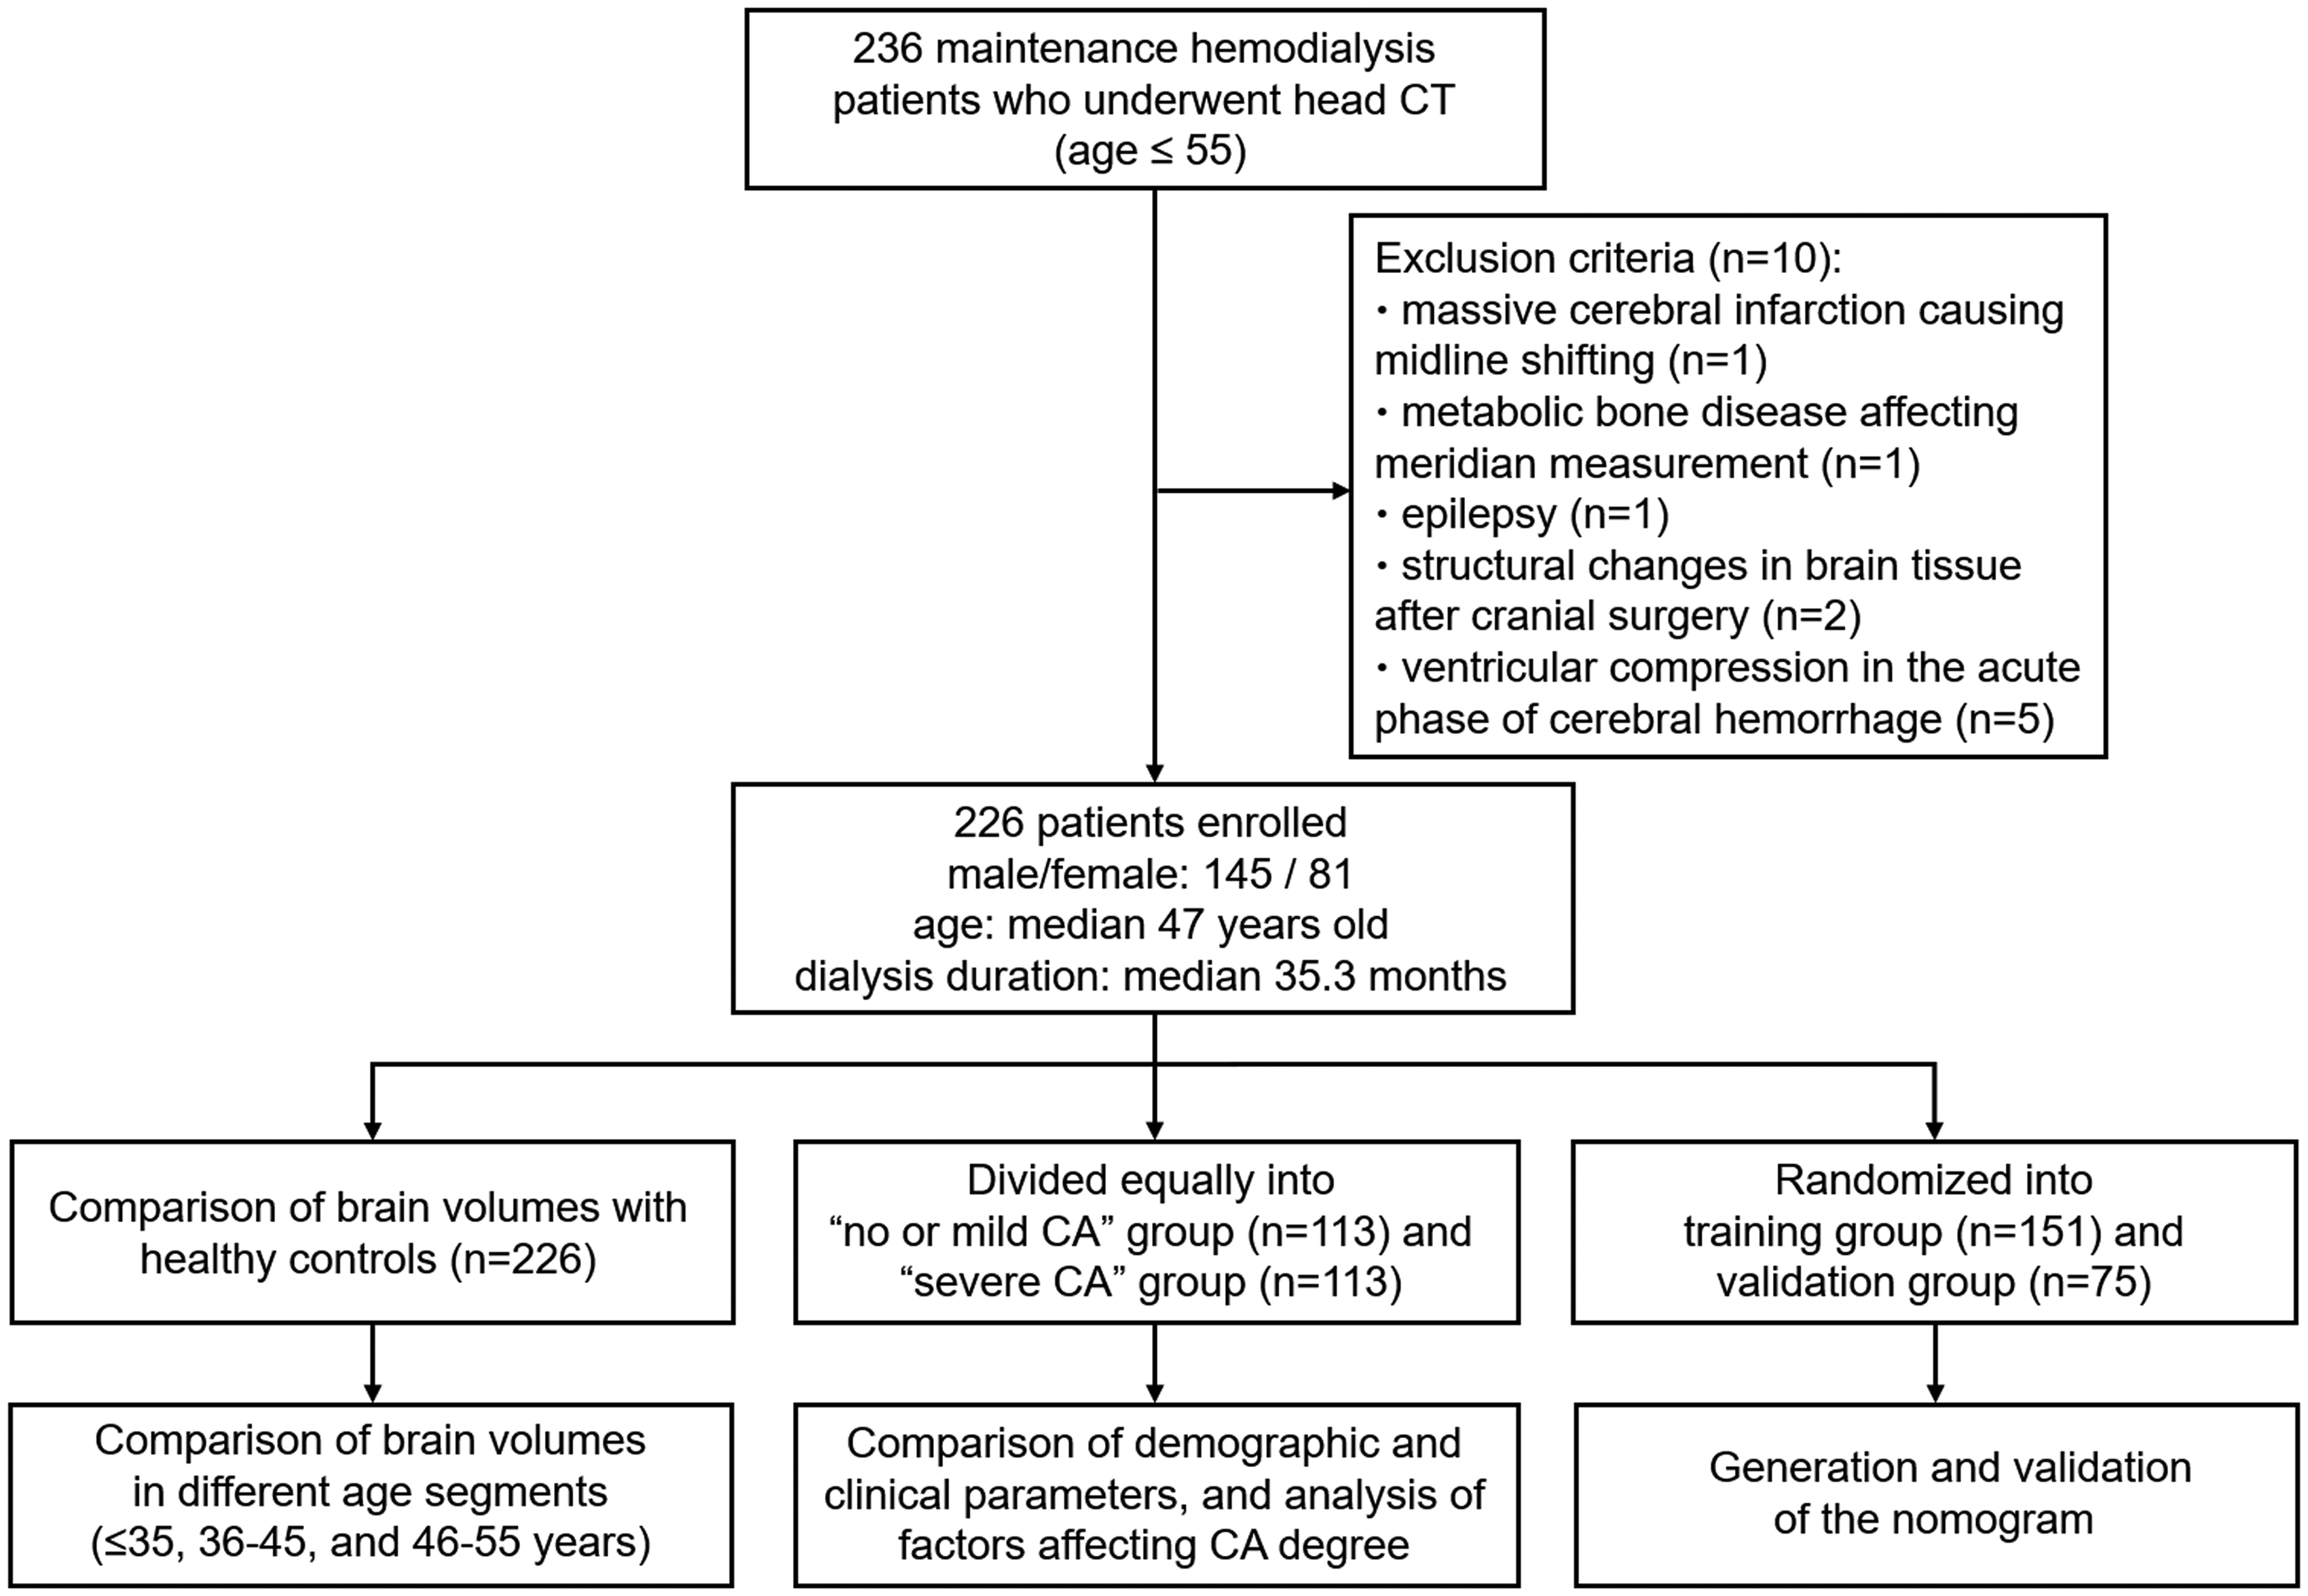
The flow diagram of patient selection and group assignment.
Study design
Firstly, the brain volumes of hemodialysis patients (n = 226) as well as randomly selected age- and sex-matched healthy controls (n = 226) undertaking head CT during the same period were compared, including in different age groups (≤35 years, 36–45 years, and 46–55 years). We searched for age- and sex-matched healthy individuals in the database of health checkups at Dalian Municipal Central Hospital Medical Examination Center. Those were then assigned random numbers by RAND function in Microsoft Excel. When selecting the age- and sex-matched healthy control for a hemodialysis patient, the healthy individual with the lowest random number was assigned as the control. Secondly, the diagnostic criterion for CA in this study was based on morphological brain changes in hemodialysis patients. We measured nine brain volume indices as described in the next paragraph (“Measurement of brain volume indices”). CA was diagnosed when hemodialysis patients exceeded the upper 95% of values derived from the healthy controls in one out of these nine indices. The median ventricular-brain ratio (VBR, 0.082) in all hemodialysis patients was used to equally divide these to either the “no or mild CA” (VBR < 0.082) or the “severe CA” (VBR ≥ 0.082) groups. The VBR was chosen as the discrimination criterion because it is a generally accepted index for whole brain atrophy.10,19–22 The demographic and clinical parameters were compared between the two groups. The parameters with statistical differences (defined as P < 0.1; please see statistical analysis section for details) were further analyzed by binary logistic regression. Finally, hemodialysis patients were randomly divided into training and validation groups (2:1 ratio) for constructing the nomogram. A nomogram based on the training group was established using the potential influencing factors of CA obtained from binary logistic regression analysis. The calibration of the nomogram was assessed by model calibration curves generated from internal sampling validation based on the training group using the 1000 bootstrap resamples, and external validation based on the validation group. The discrimination of the nomogram was assessed by the area under the receiver operating characteristic (ROC) curve.
Measurement of brain volume indices
The following nine indices were used to assess brain volumes in cerebral CT images: maximum cerebellar fissure width (CFW), right insular cisterns width (RICW), left insular cisterns width (LICW), maximum cerebral sulci width (CSW) at the skull vault, Evans index (the ratio of maximum transverse diameter of lateral ventricular anterior horn to maximum transverse diameter of skull interior at the same level), VBR (the ratio of ventricle area to the whole brain area at the maximum section level), frontal atrophy index (FAI, the ratio of frontal subarachnoid space area to the total area of frontal subarachnoid area and frontal lobe at the maximum section level), temporal lobe ratio (the ratio of the total area of bilateral temporal lobe to the whole brain area at the maximum section level), and occipital lobe ratio (the ratio of occipital lobe area to the whole brain area at the maximum section level). The values of CFW, RICW, LICW, CSW, as well as lateral ventricular anterior horn and skull interior maximal width were measured using the Display software (Neusoft). All areas were measured using Image-Pro Plus 6.0 software. Indices used to assess CA were measured by the first author (M.-X. C.). Each index was measured three times and averaged.
Demographic and clinical data
The following data were collected from the electronic medical database: (1) demographic information and medical history including age, sex, body mass index, smoking habits, alcohol consumption, history of hypertension, diabetes, stroke, coronary heart disease, heart failure, peripheral vascular disease, chronic obstructive pulmonary disease, hepatitis B, and tumors; (2) hemodialysis-related data including age at hemodialysis initiation, hemodialysis duration, weight loss during hemodialysis, pre-hemodialysis systolic blood pressure, pre-hemodialysis diastolic blood pressure, primary kidney disease leading to renal failure. Kt/V, a measure of dialysis adequacy, was calculated as

Statistical analysis
The distribution of continuous variables was tested using the Shapiro-Wilk test. Normally distributed variables were displayed as mean ± standard deviation and analyzed by the Student’s t-test. Non-normally distributed variables were described as median with interquartile ranges and assessed by the Wilcoxon-Mann-Whitney test. Chi-square test and Fisher’s test were used for categorical variables which were described as “frequency, percentage”. Parameters with statistically significant differences (defined as P < 0.1) in univariate analysis were further loaded into binary logistic regression to screen independent influencing factors. Spearman's correlation analysis was applied to investigate the bivariate correlation. Significance was defined as two-sided P < 0.05. SPSS 26.0 statistical software was used for data analysis and ROC curve plotting. The nomogram was established by the rms package of R software. R software was used to validate the nomogram and to plot the model calibration curves.
Results
Hemodialysis patients have reduced anterior brain volumes
Brain volume measurements for hemodialysis patients and controls, as well as age stratification data are shown in Table 1. RICW, LICW, maximal CSW, Evans index, VBR, FAI and temporal lobe ratio were different between patients and controls (age ≤55 years), while maximum CFW and occipital lobe ratio did not show inter-group differences. Moreover, 82.7% of hemodialysis patients exhibited one of the brain volume indices exceeding the upper 95% of healthy control levels. RICW, LICW, maximal CSW, VBR, FAI and temporal lobe ratio were different, while the Evans index, maximum CFW, and occipital lobe ratio were indifferent in patients ≤35 years of age. The brain volume comparison between patients and controls in age groups 36–45 and 46–55 revealed that RICW, LICW, maximal CSW, Evans index, VBR, and FAI were significantly larger, and the temporal lobe ratio was significantly smaller in hemodialysis patients. Maximum CFW and occipital lobe ratio were indifferent.
Comparison of brain volumes between hemodialysis patients and healthy controls.
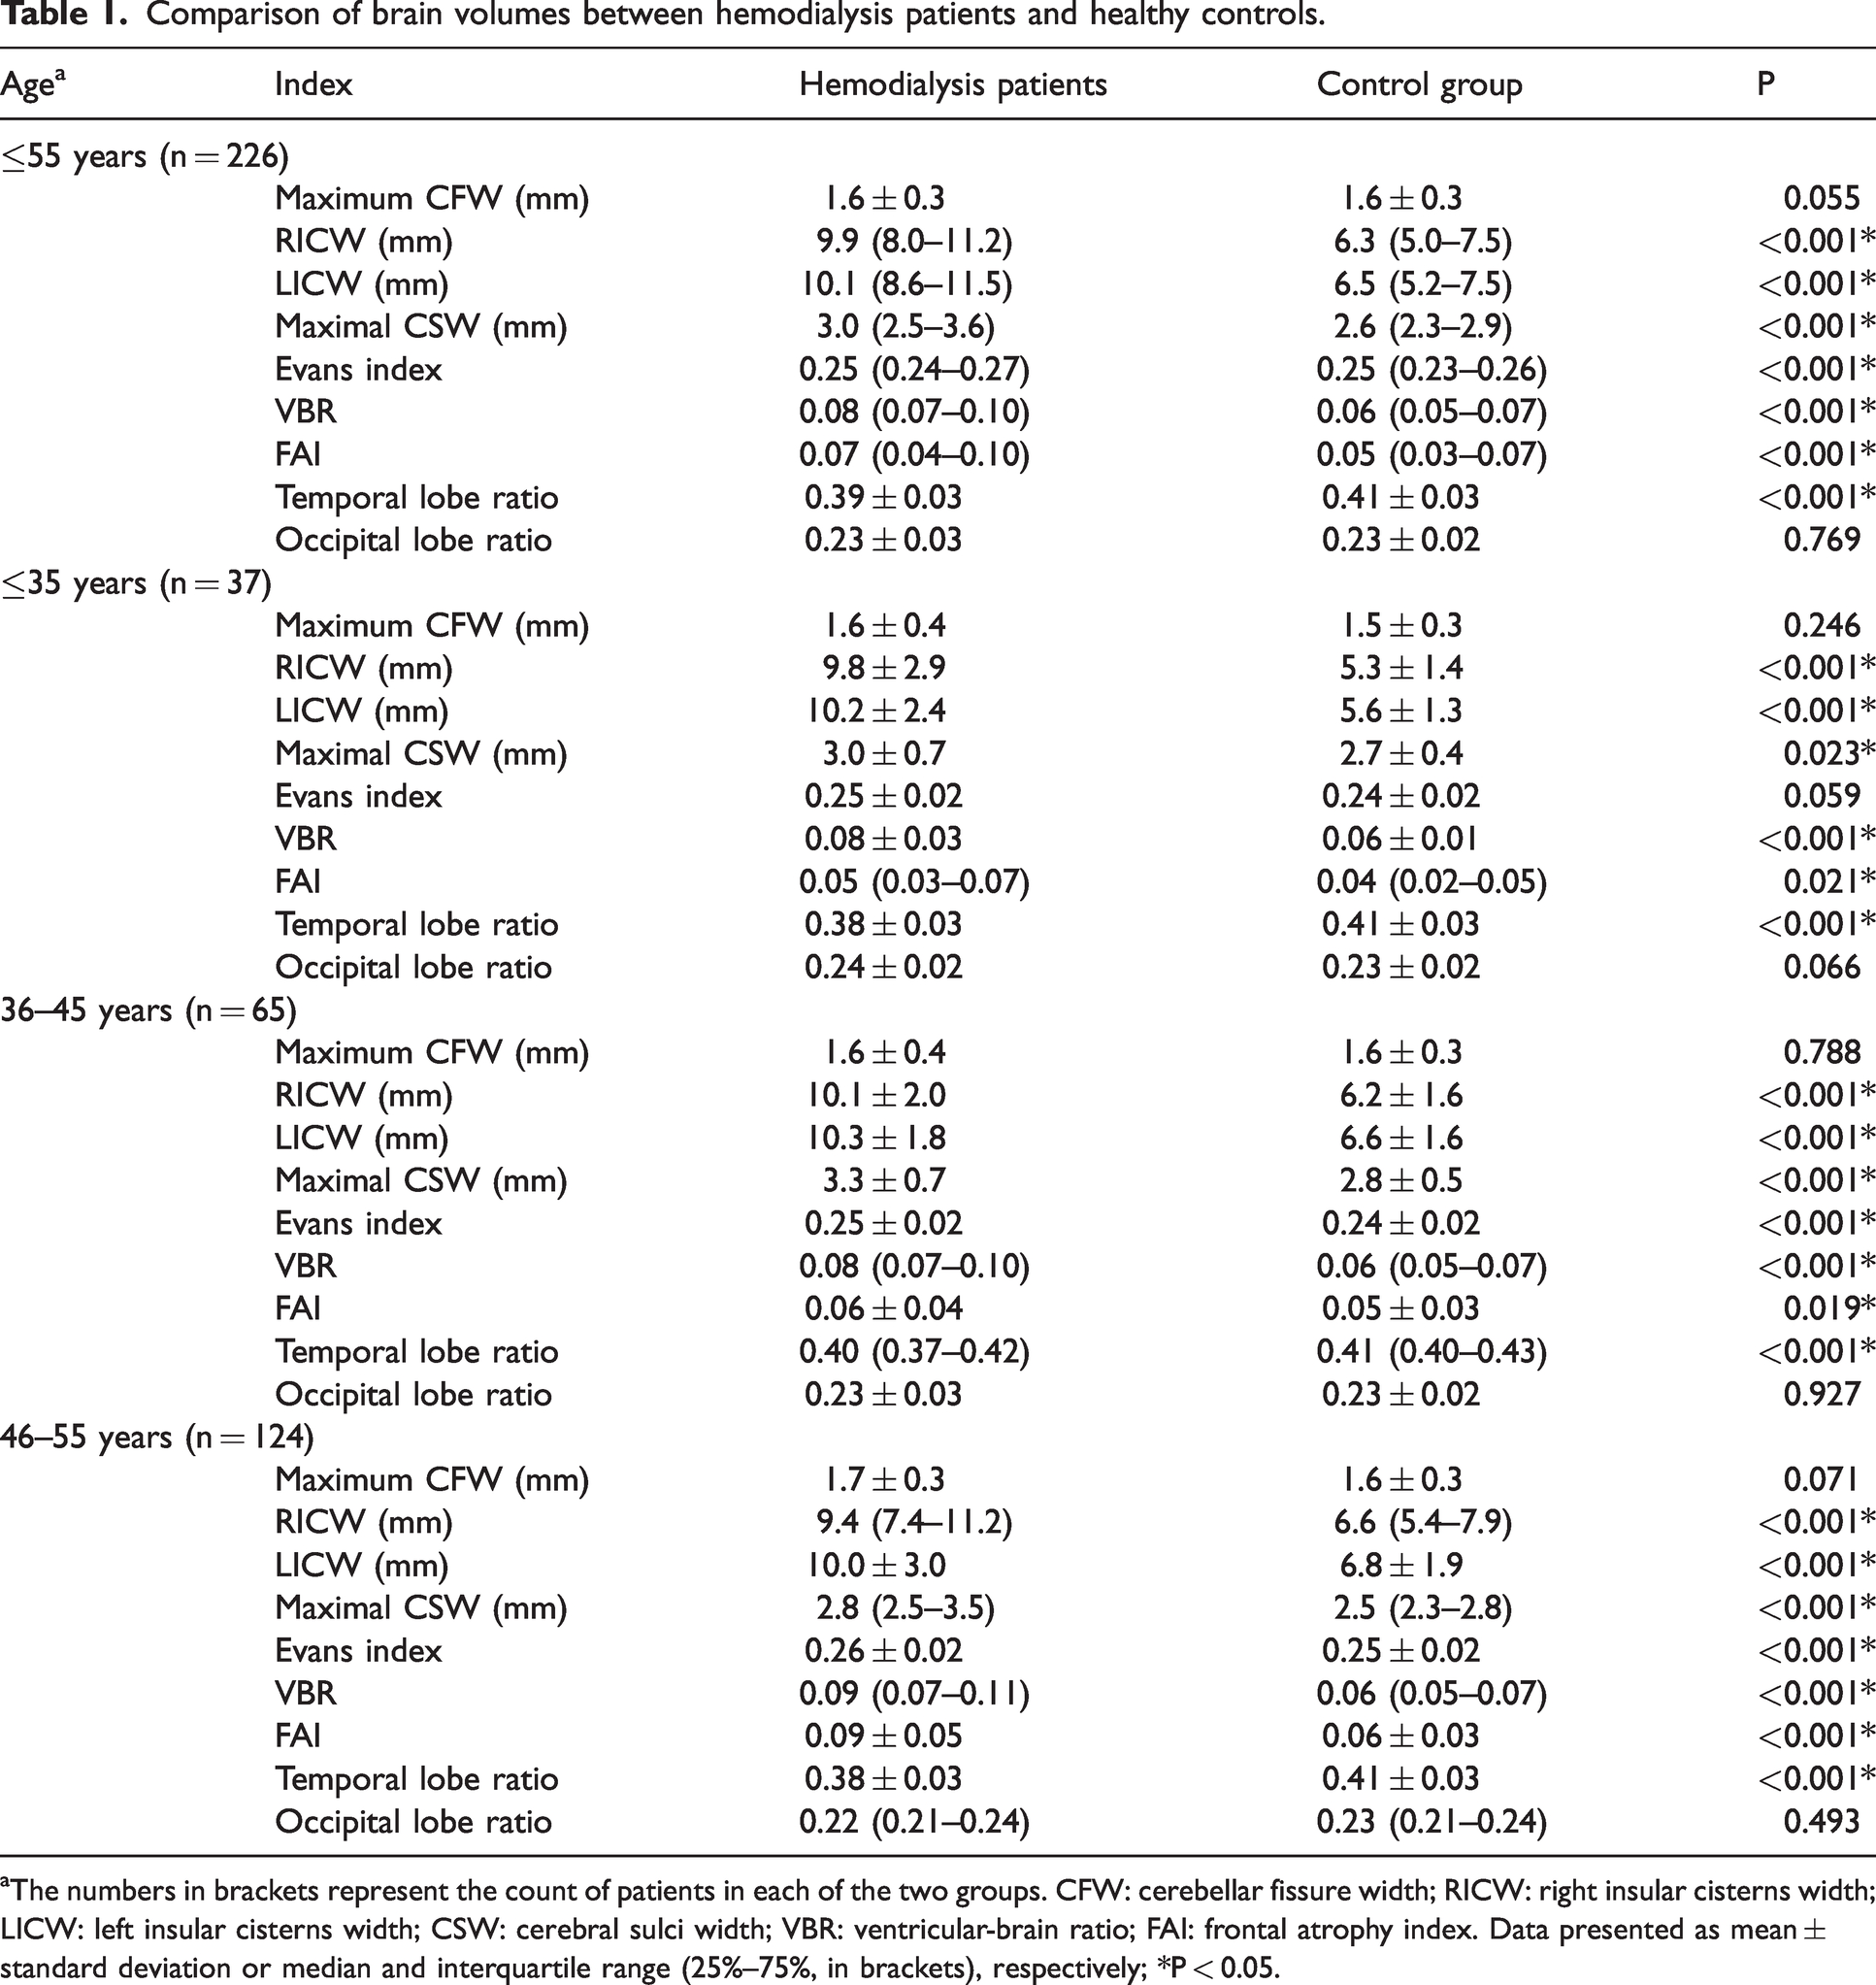
aThe numbers in brackets represent the count of patients in each of the two groups. CFW: cerebellar fissure width; RICW: right insular cisterns width; LICW: left insular cisterns width; CSW: cerebral sulci width; VBR: ventricular-brain ratio; FAI: frontal atrophy index. Data presented as mean ± standard deviation or median and interquartile range (25%–75%, in brackets), respectively; *P < 0.05.
Hemodialysis patients having mild or severe CA exhibit different clinical parameters
Dividing hemodialysis patients equally into no or mild and severe CA groups according to VBR, revealed a median VBR of 0.067 in “no or mild CA” group and of 0.103 in “severe CA” group. Kt/V, red blood cell count, erythrocyte hematocrit, hemoglobin, platelet count, potassium, calcium, magnesium, HDL-C, total protein, albumin were significantly lower, while AST and GGT were significantly higher in the severe CA group as revealed by univariate analysis (Table S1).
Kt/V and hemoglobin are independent influencing factors on CA degree
Binary logistic regression showed that Kt/V (OR = 0.246, 95% confidence interval (CI): 0.062–0.983, P = 0.047) and hemoglobin (OR = 0.979, 95%CI: 0.958–1.000, P = 0.049) were factors independently determining CA degree (Table 2). Correlation analysis showed that Kt/V (r = −0.270, P = 0.001) and hemoglobin levels (r = −0.206, P = 0.002) are negatively correlated with CA degree. This indicates that dialysis adequacy is an independent protective factor, and anemia is an independent risk factor for severe CA.
Binary logistic regression of factors affecting CA degree.
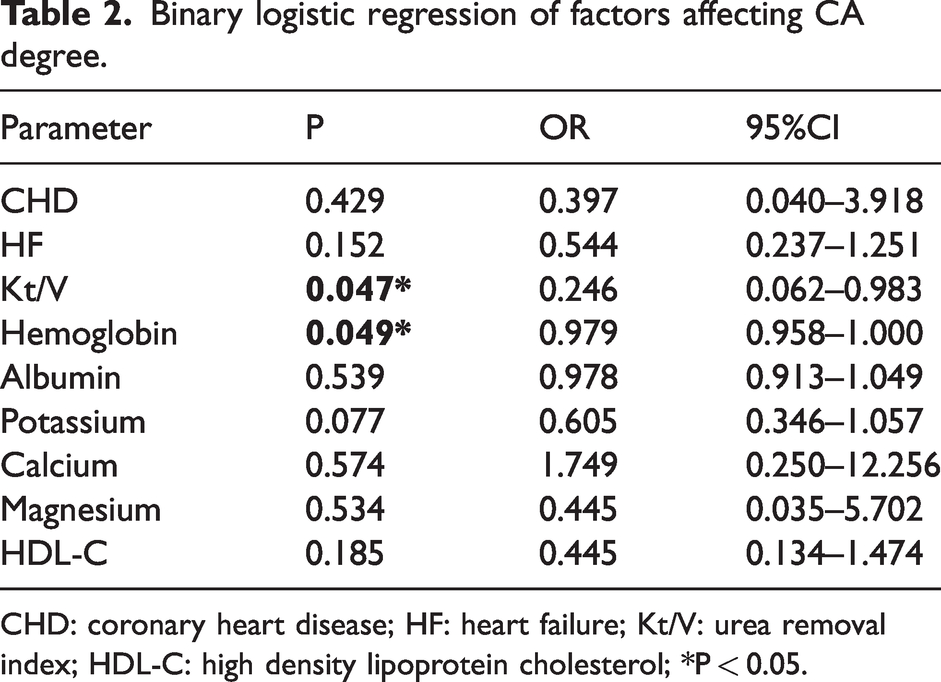
CHD: coronary heart disease; HF: heart failure; Kt/V: urea removal index; HDL-C: high density lipoprotein cholesterol; *P < 0.05.
Predictive value of Kt/V and hemoglobin for severe CA
The predictive values of Kt/V and hemoglobin for severe CA were investigated using ROC curves (Figure 2). The optimal cut-off value for Kt/V was 1.305, with sensitivity of 0.579, specificity of 0.730, and area under the ROC curve of 0.656 (95%CI: 0.568–0.744, P = 0.001, Figure 2(a)). The optimal cut-off value for hemoglobin was 105.5 g/L, with sensitivity of 0.708, specificity of 0.593, and area under the ROC curve of 0.619 (95%CI: 0.545–0.693, P = 0.002, Figure 2(b)). When Kt/V and hemoglobin were combined for prediction, the sensitivity was 0.649, specificity was 0.711, and area under the ROC curve was 0.701 (95%CI: 0.617–0.785, P < 0.001, Figure 2(c)).
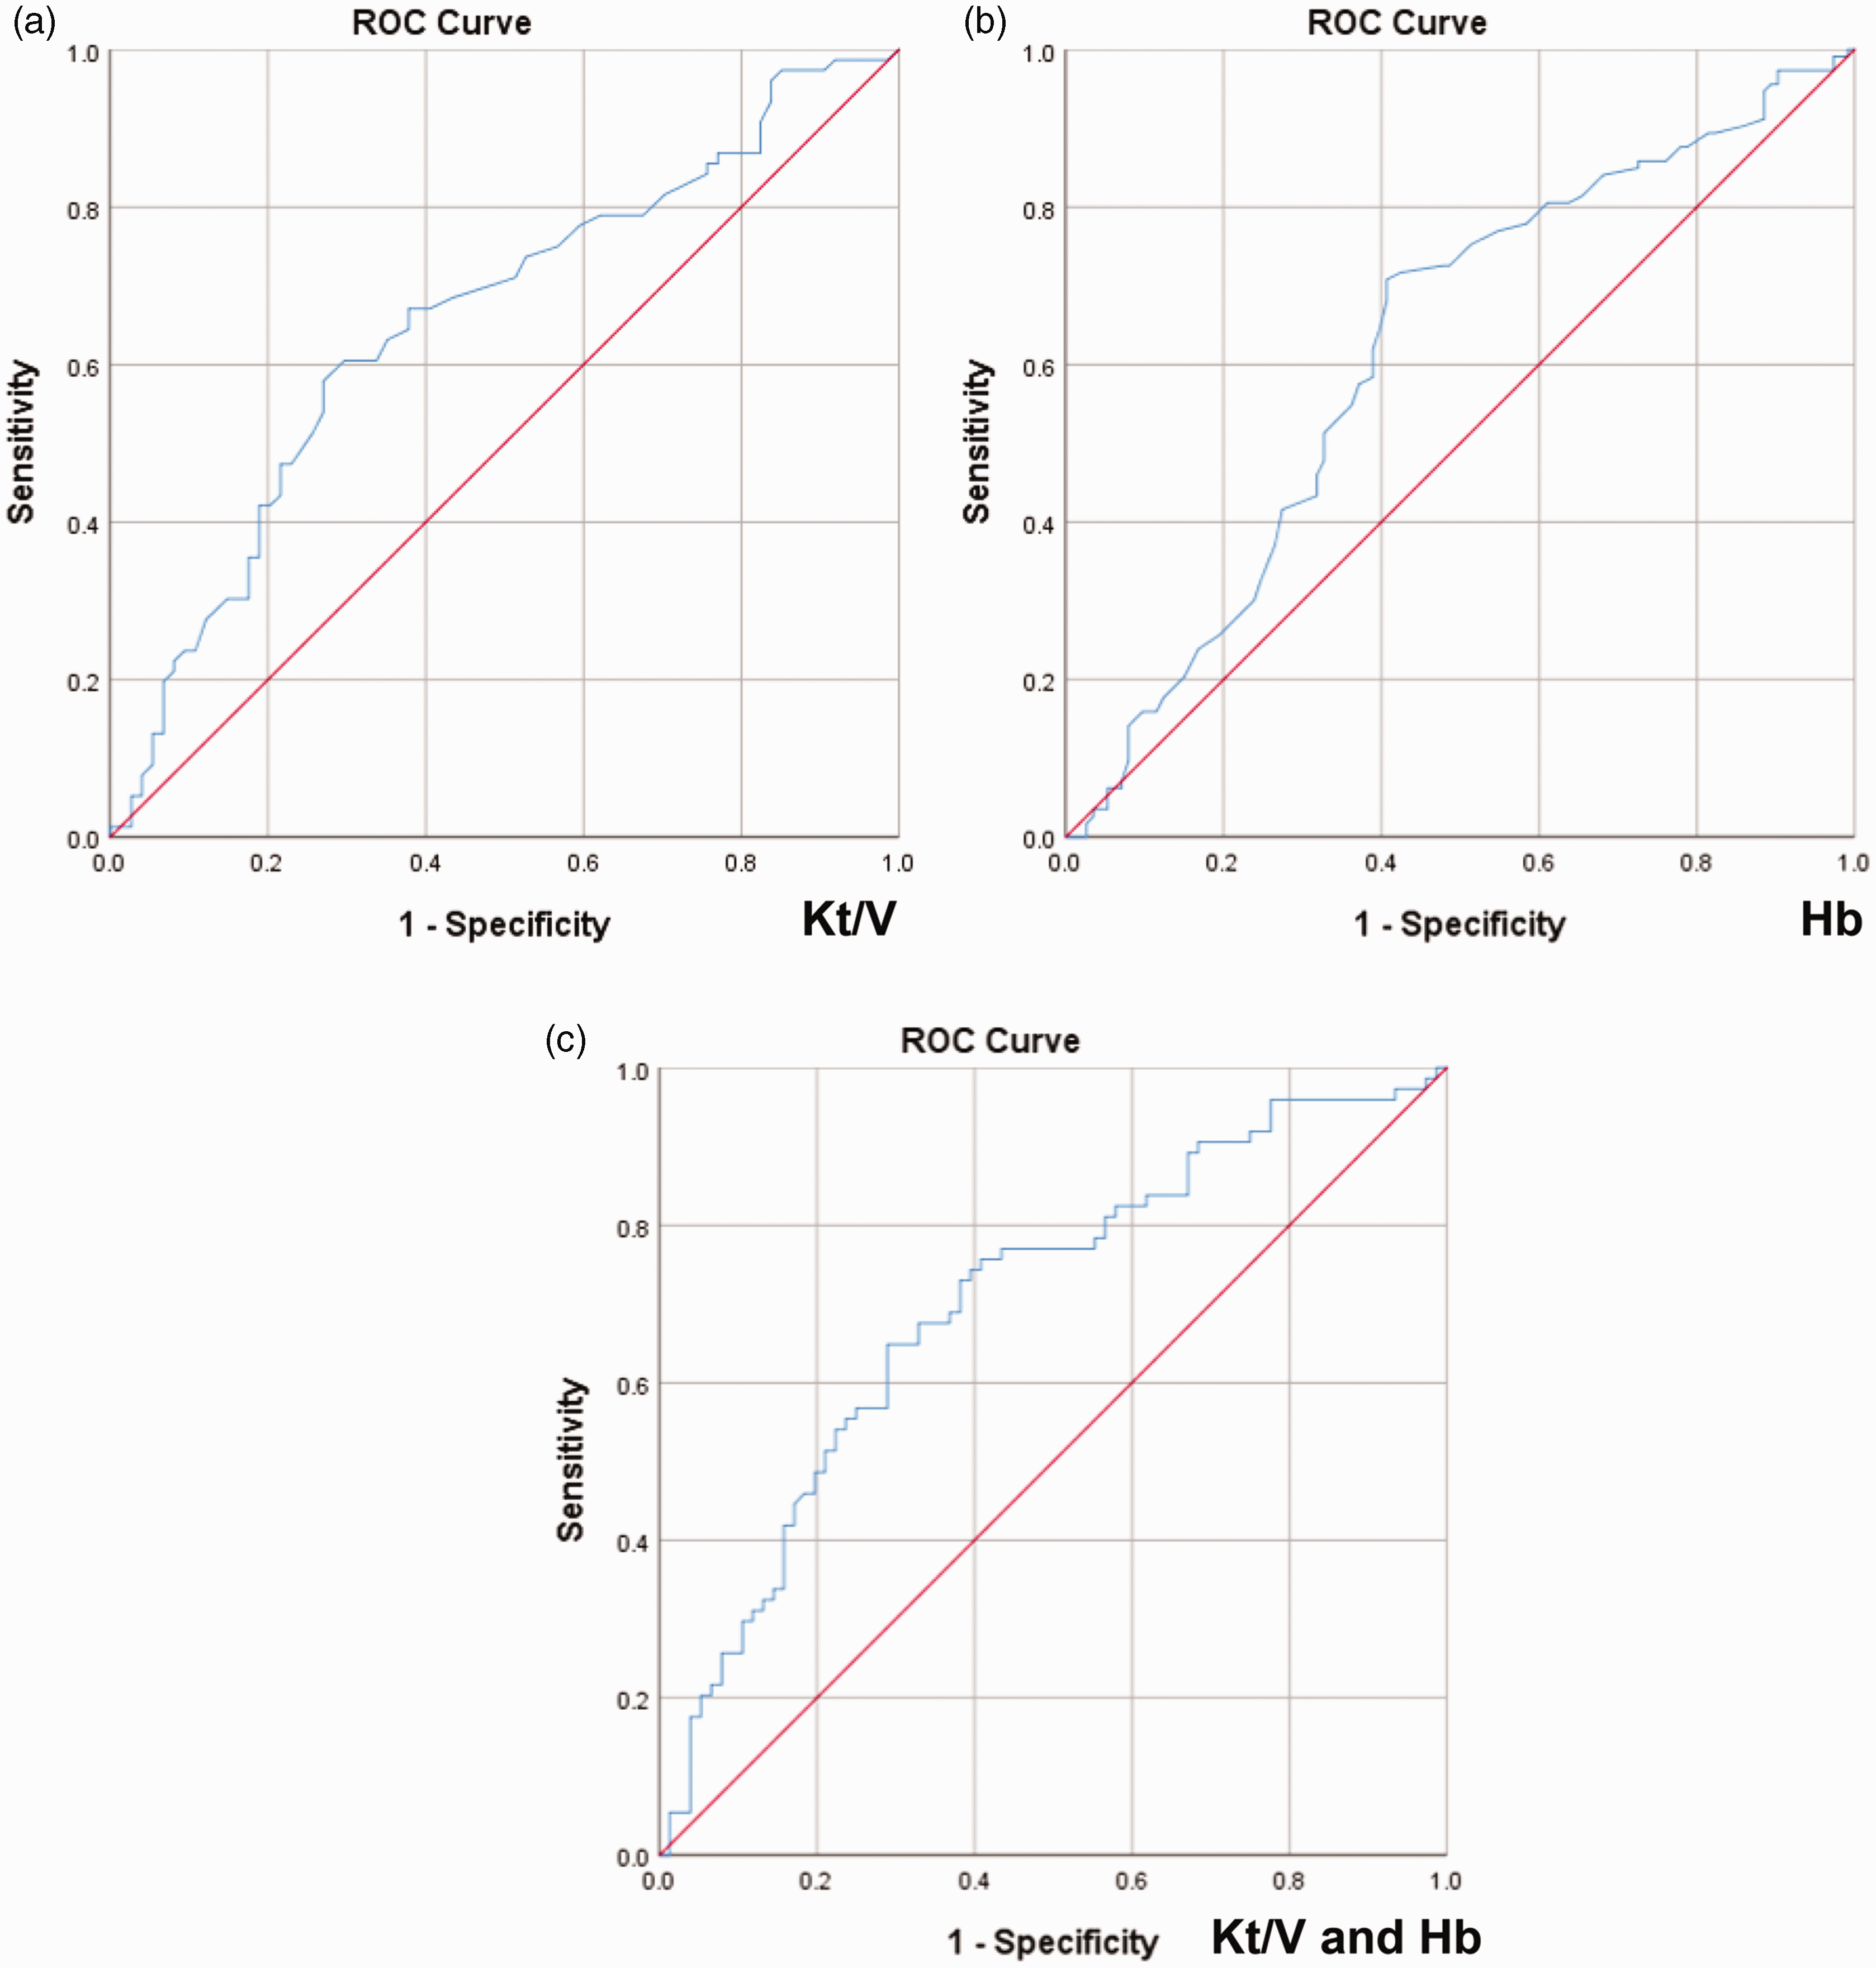
Predictive value of Kt/V and hemoglobin for severe CA. (a) Predictive value of Kt/V for severe CA. (b) Predictive value of hemoglobin for severe CA and (c) Kt/V and hemoglobin were combined for predicting severe CA. ROC: receiver operating characteristic; Hb: hemoglobin.
Generation and validation of a predictive nomogram for developing severe CA in hemodialysis patients
A predictive nomogram for developing severe CA in hemodialysis patients that combined Kt/V and hemoglobin levels was generated (Figure 3(a)). The nomogram is based on total points obtained from every predictor. For example, when Kt/V is 1.2 and hemoglobin is 90 g/L, the corresponding points are 67.5 and 25, respectively, obtained by drawing a vertical line to the points line. The total points are 67.5 + 25 = 92.5, corresponding to an approximately 60% probability of developing severe CA (Figure S1).
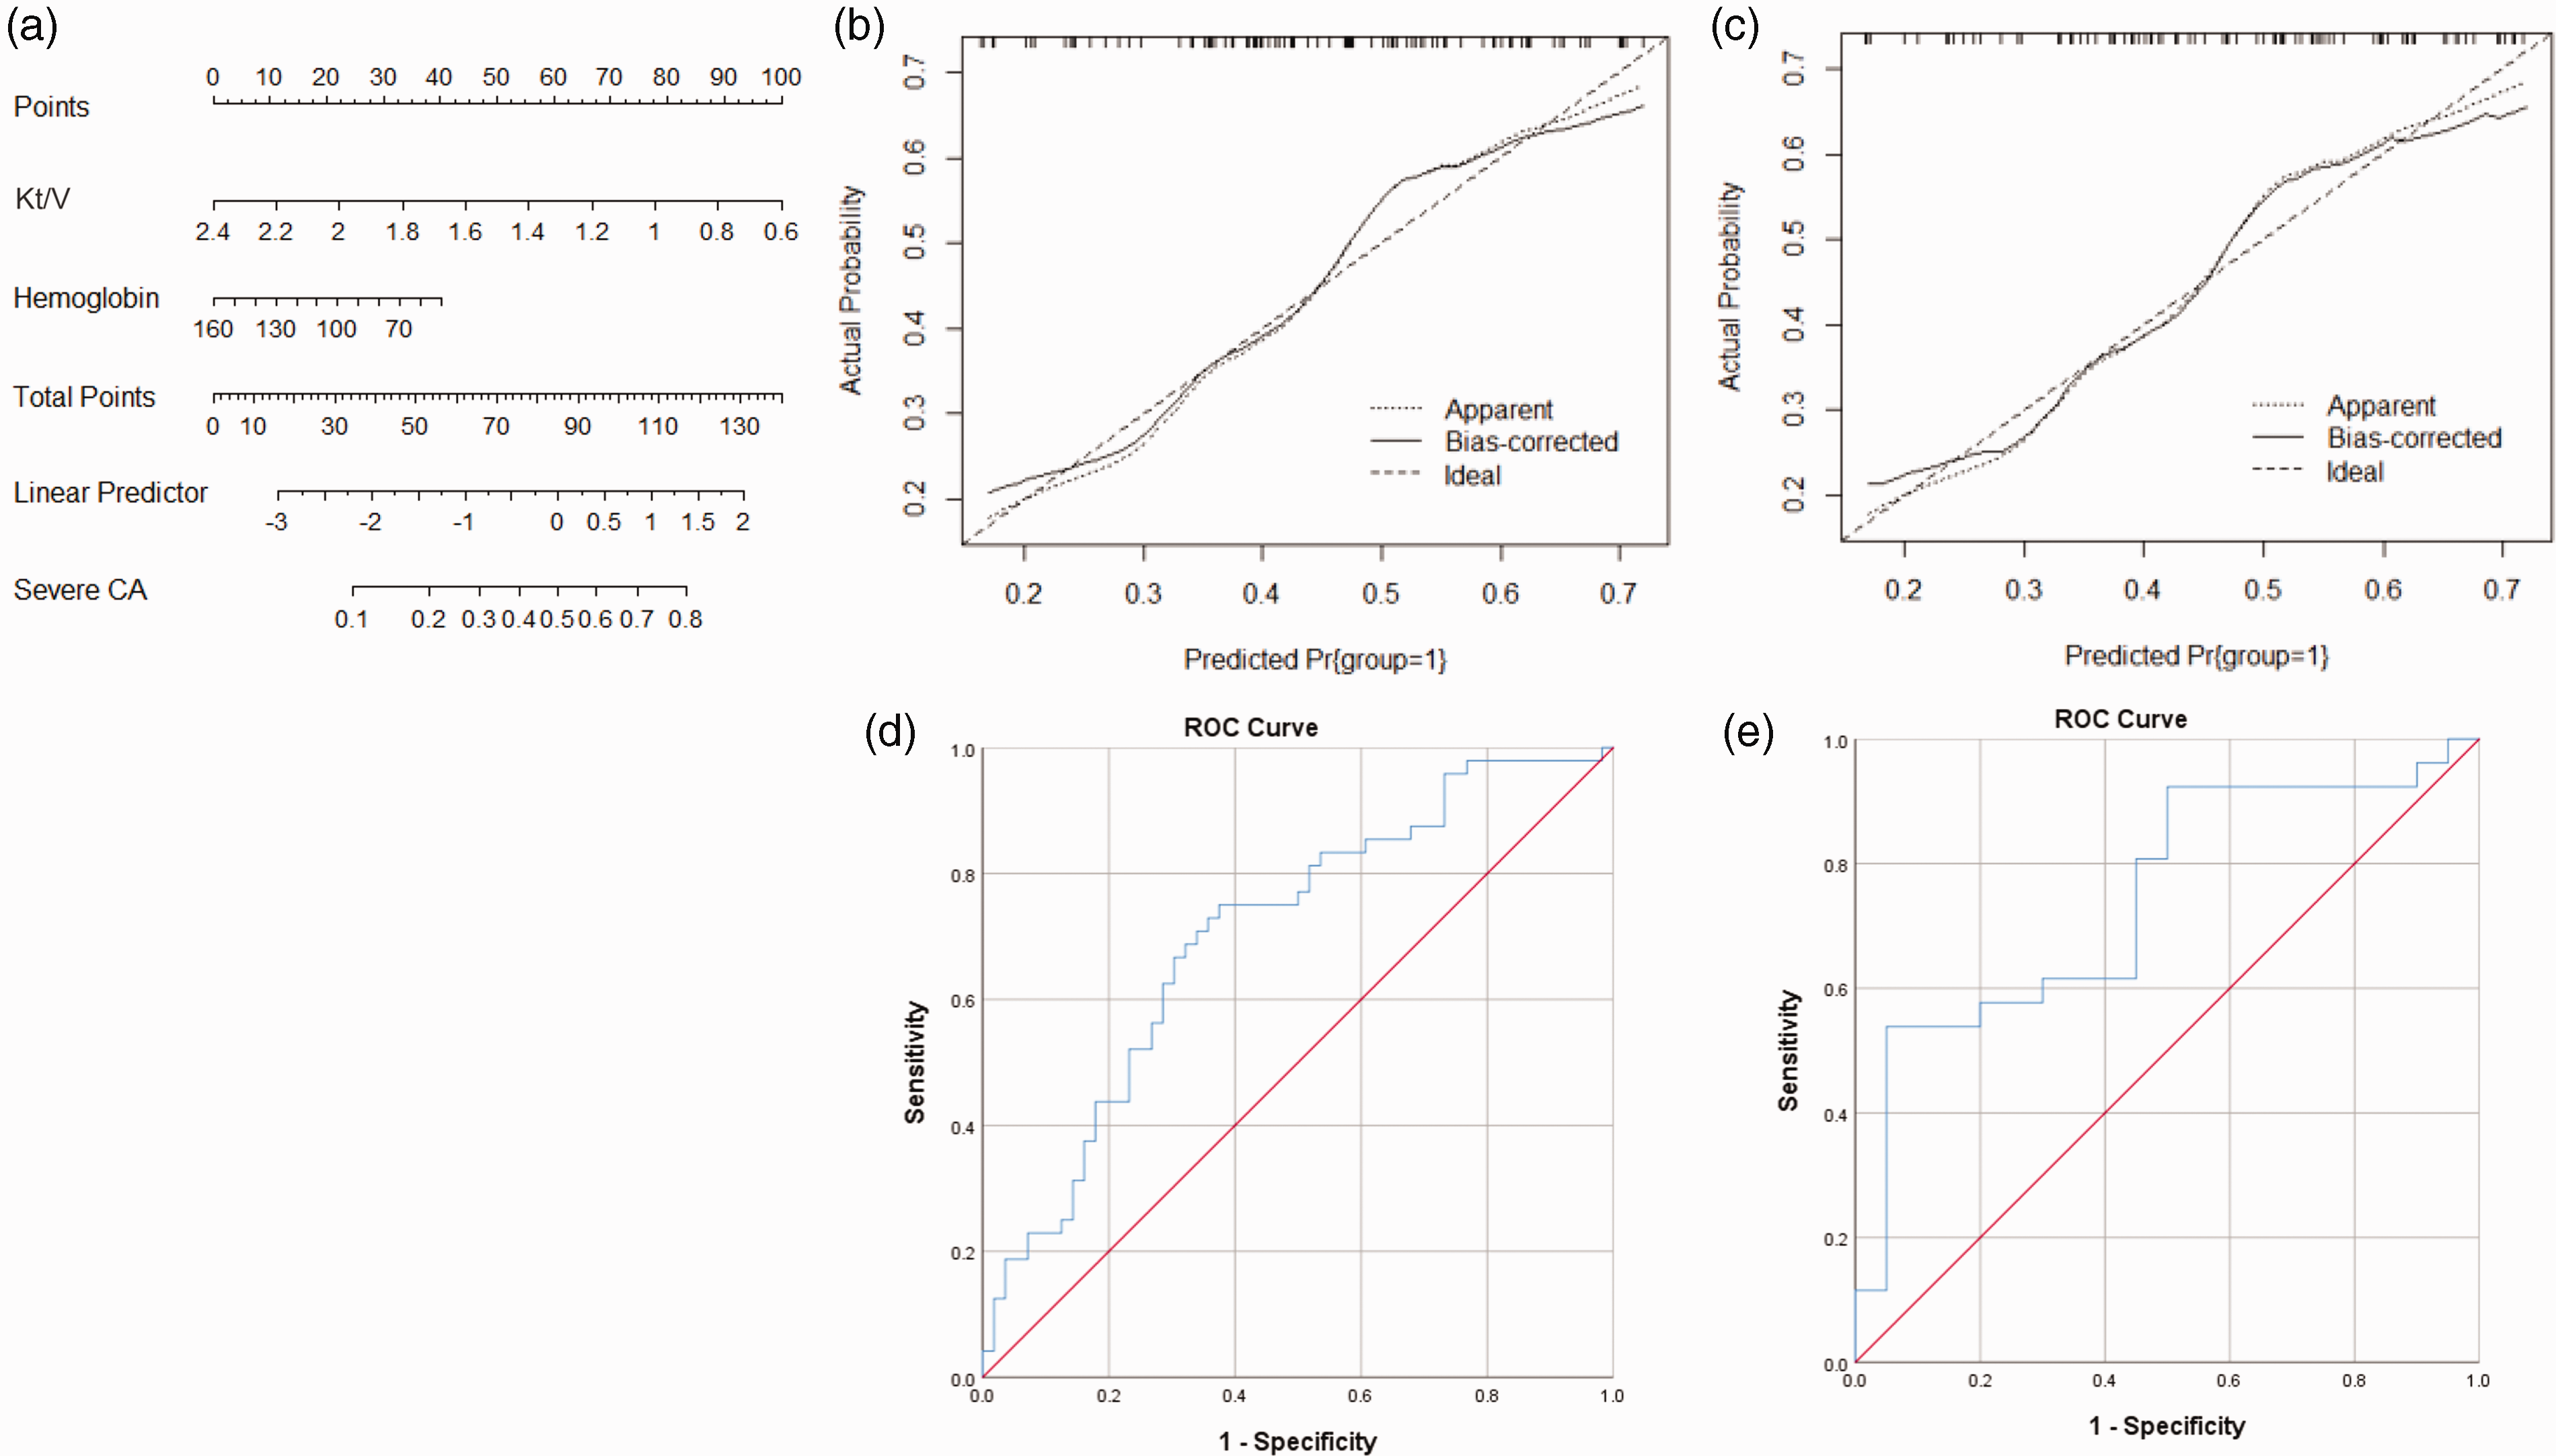
Generation and validation of the nomogram by including Kt/V and hemoglobin. (a) The nomogram includes Kt/V and hemoglobin for predicting severe CA based on the training group. The nomogram is read as follows: sum all points obtained by making vertical lines upward for each variable. The probability of the total points projected on the bottom scale represents the probability of developing severe CA. The model calibration curves for the nomogram: (b) the training group; (c) the validation group. Nomograms-predicted probability of developing severe CA is plotted on the x-axis, and actual probability is plotted on the y-axis. The area under ROC curves for the nomogram: (d) the training group and (e) the validation group.
The nomogram calibration curves of the training group (Figure 3(b)) and validation group (Figure 3(c)) are close to the diagonal, suggesting the nomogram is relatively well calibrated. The areas under ROC curves for training group and validation group are 0.703 (95%CI: 0.603–0.803, P < 0.001, Figure 3(d)) and 0.744 (95%CI: 0.599–0.889, P = 0.005, Figure 3(e)), respectively, indicating a favorable yet not optimal discrimination.
Optimization of the predictive nomogram
More potential predictors were included to optimize the nomogram. To this end, parameters reaching P values <0.1 in univariate analysis were incorporated (Figure S2). Albumin, potassium, and calcium corresponded to longer line segments in the nomogram, indicating a considerable effect on CA degree, were thus added separately or in different combinations into the nomogram. We list the two nomograms with the best calibration and discrimination in the main text, while all other combinations are provided in the supplement (Supplementary material).
The nomogram that combined Kt/V, hemoglobin, potassium, and calcium is given in Figure 4(a). The calibration curves exhibited good consistencies between the actual and predicted probabilities in both the training (Figure 4(b)) and the validation (Figure 4(c)) groups. The areas under ROC curves for training group and validation group were 0.748 (95%CI: 0.654–0.842, P < 0.001, Figure 4(d)) and 0.806 (95%CI: 0.677–0.935, P < 0.001, Figure 4(e)), respectively.
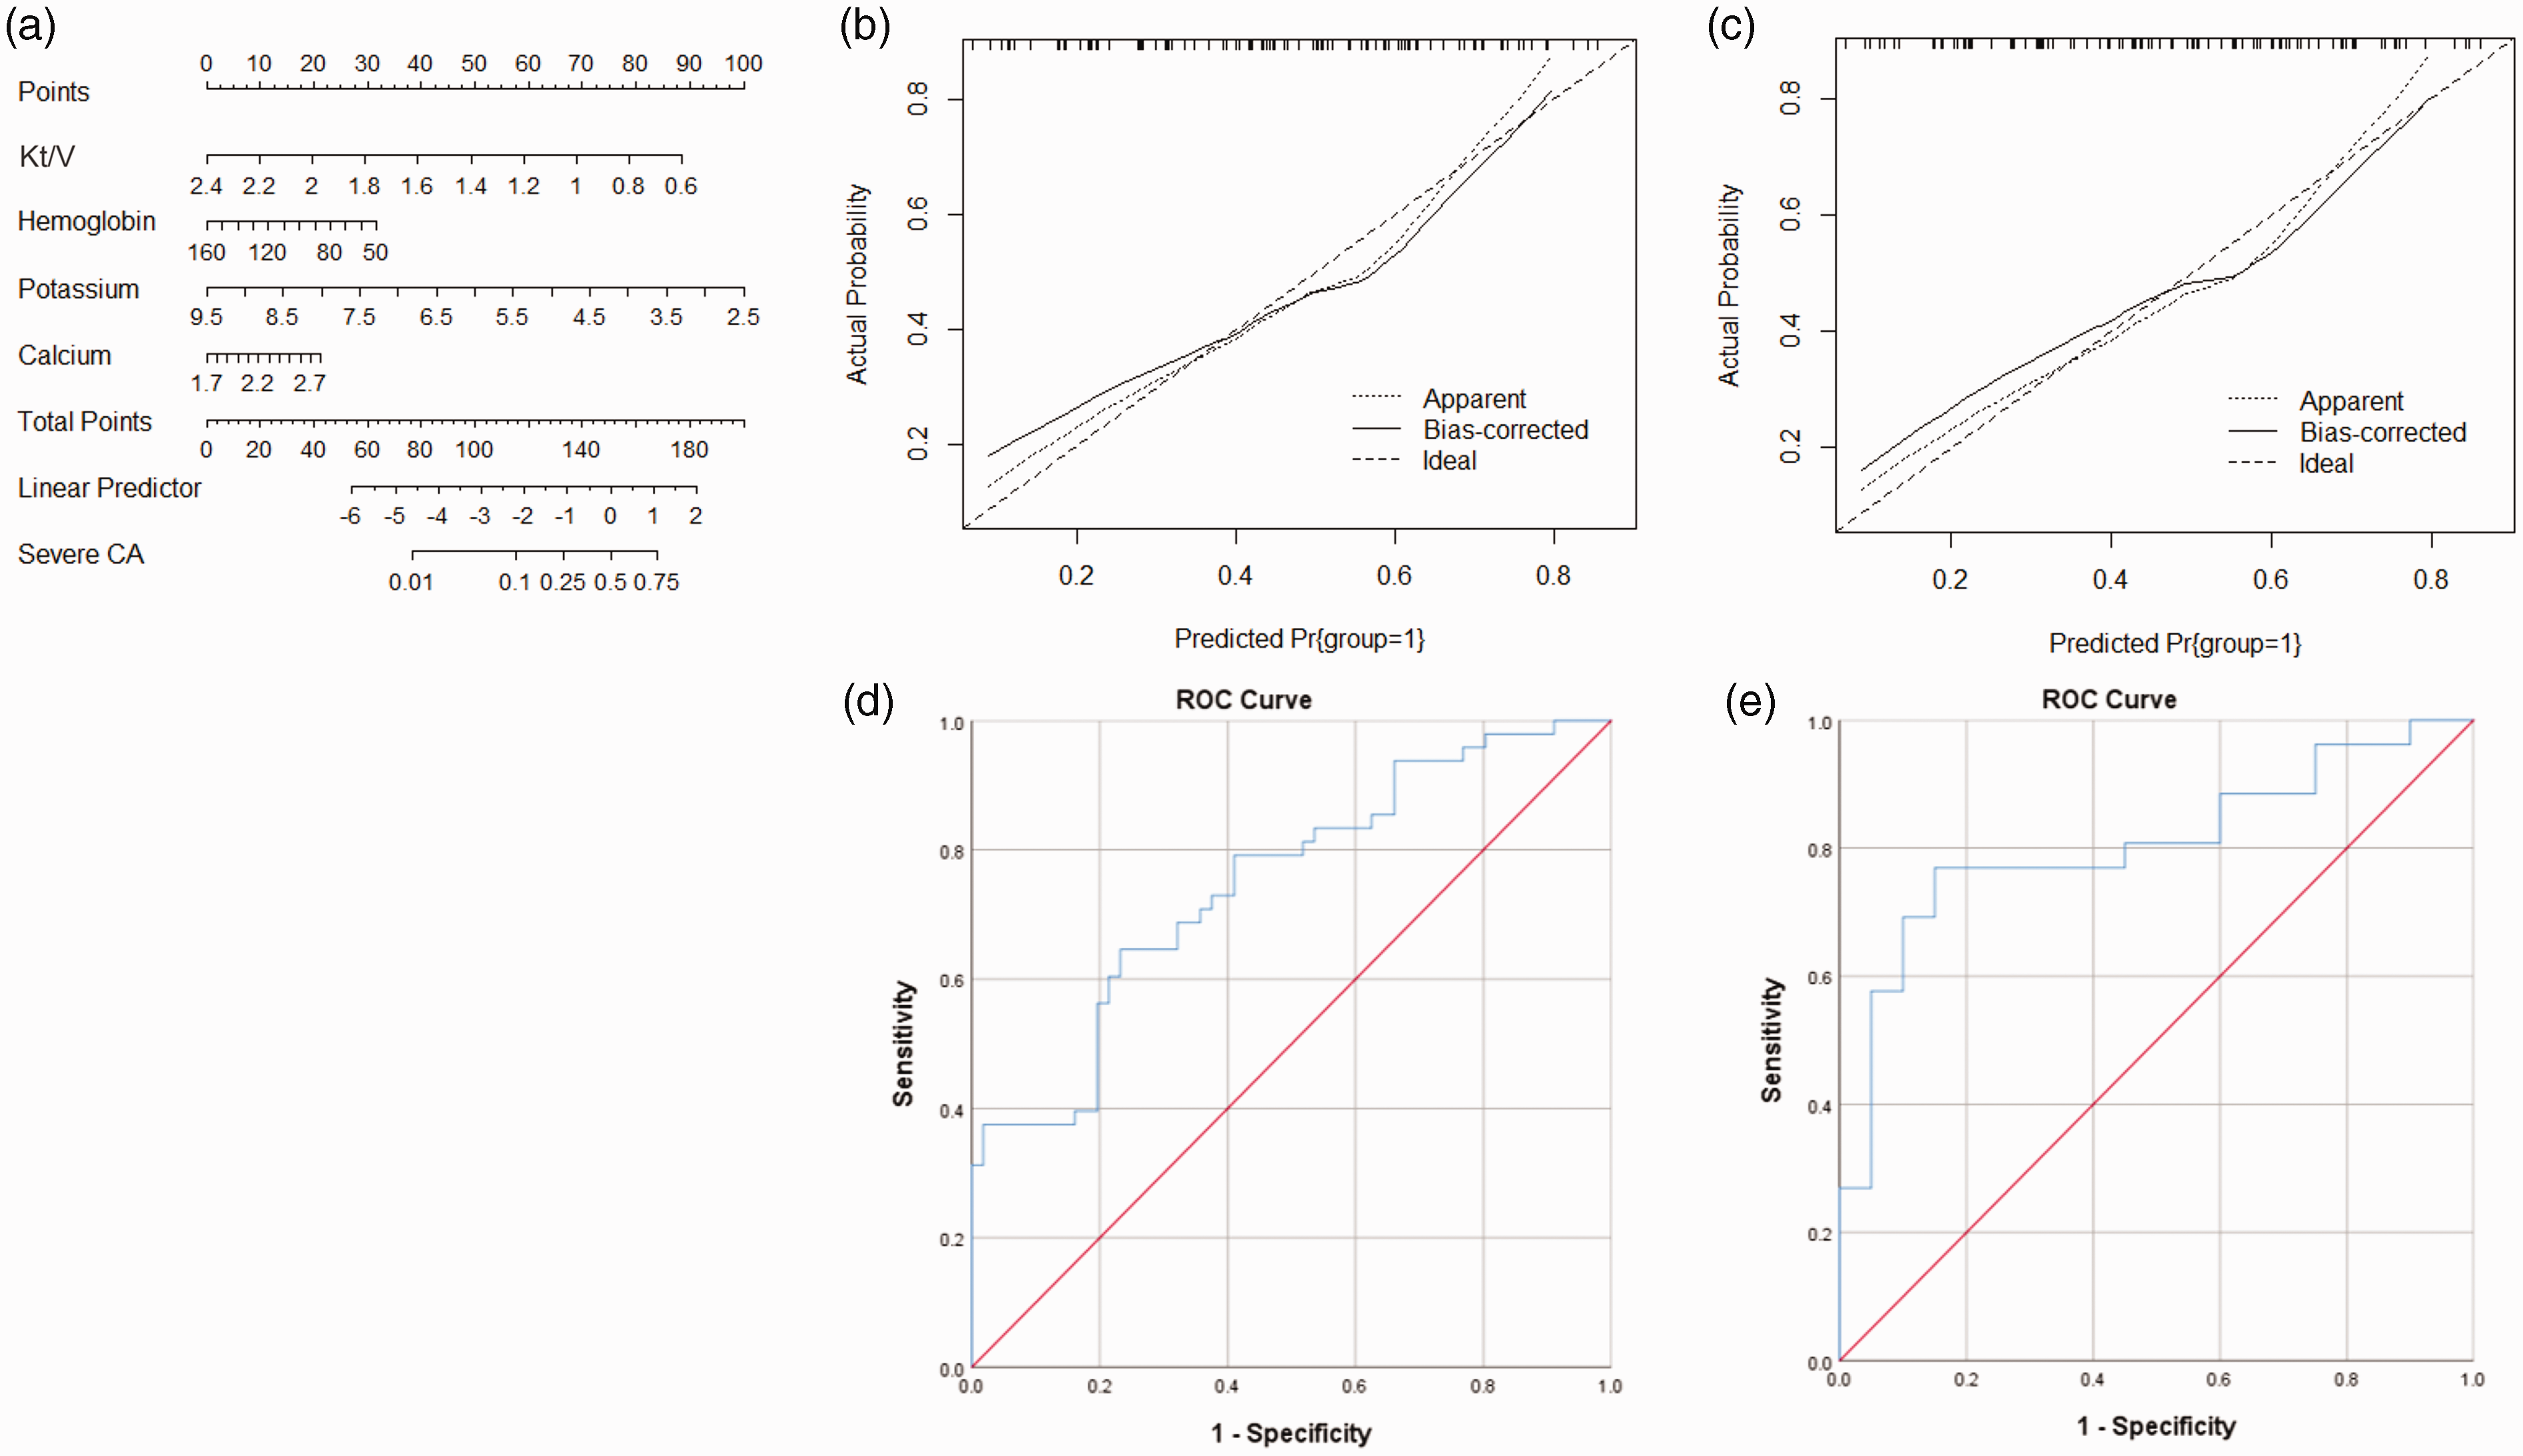
Generation and validation of the nomogram by including Kt/V, hemoglobin, potassium, and calcium. (a) The nomogram includes Kt/V, hemoglobin, potassium, and calcium for predicting severe CA based on the training group. The model calibration curves for the nomogram: (b) the training group; (c) the validation group. The area under ROC curves for the nomogram: (d) the training group and (e) the validation group.
The nomogram that combined Kt/V, hemoglobin, albumin, potassium, and calcium is given in Figure 5(a). The calibration curves of the training (Figure 5(b)) and validation (Figure 5(c)) groups confirmed a favorable calibration. The areas under ROC curves for training and validation groups were 0.759 (95%CI: 0.668–0.851, P < 0.001, Figure 5(d)) and 0.804 (95%CI: 0.674–0.933, P < 0.001, Figure 5(e)), respectively.
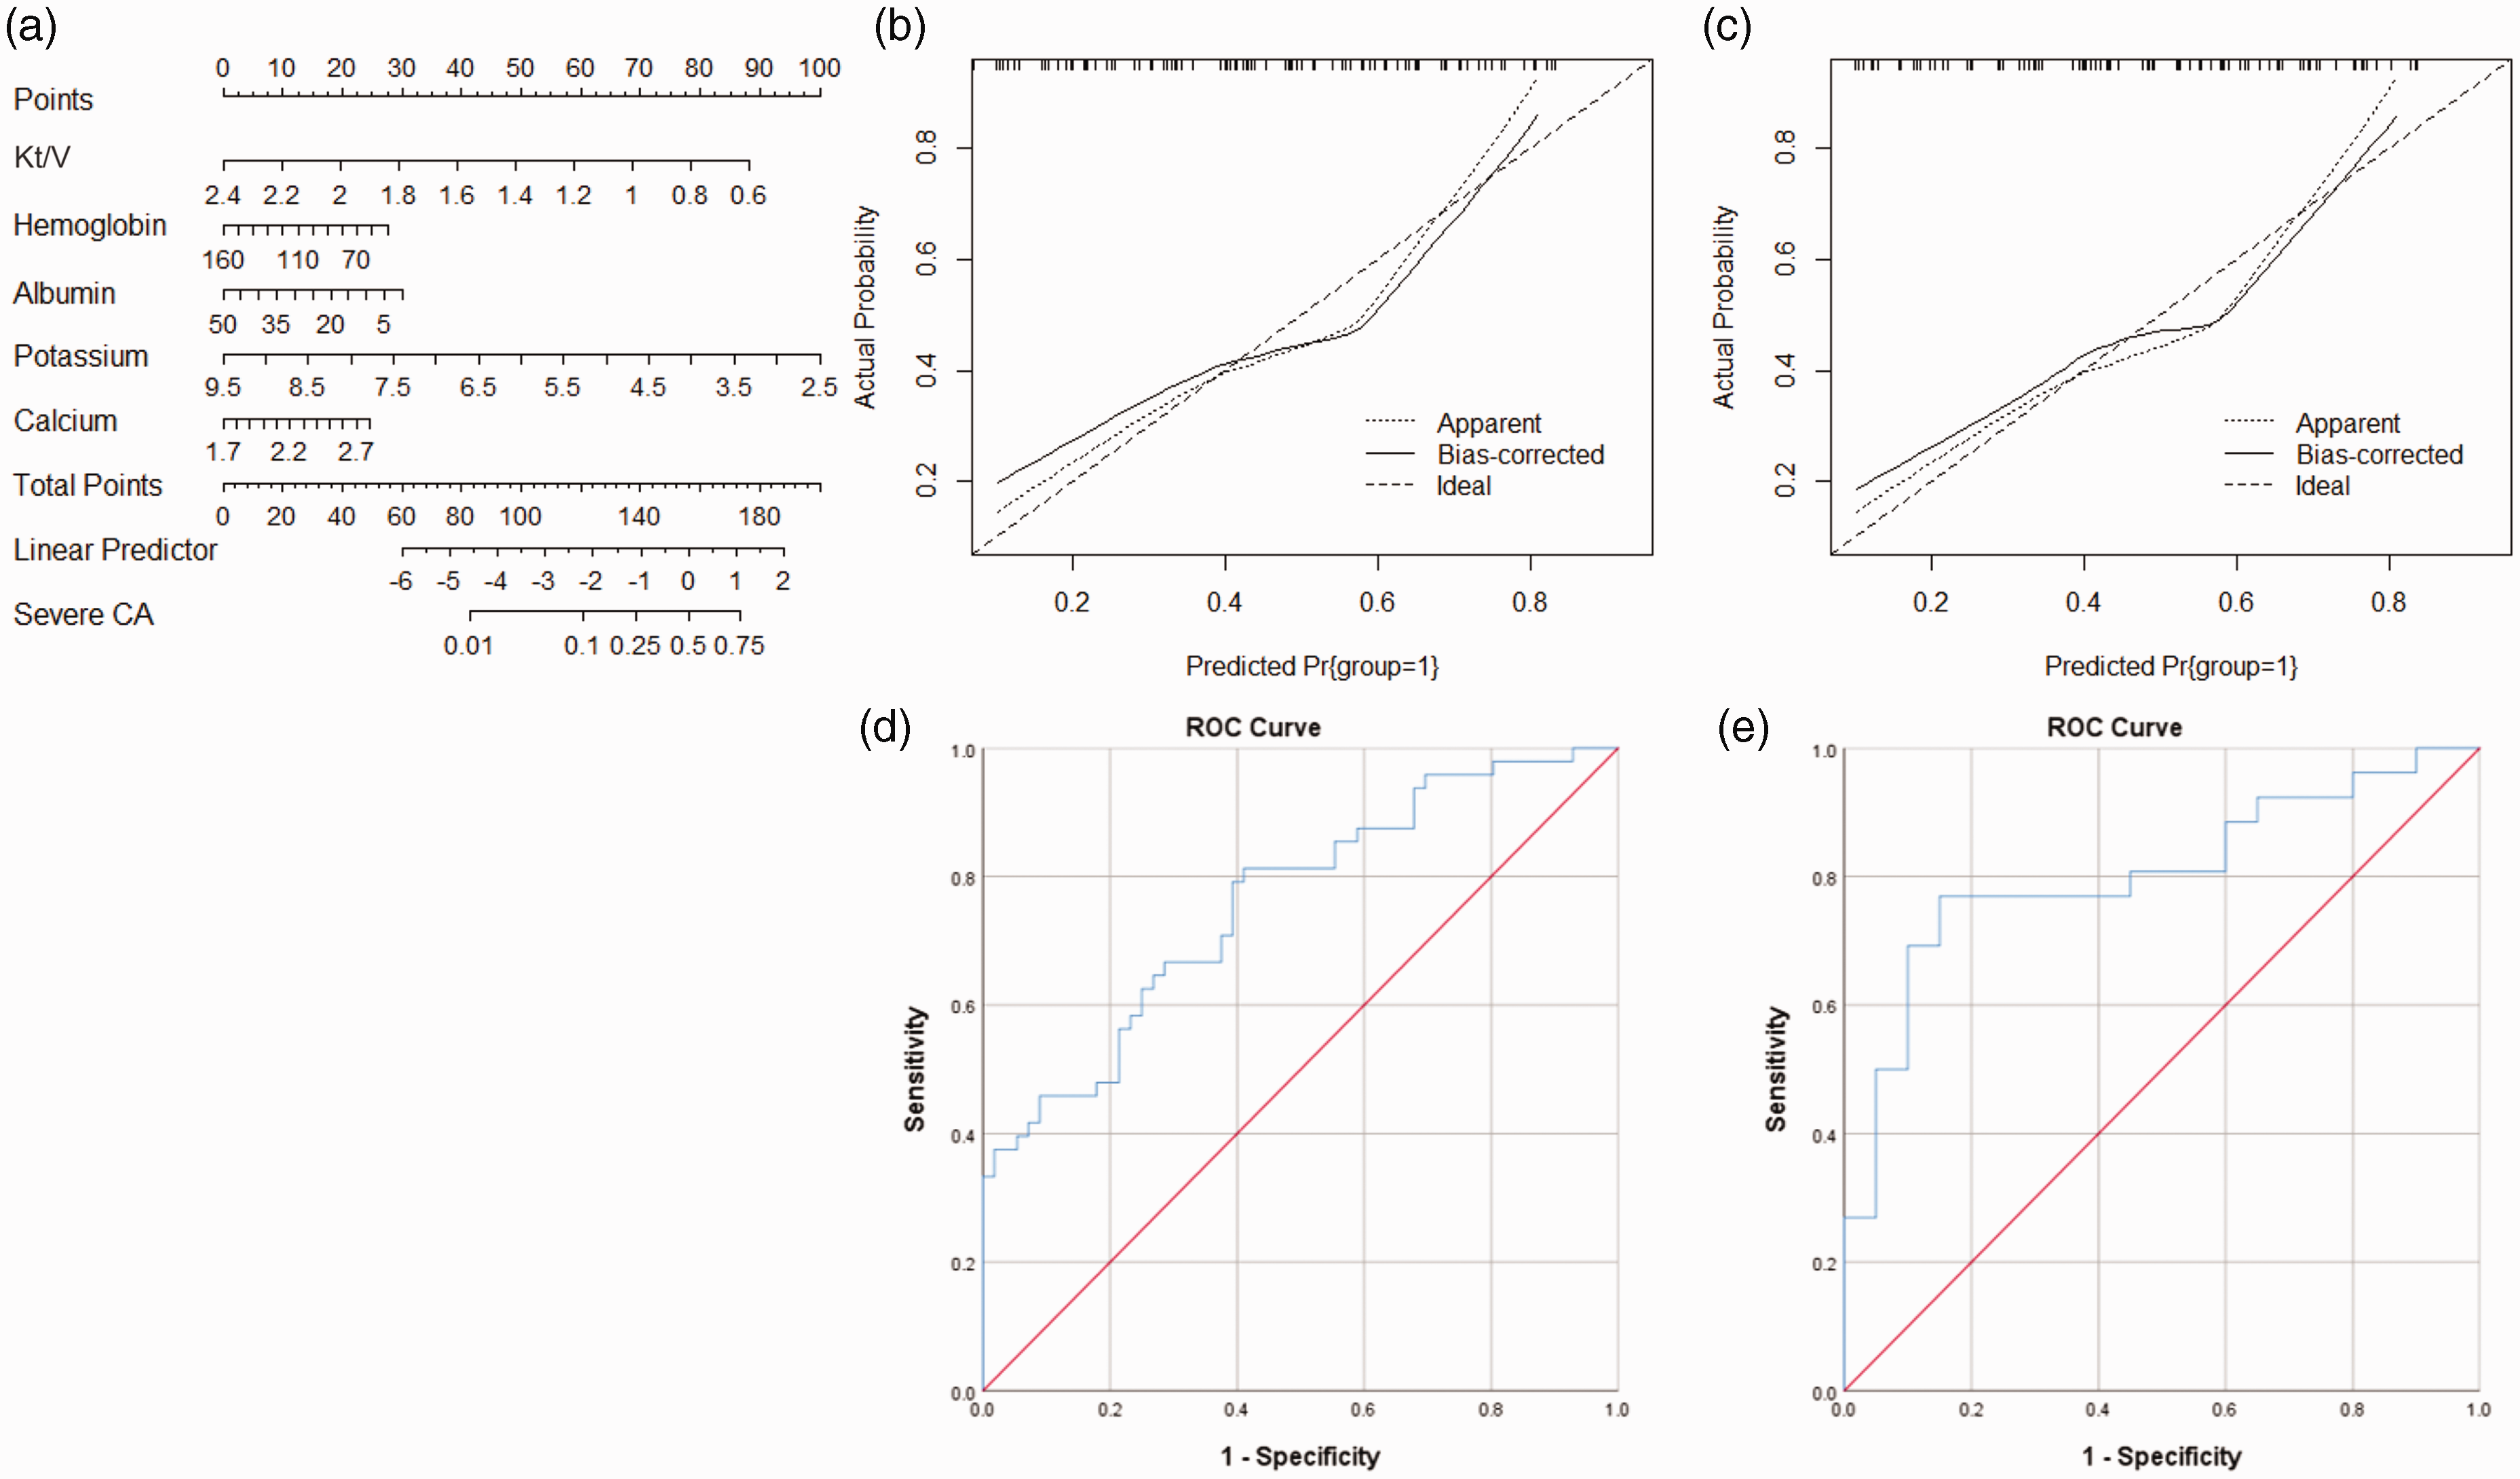
Generation and validation of the nomogram by including Kt/V, hemoglobin, albumin, potassium, and calcium. (a) The nomogram includes Kt/V, hemoglobin, albumin, potassium, and calcium for predicting severe CA based on the training group. The model calibration curves for the nomogram: (b) the training group; (c) the validation group. The area under ROC curves for the nomogram: (d) the training group and (e) the validation group.
Discussion
Differences in the effects of hemodialysis on different brain regions
We show that hemodialysis patients (≤55 years) were more likely to exhibit widened sulci, enlarged ventricles, and reduced parenchymal volumes. This is consistent with previous studies and is well in line with the higher incidence of CA in this population.17,23,24 Frontal and temporal lobes were significantly smaller in hemodialysis patients (P < 0.001). In contrast, occipital lobe volumes were indifferent (P = 0.769) compared to controls. This was not reported so far by other studies and indicates that hemodialysis patients mainly exhibit anterior brain atrophy. Indeed, Kamata et al. 15 found that CA in hemodialysis patients is predominantly localized in the frontal lobe, but these authors did not investigate cerebellar and occipital indices. Prohovnik et al. 25 compared cerebrospinal fluid (CSF) amounts between ten hemodialysis patients (mean age 61 ± 10 years) and six normal controls (mean age 78 ± 7 years), and found that hemodialysis patients had significantly higher CSF volumes in the cortical sulcus (frontal and temporal lobes), and in the edges of the third and lateral ventricles (including the anterior nucleus of the thalamus). Cerebellar atrophy was not found. However, the study by Prohovnik et al. had a relatively small sample size. This may have statistically ‘masked’ any significant findings regarding cerebellar atrophy. In our study, the younger age (≤55 years) may explain the lack of cerebellar atrophy but this does not mean excluding the possibility that there is cerebellar atrophy in hemodialysis patients. Thus, future studies need to address a wider age range in reasonably sized cohorts to provide reliable data on a potential cerebellar atrophy. Meanwhile, occipital atrophy was also not found in our study. This indicates that there are differences in the CA degree between the anterior and posterior brain probably resulting from the differences in blood supply between these regions. The relative abundance of perfusion in the posterior circulation may have a better effect on oxygenation and toxin clearance. Moreover, the posterior circulation is seemingly less sensitive to ischemia and hypoxia than the anterior circulation. 26
Protective effect of dialysis adequacy
The accumulation of uremic toxins is closely associated with endothelial dysfunction and arteriosclerosis, which further leads to cerebral vascular dysfunction and eventually CA. 27 Carbamylated proteins formed by conversion of urea to active cyanate and isocyanate may contribute to this as they are known to significantly increase the risk of atherosclerosis and cardiovascular disease in patients with kidney disease. 28 In addition, oxidative stress and hemodynamic disorders are relevant factors leading to CA. 29 The accumulation of misfolded and abnormally aggregated proteins, such as amyloid, leads to mitochondrial dysfunction and oxidative stress. 30 Furthermore, hemodialysis patients show increased brain iron deposition, which is a potential mechanism for the development of CA.31–33 Excess iron leads to the production of hydroxyl radicals that triggers oxidative stress and CA. 34 Adequate dialysis allows for effective removal of toxins from circulation and promotes homeostasis. The National Cooperative Dialysis Study introduced the concept of Kt/V as a measure of hemodialysis adequacy.35,36 We were able to demonstrate that Kt/V is an important protective factor against the development of severe CA.
Anemia as a CA risk factor
Inadequate blood flow and oxygen supply are important mechanisms for the development of CA. In uremic patients, hypoxemia due to anemia, latent or overt cardiac insufficiency, low blood viscosity due to reduced erythrocyte hematocrit, and reduced autonomic nervous system reactivity are factors contributing to reduced cerebral blood flow and oxygen supply, causing morphological changes in the brain. 13 Kamata et al. 15 found a negative correlation between hematocrit and CA and concluded that anemia was a main factor for CA in hemodialysis patients under 60 years of age. Savazzi et al. 13 also suggested that anemia is related to CA in hemodialysis patients, and our findings are consistent with these assumptions. Moreover, anemia is associated with cognitive dysfunction in uremic patients and the correction of anemia by erythropoietin can improve cognitive function in these patients.37–39 However, our retrospective study lacked information on cognitive function, so the correlation between the influencing factors and cognitive function could not be analyzed. A prospective design of future studies, also thoroughly assessing cognitive function, is therefore imperative.
Optimization of the nomogram
Prediction models can provide early information about the progression of CA and help focusing clinical attention on important factors determining CA. Inadequate toxin removal and oxygen supply are the main CA mechanisms, therefore, adequate dialysis and correction of anemia are important targets for future clinical treatment. However, the nomogram based on these two predictors did not have sufficiently high specificity and sensitivity. Adding predictors can increase the specificity and sensitivity and worked favorably in our case, but in general also increases the complexity of the nomogram and thus reduces its practical application. Therefore, predictors cannot be increased indefinitely. It is necessary to balance specificity, sensitivity, and practicability according to the clinical need.
Limitations
This study has several limitations. First, it is retrospective and mono-centric and thus selection bias may exist. However, the factors screened are clearly relevant to CA development and are pathobiologically plausible. Moreover, the clear outcome might be partially related to low data hetergeneity in a single center study design. Second, the diagnostic criterion for CA in this study was based on morphological brain changes being indicative for CA. However, the correlation between cognitive function and dialysis adequacy/anemia in dialysis patients was not analyzed because of lacking comprehensive assessment of neurological functions in the retrospectively included patients. A detailed investigation on the relationship between dialysis parameters and cognition is critical in follow-up studies to provide more information on higher cortical function. Third, magnetic resonance (MR) imaging was not used for CA assessment because it was rarely used for hemodialysis patients in our study. To compensate this defect, we used a reletively large cohort, repeated measurements, and multiple assessment parameters on CT images. The parameters assessed showed good consistency, thus reflect reliable measurements concerning the brain volumes. But MR scans may have provided even more insights, their use must also be considered in future studies. Finally, we performed the external validation for the nomogram within the validation group in this study, which, however, should ideally be formed with a new cohort of patients. Taken together, a prospective study specifically designed to confirm the results obtain in this study, and including comprehesive neurological assessment and neuroimaging modalities is warranted.
Conclusions
CA is mainly manifested as atrophy in the frontal and temporal lobes in hemodialysis patients. Kt/V and hemoglobin are negatively correlated with CA degree. Dialysis adequacy is an independent protective factor, and anemia is an independent risk factor for severe CA. The nomogram established in this study has value in predicting the risk of developing severe CA.
Supplemental Material
sj-pdf-1-jcb-10.1177_0271678X231151621 - Supplemental material for Dialysis adequacy and hemoglobin levels predict cerebral atrophy in maintenance-hemodialysis patients
Supplemental material, sj-pdf-1-jcb-10.1177_0271678X231151621 for Dialysis adequacy and hemoglobin levels predict cerebral atrophy in maintenance-hemodialysis patients by Ming-Xuan Cao, Jia Xiao, Hua-Min Qin, Zhi-Hong Wang, Johannes Boltze, , Shu-Xin Liu, Shen Li in Journal of Cerebral Blood Flow & Metabolism
Footnotes
Funding
The author(s) disclosed receipt of the following financial support for the research, authorship, and/or publication of this article: This work was supported by National Natural Science Foundation of China [82171319]; Central Committee Healthcare Project [2020YB64].
Declaration of conflicting interests
The author(s) declared no potential conflicts of interest with respect to the research, authorship, and/or publication of this article.
Authors’ contributions
Ming-Xuan Cao: Data collection and analysis, and manuscript writing. Jia Xiao: Data collection. Hua-Min Qin: Data analysis, and critical revision for the intellectual content. Zhi-Hong Wang: Data analysis, and critical revision for the intellectual content. Johannes Boltze: Data analysis, manuscript writing, and critical revision for the intellectual content. Shu-Xin Liu: Study design, data analysis, and critical revision for the intellectual content. Shen Li: Study design, data analysis, manuscript writing, and critical revision for the intellectual content.
Supplemental material
Supplemental material for this article is available online.
References
Supplementary Material
Please find the following supplemental material available below.
For Open Access articles published under a Creative Commons License, all supplemental material carries the same license as the article it is associated with.
For non-Open Access articles published, all supplemental material carries a non-exclusive license, and permission requests for re-use of supplemental material or any part of supplemental material shall be sent directly to the copyright owner as specified in the copyright notice associated with the article.