
Abstract
Body dissatisfaction has been related to low self-esteem and depression in adolescents. With regard to the current world wide rise in childhood obesity and common stigmatization of adults and children with obesity, easy to use and cost effective measurements of body dissatisfaction would be helpful in epidemiological research. In the current study, detailed data on body measurements with regard to perceived and ideal body size and body dissatisfaction, as measured with the figure preference task, are presented for a population based sample of 3837 children. Perceived body size correlations to weight, body mass index [BMI], and waist circumference were between 0.41 and 0.54; and to height between 0.12 and 0.21. Odds ratios for lower self-esteem increased with increase in body dissatisfaction. Gender differences in body dissatisfaction were present but not found in relation to self-esteem. It is concluded that the figure preference task yields valuable information in epidemiological studies of children as young as 7.5 years of age. It is argued, that the figure preference task is an additional measurement which theoretically relates to psychological stress in childhood.
Introduction
It has been established that some children are concerned about their body to a degree that they adjust their behavior in order to change their appearance (Smolak, 2004), resulting in unhealthy eating behavior and possible eating disorder. Body dissatisfaction constitutes a risk factor for dieting (Truby and Paxton, 2002), and further eating disturbances (Ricciardelli and McCabe, 2001). In 8 to 10 year old children body dissatisfaction was related to low self-esteem (McCabe and Ricciardelli, 2003). In adolescents body dissatisfaction predicted low self-esteem in girls (boys were not included in that study; Tiggemann, 2005), and depression as well as low self-esteem in both boys and girls (Paxton et al. 2006).
Obesity rates are rising world wide (WHO-Report, 2000), including Sweden (Mårild et al. 2004), and at the same time the media overexposes an often unrealistic body figure as an ideal while people with obesity are ridiculed (e.g. Fouts and Burggraf, 1999; Greenberg et al. 2003; Klein and Shiffman, 2005). Children learn from their families and peers (Dohnt and Tiggemann, 2005; Phares et al. 2004) and the media (Ricciardelli and McCabe, 2001) that one should strive to be thin. Children as young as 3 years of age show prejudices against people with overweight (Cramer and Steinwert, 1998) and children as young as 8 years of age have internalized the sociocultural preference for thinness (Shapiro et al. 1997). Even though there is a pressure on children to be thin, more and more children are classified as overweight or obese, resulting in a higher proportion of children who are exposed to that pressure. Hence, a growing number of children may experience psychological stress because they feel they do not adhere to the ideal of society and need to change themselves in order to be more accepted.
In this context the figure preference task (Collins, 1991) may be helpful to study body dissatisfaction in childhood. In this task children choose one out of several silhouettes for what they think resembles their body most and one for what they think resembles what they want their body to look like. The silhouettes varied from a very thin figure to an obese figure. This paper and pencil task is easy to fill in and cost effective to administer to children and may be helpful in large scale epidemiological studies. However, questions have been raised whether the figure preference task is meaningful for children 8 years old or younger (Smolak, 2004). Wood et al. (1996) concluded that the figure preference task is not reliable for young children, whereas Veron-Guidry and Williamson (1996) found reliability and validity for that task in this age group. Collins (1991) reports a correlation to BMI of r = 0.37 for 8 year old children, which Smolak (2004) interpreted as a low validity of the instrument in children 8 years old or younger. On the other hand, Ricciardelli and McCabe (2001) argue in a review that the figure preference task is a meaningful measurement for children's body dissatisfaction. Wood et al. (1996) reported low to moderate correlation between the figure preference task and the body dissatisfaction subscale of the Eating Disorder Inventory for children but Wood et al. (1996) did not find any relation between self-esteem and the figure preference task. On the other hand, Tiggemann and Wilson-Barrett (1998) found a relation between the figure preference task and self-esteem for boys but not for girls 7 to 12 years old, whereas Furnham et al. (2002) found this relation for girls but not for boys 12 to 13 years old. Tiggemann (2005) found this relation for girls, but did not include boys in her study. Hence, the relation between the figure preference task and self-esteem is not clear in 8 year old children. However, McCabe and Ricciardelli (2003) reported relations between body dissatisfaction, as measured with ‘Likert-type’ response scale items regarding dissatisfaction with weight or muscles, and self-esteem in children as young as 8 to 9 years of age.
Boys and girls exhibit body dissatisfaction (Kostanski et al. 2004) but it has been argued that gender differences emerge at the age of 8 to 10 years (Gardner et al. 1997; Thelen et al. 1992). Some boys want to be thinner, but boys more often than girls want to be stronger and more muscular (Kostanski et al. 2004) with a possible risk of later using muscle enhancing diets and steroids (Smolak, 2004). Paxton et al. (2006) found that body dissatisfaction, measured at age 12 with the Body Shape Satisfaction Scale, predicted low self-esteem and depression in early-adolescent girls but not in early-adolescent boys whereas the opposite was true in mid-adolescent, i.e. no relation for girls but a relation for boys.
With a background of different opinions the aim of the current study was to investigate the relation between body dissatisfaction measured with the figure preference task and body measurements, such as weight, height, body mass index, and waist circumference, as well as children's self-esteem, in a large population-based study.
Method
Procedure
The current study was part of the All Babies in Southeast Sweden project (ABIS), which aims to study causes of type 1 diabetes by following a general population cohort of children born between October 1997 and October 1999 from birth to adolescence. During this time 21700 children were born in Southeast Sweden and their parents were asked to participate at birth. At the 8 year follow-up two questionnaires (one for the parents and one for the children) were mailed home to 15546 families who previously had participated in the ABIS study. Parents reported, among other health related factors, on children's age, weight, height, and waist circumference and children answered a questionnaire consisting of the figure preference task (Rand and Resnick, 2000) and an instrument measuring self-esteem in 5 different domains (Ouvinen-Birgerstam, 1985). The instruction to the children suggested that they could ask their parents if they had problems with their questionnaire. Questionnaires from 3959 parents and from 3837 children were returned and no reminders were used.
Participants
Children varied in age and because of the possible age-effect for body dissatisfaction (Smolak, 2004) and self-esteem, children were grouped into 3 age-groups: 7.5 years (88 to 93 months old), 8 years (94 to 99 months old) and 8.5 years old (100 to 105 months old). Children younger (0.3%), older (1.2%), or with missing age information (9.5%) were excluded from analyses. 52.7% of the children were boys, with an even distribution in all age-groups.
Body measurements: weight, height, BMI and waist circumference
Parents reported weight, height, and waist circumference of their children and the children's body mass index (BMI = kg/m2) was calculated. Body measurements of the children (weight, height, BMI, and waist circumference) are shown in Table 1. Children were classified as underweight, normal weight, overweight, and obese depending on their BMI value. As cut-off for underweight the 10th percentile within each age group was used (Boys: 7.5 years: BMI < 14.12; 8 y: 14.35; 8.5 y: 14.65; Girls: 7.5 y: 13.88; 8 y: 14.08; 8.5 y: 14.38), due to the lack of an internationally comparable standard for underweight. However, children were classified as overweight or obese based on age and gender adjusted international standards for overweight and obesity (Cole et al. 2000). Internationally comparable standards for overweight and obesity in childhood were constructed by Cole et al. (2000) based on samples from six different countries (including U.S.A.) by drawing centile curves through BMI = 25 and BMI = 30 at age 18 and using these centiles for defining BMI value cut-offs for overweight and obesity from age 2 to 18 for boys and girls, respectively.
Children's body measurement means and standard deviations (s d) stratified by gender and age.

Body conception: perceived and ideal body size and body dissatisfaction
The figure preference task consisted of a drawing with 9 silhouettes of a girl and 9 silhouettes of a boy (both about 6 to 10 years old) ranging from very thin to obese (based on Collins (1991) and modified by Rand and Resnick (2000)). First children were asked: “What does your body look like? Cross out the one [silhouette] which looks most like you”. Underneath the question was the drawing of the girl and the boy. This item yielded a score for the child's
Children's body conception measurement means and standard deviations (s d) stratified by gender and age.

Self-esteem
Children's
Ethical considerations
Parents received written and oral information and were invited to watch a video film about the ABIS-project before they gave their consent to participate. ABIS was approved by the research ethics committees of the Faculty of Health Sciences at Linköping University, Sweden and of the Medical Faculty at Lund University, Sweden.
Statistics
Univariate ANOVA tests were used to compare body conception between different groups. Correlations were calculated using the Pearson correlation procedure and correlation coefficients were reported. Confidence intervals for Pearson correlation were calculated using the Fisher z-transformation. Frequency of body dissatisfaction in different groups was compared with χ2-tests. Linear regression analyses of relations between independent variables and self-esteem showed that error terms were not normally distributed (data not shown) and hence, the relations were modeled by a generalized linear model (GLiM) with a binomial distribution. Since modeling of the binomial distribution with a fixed scale parameter of 1 yielded models with an uncertain validity the deviance method to compute the scale parameter was used. In order to compare the risk of low self-esteem in different groups logit was chosen as the link function in GLiM. These GLiM analyses answered the question if the likelihood of a negative answer regarding self-esteem varies with the independent variable, in the current study: weight group classification and body dissatisfaction scores. Thus, an odds ratio of 2 indicates that the expected number of negative answers is twice as high compared to the reference group. As level of statistical significance α = 0.05 was used. Due to internal attrition, the number of subjects in separate analyses varied depending on the variables included. SPSS 15.0 for Windows, Release 15.0.0 (6 September 2006) was used for statistical analyses.
Results
Body measurements
Boys were both heavier and taller than girls and means of weight and height were higher for older children compared to younger ones [for weight: 2 factorial ANOVA-test: F(5; 3039) = 27.35, p < 0.001; for factor gender: F(1; 3039) = 6.19, p = 0.01; for factor age: F(2; 3039) = 61.11, p < 0.001; interaction gender and age: F(2; 3039) = 0.42, p = 0.66; for height: 2 factorial ANOVA-test: F(5; 3057) = 54.69, p < 0.001; for factor gender: F(1; 3057) = 29.67, p < 0.001; for factor age: F(2; 3057) = 115.67, p < 0.001; interaction gender and age: F(2; 3057) = 2.64, p = 0.07]. BMI and waist circumference were higher for older children but did not differ between boys and girls [for BMI: 2 factorial ANOVA-test: F(5; 2960) = 4.09, p < 0.01; for factor gender: F(1; 2960) < 0.01, p = 0.98; for factor age: F(2; 2960) = 8.83, p < 0.001; interaction gender and age: F(2; 2960) = 0.88, p = 0.42; for waist circumference: 2 factorial ANOVA-test: F(5; 2708) = 12.45, p < 0.001; for factor gender: F(1; 2708) = 0.28, p = 0.60; for factor age: F(2; 2708) = 29.05, p < 0.001; interaction gender and age: F(2; 2708) = 0.73, p = 0.48]. No interaction effects were observed between gender and age when predicting body measurements.
Body conception
Perceived body size differed by gender but not by age. Girls perceived their body size as bigger than boys did [2 factorial ANOVA-test: F(5; 3384) = 2.52, p = 0.03; for factor gender: F(1; 3384) = 8.31, p < 0.01; for factor age: F(2; 3384) = 1.88, p = 0.15; interaction gender and age: F(2; 3384) = 2.33, p = 0.10]. Ideal body size did neither differ by gender nor age [2 factorial ANOVA-test: F(5; 3369) = 1.15, p = 0.33]. Body dissatisfaction differed by gender but not by age. Girls were less satisfied with their body [2 factorial ANOVA-test: F(5; 3362) = 3.13, p < 0.01; for factor gender: F(1; 3362) = 12.49, p < 0.001; for factor age: F(2; 3362) = 0.69, p = 0.50; interaction gender and age: F(2; 3384) = 0.78, p = 0.46].
Body measurements and body conception
Table 3 shows the correlation and 95% confidence interval between body measurements and body conception. Moderate correlations were found between perceived body size and weight, BMI and waist circumference, and low correlation between perceived body size and height. As the confidence intervals indicate correlations did not change between age groups. The only difference concerning gender was found for the correlation between ideal body size and waist circumference for 8 year old children, and this correlation was significantly higher for girls.
Correlations (r) and 95% confidence intervals (CI) between body measurements and body conception measurements stratified by gender and age.
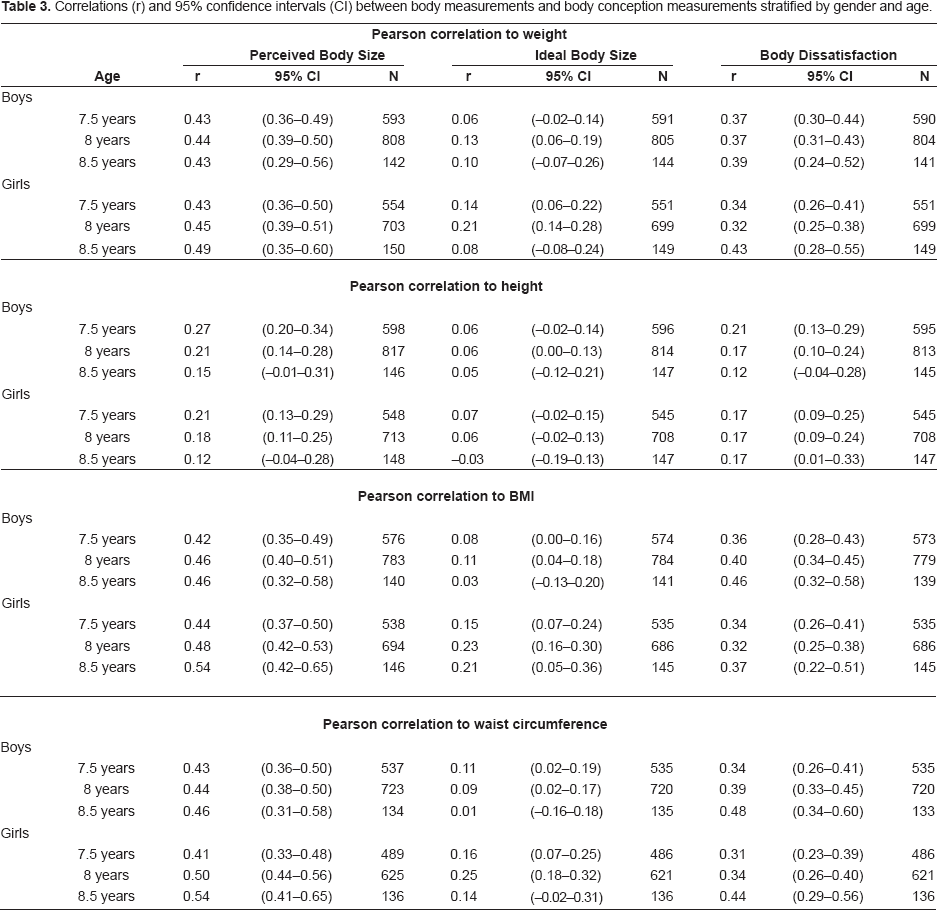
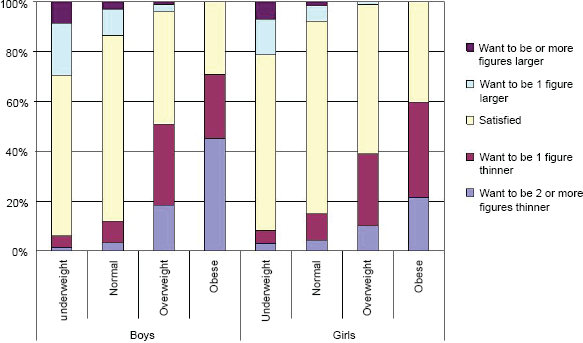
Table 4 and Figure 1 show the proportions of body dissatisfaction for each weight group stratified by gender. Frequency of body dissatisfaction did not differ by age (χ2(8) = 8.18; p = 0.42), but by gender (χ2(4) = 29.12; p < 0.001) with a higher proportion of boys who wanted to be larger. Frequency of body dissatisfaction changed by weight group with a higher proportion of underweight children wanting to be larger. Furthermore, a higher proportion of children classified as overweight or obese wanted to be thinner compared to underweight and normal weight children. No child classified as obese wanted to be larger.
Frequency of body dissatisfaction per weight group and gender.
Proportion of children who want to be thinner, are satisfied or want to be larger, by gender and weight group in percent.

Children's self-esteem
3446 children answered all 32 items. 24.3% (n = 837) of these children answered all 32 items in a positive way. A further 24.2% (n = 833) answered one item in a negative way. The mode was 0 items answered negatively, while the median was 2 items answered negatively and the mean was 2.34 items answered negatively. Children's self-esteem was not related to age but to gender (data not shown). Girls had in general better self-esteem than boys in all domains, except for physical characteristics which did not differ significantly between boys and girls. Furthermore, children's self-esteem was not related to BMI values (data not shown), but showed significant differences when compared between weight groups. Table 5 shows the relation between weight groups and each domain of self-esteem stratified by gender, indicating that girls classified as obese had the lowest self-esteem of all groups. Self-esteem did not differ between the other weight groups except for girls classified as underweight who had significantly lower self-esteem for physical appearance and skills and talents compared to girls classified as normal weight.
Generalized linear models predicting odds ratios (OR), 95% confidence intervals (CI) and significance (p) for self-esteem in five domains and as a sumscore for each weight group stratified by gender.

The higher the mean the lower the self-esteem and 0 represents the highest self-esteem on this scale.
Body dissatisfaction and children's self-esteem
Table 6 shows the relation between body dissatisfaction and lower self-esteem adjusted for weight group classifications, showing the strongest negative relation between body dissatisfaction and self-esteem in the physical appearance domain. However, body dissatisfaction was also negatively related to all other domains of self-esteem for both boys and girls.
Generalized linear models predicting odds ratios (OR), 95% confidence intervals (CI) and significance (p) for self-esteem in five domains and as a sumscore for each score of body dissatisfaction stratified by gender.

All models adjusted for weight group.
The higher the mean the lower the self-esteem and 0 represents the highest self-esteem on this scale.
This model is not reliable, due to insufficient times of iteration in the computing process.
Discussion
Cross-sectional comparison of children aged 7.5, 8, and 8.5 years showed increased weight, height, BMI and waist circumference with age, as was expected. Perceived body size, ideal body size, and body dissatisfaction, on the other hand did not differ between these age groups. The correlations between weight and perceived body size did not change significantly between the age groups, even though the correlations increased for girls when comparing the age groups. The low correlations between height and perceived body size, decreased even further in older age groups, which indicated that children did not use height but rather weight, BMI or waist circumference for choosing the figure which best resembled their body size.
The current study found that 71% of the children were satisfied with their body size. Children with normal weight showed the highest proportion, whereas children with obesity showed the lowest proportion of satisfaction. In general, children indicated a tendency towards the norm, i.e. children with overweight or obesity wanted to be thinner, whereas children with underweight wanted to be larger. Nevertheless some children (more girls than boys) wanted to be much thinner than their perceived body size. For children with under- or normal weight, this may be a risk factor for disturbed eating behaviors (e.g. excessive dieting). When children with obesity want to be much thinner it could indicate a high motivation for reaching normal weight. On the other hand this could just as well be a cause for concern, as it is not clear whether they use healthy means to loose weight. In order to identify groups of children who want to change their body size and analyze the means these groups use, the figure preference task is a possible screening instrument in large populations.
The relation between body dissatisfaction, as measured with the figure preference task, and low self-esteem has earlier been shown in older children (Furnham et al. 2002; Tiggemann, 2005) but was contradictory in 8 year old children (Wood et al. 1996; Tiggemann and Wilson-Barrett, 1998). However, in the current study lower self-esteem was related to body dissatisfaction for both boys and girls. Even when children wanted to be just one figure different self-esteem was lower compared to children who were satisfied. Therefore even a small difference between perceived and ideal body size can be meaningful from an epidemiological point of view. The more dissatisfied children were with their body size the lower their self-esteem, further indicating that differences in choosing a figure were not arbitrary, but their particular choice of figure reflect some psychologically relevant phenomena.
It is interesting to note that lower self-esteem in all domains studied was more strongly related to body dissatisfaction, than to BMI values or to weight group classifications. This indicates that body dissatisfaction is a more interesting measure regarding children's psychological well-being than objective body measures, such as BMI. Girls with obesity had the lowest self-esteem, even though a higher proportion of these girls were satisfied with their body compared to boys with obesity. This suggests that girls with obesity did not account for the relation found between lower self-esteem and the desire to be thinner.
Methodological considerations
As mentioned above 71% of children were satisfied with their body. This is a higher proportion than observed in other studies (Collins, 1991, Ricciardelli and McCabe, 2001). Furthermore, scores in the current study indicated higher self-esteem for children on average than found in other studies using the same measurement (e.g. Ouvinen-Birgerstam, 1985). Attrition and that children filled out the questionnaire at home may account for the high proportion of children satisfied with their body and children with higher self-esteem but we contend that this does not explain the relation found between body dissatisfaction and low self-esteem. Attrition would explain this relation if children who were dissatisfied with their body and had high self-esteem or alternatively who were satisfied with their body and had low self-esteem. This is not more likely than that children who were dissatisfied with their body and had low self-esteem dropped out and therefore, attrition is unlikely to be the reason for the relation found between body dissatisfaction and self-esteem did not participate. As children filled out the questionnaire at home it may be that children felt more confident at home than in school settings, where most other studies which used the ‘I think I am’ instrument were conducted. Instructions to the children suggested that if they need help with the questionnaires they could ask their parents. It was not measured how many children asked for help or what kind of help children received. However, if parents influence their children's answer it may be reasonable to assume that the result was higher self-esteem and/or lower body dissatisfaction of the children. This would explain the higher proportion of children who were satisfied and had higher self-esteem but would be less likely to explain the relation found between body dissatisfaction and lower self-esteem. However, some studies (Field et al. 2001; Ricciardelli and McCabe, 2001; Dohnt and Tiggemann, 2005; Phares et al. 2004) suggest that parents may contribute to children's internalization of the thin ideal. This suggests that parents could influence children to choose a thinner ideal body size. It may be argued that children did not understand the difference between what they looked like and what they wanted to look like, but the difference in self-esteem suggested that children were more confident when choosing the same figure for both the perceived and the ideal body size. If it was a problem in understanding the questions this difference in self-esteem is difficult to account for.
Truby and Paxton (2002) used real life images instead of figure drawings for assessing perceived and ideal body size and argued that children may find it easier to identify with real life images when choosing their perceived body size. In a small sample they found a slightly higher correlation between girls’ BMI and their perceived body size (age 7–8: r = 0.52; age 8–10: 0.50) compared to the current study. For younger boys Trudy and Paxton (2002) did not find a significant correlation (age 7–8: r = −0.08) and for slightly older boys (age 8–10: r = 0.34) the correlation was lower than in the current study. Difference in sample size may account for the differences in correlations.
The advantage of real life images is that the BMI value for each image is known and can be compared to the BMI values of the participating children, yielding a measure for body image distortion. Figure drawings do not allow for such a comparison, since experts’ attempts to establish a BMI value or range for each silhouette were not conclusive (Must et al. 2002). Methods have been developed using participants’ own images to assess their perceived body size, body dissatisfaction and body image distortion (e.g. Gardner et al. 1997; Gardner and Boice, 2004). Using this method Gardner et al. (1997, Gardner et al. 1999) showed that children were very accurate in estimating their own body size, even though on average a slight overestimation was found. Until that method is easy to use in large scale epidemiological studies the paper and pencil version of the figure preference task is a possible alternative, as the current study suggests.
Relevance
Measuring psychological stress in children is difficult. In epidemiological studies parents’ experience of stress are often used as a proxy for children's psychological stress and adverse effects have been found for children's health (e.g. Koch et al. in press; Sepa et al. 2005). The figure preference task may be used as an inexpensive, but valid measure which can be reported by the children themselves and seems to be related to children's psychological well-being.
When promoting a thin body ideal parental, peer (Dohnt and Tiggemann, 2005; Phares et al. 2004) and media (Ricciardelli and McCabe, 2001) influence suggest to the child that he/she is not good enough as he/she is, and the child has to develop strategies to deal with his/her perceived shortcomings. In particular for girls, where teasing has been found to relate to body dissatisfaction and eating disturbances (Fabian and Thompson, 1989) this may be important. Furthermore, girls may be frightened by gendered harassment (an early form of sexual harassment (Murnen and Smolak, 2000)) and may change their behavior (e.g. start dieting) to avoid this.
Conclusion
The figure preference task can be used as a measure of perceived and ideal body size with children at least as young as 7.5 years and yield epidemiological meaningful data. Relation between body dissatisfaction and self-esteem suggest that the figure preference task is an additional measurement which theoretically can be related to psychological stress in childhood. As psychological stress in children is difficult to measure and parents’ report is only a proxy for children's experienced stress, body dissatisfaction may be one way to capture aspects of psychological stress not only experienced but also reported by the child itself. Therefore, body dissatisfaction may not only be related to problematic dieting behavior, but also other medical conditions, which could be studied in epidemiological studies.
Disclosure
The study, as part of ABIS, was generously supported by the Swedish Council of Working Life and Social Research (FAS2004-1775), JDRF-Wallenberg Foundation (K 98-99D-12813-01A), the Swedish Research Council (K2005-72X-11242-11A and K2008-69X-20826-01-4), the Swedish Child Diabetes Foundation (Barndiabetesfonden), the Swedish Diabetes Association, the Novo Nordisk Foundation, and Center of strategic research for Prevention of Diabetes and its complication, Linköping, Sweden. None of the authors has any conflict of interest to disclose and the authors thank the children and their families for participation in ABIS.