
Abstract
Here we describe a female patient who developed acute promyelocytic leukemia (APL) characterized by t(l5;17) translocation at diagnosis. The patient began treatment with all-trans retinoic acid (ATRA) + chemotherapy. During follow up, the patient was found to be negative for the t(15;17) transcript after 3 months of therapy which remained undetectable, thereafter. However, the emergence of a small clone with a t(8;21) abnormality was observed in the bone marrow and peripheral blood (PB) cells between 3 and 18 months following treatment initiation. The abnormal translocation observed in PB cells obtained at 3 months was detected after the second cycle of consolidation therapy and reappeared at 15 months during maintenance treatment, a period without ATRA. Although based on a single case, we conclude that genetic screening of multiple translocations in AML patients should be requested to allow early identification of other emerging clones during therapy that may manifest clinically following treatment.
Introduction
Acute myeloid leukemia (AML) is the most common form of adult leukemia, and account for approximately 10,000 newly diagnosed cases per year. 1 Previous studies have identified a group of chromosomal translocations in myeloid cells that create an oncogenic fusion gene that is associated with the various subtypes of AML (M1 through M6) according to the current French-American-British (FAB) classification system. These chromosomal translocations underlie the phenotypic variability observed in AML subtypes. 2 The WHO classification divides AML into the following 4 major categories; 1) AML with recurring genetic abnormalities; 2) AML with multilineage dysplasia; 3) therapy-related and myelodysplastic syndromes AML; and 4) AML not otherwise specified. The first category consists of the following subcategories: a) AML t(8;21)(q22;q22), (RUNX1/RUNXT1); b) AML with abnormal bone marrow eosinophils and inv(16)(p13q22) or t(16;16) (p13;q22), (CBFb/MYH11); and c) acute promyelocyte leukemia (APL) with t(15;17)(q22;q12), (PML/RARA) and variants; and d) AML with 11q23IMLL abnormalities. The 3 most common reciprocal translocations include the chimeric genes PML/RARA resulting from t(15;17), which specifically characterizes 100% of FAB M3 AML cases; the fusion transcript RUNX1/RUNXT1 resulting from t(8;21) detected in 20% of FAB M2 AML cases, and CBFb/MYH11 resulting from inv(16)/t(16;16) found in at least 70% of M4 AML with eosinophilia.3–7 Advances in understanding cytogenetic and molecular pathogenesis of AML have allowed researchers to design more sophisticated therapeutic protocols. For example, the advent of all-trans-retinoic acid (ATRA) therapy in conjunction with cytotoxic agents, such as cytarabine or idarubicin, increases the killing of clonogenic cells and significantly improve AML prognosis.8–14 Several AML studies have evaluated the prognostic impact of these translocations and found that rearrangement t(15:17), which characterizes the APL form of acute myeloid leukemia, as well as t(8;21) and inv(16)/t(16; 16), is associated with a favorable outcome compared to other AML rearrangements. Thus, molecular identification of these rearrangements is of clinical importance.
Although treatment with ATRA alone is neither able to eradicate the leukemic clone nor completely cure APL, it can induce complete morphological remission in 80%-90% of APL patients and reduce the mortality rate from 85% to less than 10%. 15 Despite the impressive complete remission rates obtained with ATRA as a single agent, a shortcoming of this therapy is the risk of overproduction of white cells and the rapid development of drug resistance.
The emergence of clonal chromosome changes unrelated to the initial abnormal APL clone during combined therapy is a rare event, and only a few cases have been reported in the literature. Here, we present a female APL patient positive for t(15:17) who achieved complete remission through the disappearance of the t(15;17) PML-RARA transcript following ATRA treatment in combination with chemotherapy. However, a novel t(8;21) rearrangement was detected in this patient's PB cells after initiation of consolidation therapy. Diagnosis of APL-AML in this patient was based on karyotyping, immunophenotyping, and molecular studies of both PB and bone marrow cells.
Case Report
In April 2008, a 21-year-old female was admitted to our institute with a 15 day history of spontaneous bruising of the extremities and one day of hypermenorrhea. General physical examination was unremarkable except for slightly pale yellow skin. An evaluation of isolated PB cells allowed for the assessment of hemoglobin levels (9.0 g/dL) and a, WBC count (22.7 × 10⁷L with 82% blast cells, 0% promyelocytes, 5.7% neutrophils, 10.1% lymphocytes). Besides elevated lactate dehydrogenase levels (760 IU/L), all biochemical parameters were within normal limits. In the coagulation screening test, the thrombin time (TT), prothrombin time (PT), and international normalized ratio (INR) were prolonged (TT: 27.7 sec—range 16 to 22; PT: 47%, INR: 1.6) although the activated partial thromboplastin time was within normal limits. The patient had a platelet count of 28 × 107L and, as a result, was transfused with lunit of apheresis platelets and 6 units of fresh-frozen plasma resulting in an increase in platelets. A bone marrow sample collected at the time of admission was markedly hypercellular with 62.8% blasts and 31.6% atypical promyelocytes. Cytochemical staining demonstrated that all blast cells were intensely positive for myeloperoxidase and Sudan Black B, but negative for nonspecific esterase. Immunophenotyping of bone marrow blast cells by flow cytometry revealed the following myeloid markers on infiltrating cells: CD45+, CD34+/–, HLA-DR+, CD13++, CD33++, CD64+/” with partial co-expression of the T cell-associated antigen CD2 and CD56 negative.
Chromosomal Analysis
Chromosomal studies were performed on short term unstimulated cultures of bone marrow cells using the G banding conventional technique. The karyotype was performed as described according to ISCN 2005. 16 At least 24 metaphase cells were fully karyotyped and interpreted as 46,XX,t(15;17)(q22;q21) [8]/46,XX[16] 17 (Fig. 1).

Conventional karyotyping. Partial G-banded karyotype showing translocation (15; 17) at diagnosis (marked with arrows).
Molecular Studies
Bone marrow and PB samples were collected at the time of diagnosis, after remission induction, at the end of consolidation, and throughout the maintenance therapy. Total RNA from mononuclear cells was extracted with TRIzol (Invitrogen). The reverse transcription reaction was performed on 1 μg of total RNA using Superscript III, random hexamers and oligo(dT) primers (Invitrogen). As is routine, multiplex real-time PCR was performed at the time of diagnosis to simultaneously detect PML/RARA t(15:17), RUNX1/RUNXT1 t(8;21), and the CBFb/MYH11 inv(16)/t(16;16) fusion gene transcripts. The following three previously published primer pairs were added to the reaction mixture: PML-C2/RARA-D for the PML/RARA t(15;17) fusion transcripts, AML1-C/ETO-D for the RUNX1/RUNXT1 t(8:21) fusion transcripts, and CBFbC/MYH11-D2 for the CBFb/MYH11 inv(16)/t(16;16) fusion transcripts. 18 Amplifications were performed in 25 μl PCR mixture containing 10X Tris (pH 8.3; Invitrogen, Brazil), 2.0 mM MgCl2, 0.2 μM of each primer, 0.2 mM of each dNTPs, SYBR Green (18.75 Units/r × n; Cambrex Bio Science, Rockland, ME) and 1 unit of platinum Taq polymerase (Invitrogen, Brazil). Cycling conditions consisted of one cycle of 95 °C for 3 minutes, followed by 40 cycles of 95 °C for 30 seconds, 60 °C for 30 seconds and 72 °C for 30 seconds. The dsDNA dye SYBR Green detection chemistry with melting curve analysis was assessed on a RotorGene 3000 (Corbett Research, Australia). Following amplification, melting curves were obtained using a ramping rate of 1 °C/30s from 72–95 °C on the SYBR channel. Post-amplification fluorescent melting curves of amplicons were analyzed using RotorGene software V4.6.94 as shown in Figure 2A. Amplification of RUNX1/RUNXT1 t(8;21) fusion transcript sequences was performed using a nested PCR technique and used to support the multiplex real-time PCR results. The first amplification mixture contained the primers AML1-A and ETO-B and the nested PCR used primer sets AML1-C and ETO-D. As depicted in Figure 2B, the outer primers of the nested reaction flanked a 395 bp fragment of the RUNX1/RUNXT11(8;21) fusion transcript. In addition to conventional qualitative analysis, a real-time quantitative PCR (RT qPCR) assay was carried out with the same internal primers used for the nested reaction (AML1-C and ETO-D) in order to allow quantification of the detectable fusion gene-specific products of the M2 transcript. The copy numbers were calculated by comparing the standard curve generated using serial dilutions of linearized plasmids containing the fusion gene-specific insert of each transcript and normalized to the copy number of the single-copy gene ABL amplified in parallel reactions (Fig. 3A). Results were expressed as the ratio of the fusion-site-specific product copy number/ABL copy number x 100%. As assessed by multiplex and quantified by RT qPCR, the t(15;17) fusion transcript was detected in >76% cells from bone marrow aspirates at the time of the initial APL diagnosis.

A) A plot of dF/dT vs. fluorescence shows a characteristic Tm for the control plasmid containing fragments that partially cover PML/RARA t(15:17), which are found in 100% of AML M3 patients; RUNX1/RUNXT11(8;21), which are found in virtually all cases of AML M2; and the CBFb/MYH11 inv(16)/t(16;16) translocations, which are found in 88% of cases of AML M4 who have type A transcript.
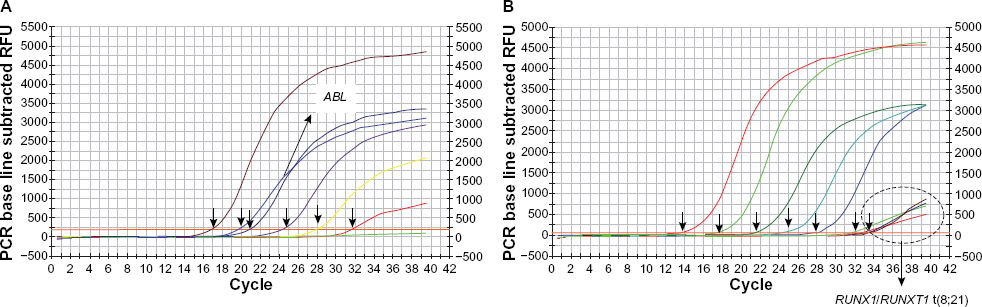
Amplification plots of RUNX1/RUNXT1 t(8;21)-standard curve (copy numbers ranging from 10
5
to 10° copies). The x-axis shows the number of PCR cycles and the y-axis shows the normalized fluorescence intensity. The threshold cycle values are calculated automatically by determining the point at which the fluorescence exceeds a fixed threshold line (indicated by arrows). Amplification plots show results for ABL standard curve (copy numbers ranging from 10
5
to 10° copies) and duplicate reactions on these samples (labeled in white box) are shown
Adequate precautions were taken to avoid DNA contamination using separated locations for extraction of specimen, amplification of DNA, and analyses of PCR products in dedicated laminar air-flow cabinets. Positive controls (PCR positive for each transcript) and negative controls (distilled water) were included in each run.
Treatment Outcome
Based on the karyotype analysis, flow cytometric immunophenotyping of bone marrow cells and RT qPCR, our patient was diagnosed with APL, specifically FAB APL-M3V. In May 2008, our patient was treated immediately with ATRA (45 mg/m2 daily) combined with the standard D3 A7 (daunorubicin (dauno) + cytosine arabinoside (AraC)) induction chemotherapy, which combined dauno (60 mg/m2 x 3 days) with cytarabine (200 mg/m2 x 7 days). The first day of later combination therapy was designated as day 0. On day +2, the patient gained 5 kg, developed hypoxia and crepitant rales in both lungs and febrile neutropenia (FN). A chest X-ray showed interstitial diffuse alveolar infiltrates in the lower two-thirds of each hemithorax and pleural effusion consistent with either early pulmonary edema or acute lung injury. Blood cultures identified a Gram negative organism (Klebsiella pneumoniae). The clinical picture was considered to be compatible with a symptom of ATRA differentiation syndrome. As a result, ATRA treatment was halted and the patient was started on dexamethasone (10 mg IV twice daily) and imipenem. At the same time, the patient received a laryngoscopy orotracheal intubation, which was continued for two days to maintain adequate ventilation and oxygenation. The patient's symptoms improved during the two days of intubation and ATRA was restarted on day +6 without coverage of steroids and was maintained until day +42. A repeat bone marrow aspirate performed in June (day +27) and August 2008 showed that the patient's leukemia was in complete remission and her PB counts were normal. Two more consolidation chemotherapy cycles were administered in June and July 2008 (D3 A7 in both cycles). Episodes of FN were observed during the first consolidation therapy. The patient proceeded to planned maintenance therapy in September 08 and commenced with 6-mercaptopurine (90 mg/m2/day), methotrexate (15 mg/m2/week) and ATRA (45 mg/m2 daily for 15 days every 3 calendar months). To date, the patient continues to receive maintenance therapy.
To assess the molecular response of treatment, RT-qPCR was performed on cells isolated from the PB and bone marrow every 3 months after initiation of therapy. The results of the consecutive analyses are shown in Table 1. During follow up, the patient found to be negative for the t(15;17) fusion transcript after 3 months of therapy which remained undetectable thereafter. However, the emergence of a small clone with a t(8;21) abnormality was observed in cells isolated from the marrow and PB between 3 and 18 months following initiation of treatment (Fig. 3B). Retrospective analysis of the sample collected prior to treatment by a more sensitive nested PCR did not show evidence of t(8;21). At that time, the patient had no cytogenetic or immunophenotypic evidence of M2 disease. Unfortunately, retrospective analysis by FISH could not be carried out because no more diagnostic bone marrow sample was available. The PCR amplicon corresponding to t(8;21) transcript that was detected in August 2008, was sequenced by the dideoxy chain termination method using the ABI 3130 automated sequencing system (Applied Biosystems, Foster City, CA). The sequence was compared to known sequences using the BLAST Human Genome software. The sequencing results confirmed that the cDNA showed a t(8;21) variant rearrangement (Fig. 2C). Identical DNA sequences after multiplex PCR analysis were detected in February 2010 in a small percentage of cells, whereas t(15;17) was never detected in the same PB samples. At the most recent follow-up, t(8;21) was undetectable and the patient was in complete remission.
Sequential quantification of PML/RARA t(15:17), RUNX1/RUNXT1 t(8;21) in PB and/or bone marrow samples at diagnosis and during treatment course.

Bone marrow
Peripheral blood
The same value in BM and PB
daunorubicin (dauno) + cytosine arabinoside (AraC)
6-mercaptopurine
Methotrexate.
Discussion
Here, we describe a case of APL-M3v where complete remission was achieved soon after a completion of a course of ATRAplus chemotherapy. Specifically, the complete disappearance of the t(15;17) rearrangement was observed, although a novel t(8;21) chromosomal aberration emerged. The appearance of the t(8;21) fusion gene during the treatment course of our patients has not been previously detected. The translocation was not detected by PCR at the time of APL diagnosis, but was present in PB and bone marrow cells obtained from 3 to 18 months after starting treatment. It is possible that the proportion of M2 leukemic cells at the time of diagnosis was well below the sensitivity of our nested PCR detection limit and only became significant after initiation of treatment. This response probably results in a selection of rare marrow cells with oncogenic fusions by chemotherapy.19,20 It is known that chemotherapy has a significant effect on marrow cell kinetics leading to their death and forcing many of them to undergo differentiation. However, it cannot be ruled out that the chemotherapy induces this translocation.
The abnormal translocation observed in PB cells obtained at 3 months was detected after the second cycle of consolidation therapy (D3A4) and reappeared at 15 months during maintenance treatment, a period without ATRA therapy. Our present study documents the disappearance of t(8;21) in bone marrow and PB cells collected during scheduled maintenance courses when ATRA was combined with chemotherapy in November 2008 through September 2009. These results suggest that ATRA plays a crucial role in restoring the normal function of the myeloid cell transcriptional process, leading to the terminal differentiation of leukemic cells. This is consistent with intermittent detection of M2 during periods without ATRA therapy. Since ATRA is known to exert growth inhibitory effects in non-M3 leukemic cells through apoptosis, 21 it could serve to induce apoptotic changes in M2 leukemic cells. Evidence from in vitro studies demonstrated antitumoral effects of ATRA characterized by inhibition of growth of cell lines derived from malignancies other than APL, such as ovarian carcinoma, neuroblastoma, and germ cell tumors. 22 In non-APL cells, ATRA's role in AML has been observed in the HL-60 cell line, which lacks PML/RARA and is classified as a variant M2 subtype of AML. 23 Moreover, encouraging results showing efficacy in non-APL AML patients have been reported with the use of ATRA alone or in conjunction with other agents such as conventional chemotherapy13,24–26 or with epidrugs.27–31
Both the suppression of the M3 leukemic clone early in the course of treatment through combined therapy and the increase of the M2 clone during consolidation therapy argue in favor of 2 independently growing aberrant stem cell clones in this patient.
Based on available evidence, additional chromosome rearrangements involving t(8;21) and t(15; 17) are rarely seen in APL patients treated initially with ATRA plus chemotherapy32–35 For example, two independent anecdotal-based studies have reported a coexistence of t(8;21) and t(15;17) chromosomal anomalies in their patients at the time of diagnosis, and they concluded that t(8;21) may have been the first event to originate from an early leukemic clone, while t(15;17) was acquired later in the course of the disease.32,33 In another study, Movafagh et al 36 reported a female patient in which two FAB-specific chromosome aberrations evolved from a single leukemic clone and co-expressed t(15;17) and t(8;21). Recently, Qian et al 25 described 4 cases of AML treated with ATRA alone who were initially misdiagnosed as APL according to the FAB classification. Three of these patients achieved CR, but all of them relapsed early. Contrary to the case reports outlined above, the case described in this report only showed an emergence of t(8;21) in the early course of treatment of APL. Close monitoring of this patient will permit us to answer whether the presence of the RUNX1-RUNX1T1 fusion transcript represents a reservoir for disease development or a more benign, perhaps transient phenomenon.
Conclusion
The multiplex PCR molecular studies played a key role in detecting the emerged translocation in follow up samples in this patient, which would not have been detected using a single PCR assay. This finding supports the concept of genetic screening of multiple translocations in AML patients, not only for monitoring treatment outcome, but also for early identification of emerging additional clones during therapy that may manifest clinically after the course of treatment.
Authors’ Contributions
WKN performed molecular analysis and was involved in manuscript preparation; MS responsible for patient care and acquisition of data; SS was responsible of the scientific revision, discussion and editing of the manuscript; PTB collected the data and preparation of samples; EDRPV performed cytogenetic analysis; PED was supervisor of patient care and interpretation of data. IB advised and reviewed the manuscript.
Disclosures
This manuscript has been read and approved by all authors. This paper is unique and not under consideration by any other publication and has not been published elsewhere. The authors and peer reviewers report no conflicts of interest. The authors confirm that they have permission to reproduce any copyrighted material. Written consent was obtained from the patient or relative for publication of this study.