
Abstract
Background
In patients with end stage renal disease (ESRD) on regular haemodialysis (HD), fluid status in the body has an important impact on the left ventricular (LV) filling and it can lead to intra-dialysis hypotension.
The aim of the study is to study the pattern of diastolic pulsed Doppler filling in patients who had hypotension during HD and to correlate that with the net fluid loss at end of dialysis session.
Material
Fifty two patients with (ESRD) on regular HD, 34 male, with mean age of 45.5 ± 13 year were studied. Each patient had pulsed Doppler study before and immediately after HD.
Each patient was observed for the development of acute clinical events and hypotension defined as systolic blood pressure of less than 90 mmHg.
Patients were divided into two groups according to the amount of net ultra filtrate loss after HD, group I (n = 25) with fluid loss of <2 litres, and group II (n = 27) with ≥2 litres.
Results
The mean age was 45 ± 12 year for group I and 46 ± 11 year for group II.
In the study group, 11 out of 52 (21%) patients developed systolic hypotension less than 90 mmHg during HD compared to those without, no patient necessitate HD discontinuation.
The mean pre dialysis pulsed Doppler Early filling to late filling wave (E/A ratio) of those who developed hypotension was (0.7 ± 0.2 vs. 1.1 ± 0.2.1, p < 0.001) and the mean of Deceleration time of E wave (DT) (246 ± 40 vs. 224 ± 34 m.sec, p < 0.05) respectively.
The mean difference between pre and post HD pulsed Doppler indices in group II compared with group I were as follow: the mean reduction of E wave velocity (32 ± 17 vs. 12 ± 15 m.sec, p < 0.01), the mean reduction of A wave velocity (13 ± 17 vs. 11 ± 16 m.sec, p = NS), E/A ratio reduced to 0.14 ± 0.03 vs. 0.01 ± 0.04, p < 0.05), the mean DT of E wave increase from (43 ± 51 vs. 16 ± 64 m.sec, p < 0.05).
Conclusion
In patient ESRD on regular hemodialysis, the prolonged DT >246 m.sec of E wave and E/A ratio less than 0.7 both may be used as a predictors of asymptomatic hypotension during HD.
The net fluid loss during HD is directly proportional to the reduction of left ventricle Doppler diastolic indices.
Introduction
In patients with end stage renal disease (ESRD) on regular haemodialysis (HD), the maintenance of fluid status is optimally critical to avoid circulatory complications. 1
Chronic volume overload may contribute to the increase of overall cardiovascular mortality, where volume under load may lead to symptoms of volume depletion. Thus, the dialysis prescription attempts to bring patients into optimal fluid status.1,2
One of the common clinical manifestations of haemodynamic instability during HD is hypotension. The incidence of a symptomatic reduction in blood pressure during HD is in the range of 15%-50%. This problem contributes to excessive morbidity associated with the procedure. 3
The pulsed wave Doppler echocardiography plays an important role in the evaluation of the diastolic filling pattern of the left ventricle (LV) where various types of filling pattern have been described in various disease states such as hypertension that is associated with abnormal relaxation pattern (Type I), and dilated myopathy that is associated with restrictive filling pattern (Type IV).4,5
Various parameters of pulsed Doppler indices have been used for the evaluation of diastolic function in patients with end stage renal disease (ESRD) such as transmitral diastolic filling velocities that reflect the left atrium (LA) filling dynamics in subject with various cardiac diseases. 5
The quantitative effect of the net fluid loss or (preload reduction) on the LV Doppler velocities in systole and diastole, in relation to systolic blood pressure during haemodialysis in patient with end stage renal disease have not been investigated quantitatively earlier. The dry weight used to be the most popular indicator of fluid management in patient on regular haemodialysis. 6
The aim of the study is: Firstly, to examine the effect of net volume ultra-filtrate loss (measured by haemodialysis machine) during HD on pulsed Doppler indices of LV and aortic valve.
Secondly: to validate the best derived Doppler parameter to predict those patients who may have a tendency for hypotension during haemodialysis.
Material and Methods
Study Population
Study population consisted of 52 patients (34 male with mean age of 45.5 ± 13 years (range 18-72)). Group I (n = 25) with net fluid loss of less than 2 litres and group II (n = 27) with net fluid loss ≥2 litres.
Inclusion Criteria
Patients were included in the study if they had end stage renal disease on regular haemodialysis for more than six months and had normal left ventricle function on echocardiogram (LVEF > 50%), with no clinical evidence of coronary artery disease and normal twelve leads electrocardiogram.
Exclusion Criteria
Patients were excluded from the study if they were not willing to participate or if they had severe mitral or aortic valve disease.
If they have left ventricular dysfunction with LV ejection fraction of less the 50% or if they were known to have coronary artery disease.
A consent form was signed by each patient before enrolment in the study.
The study protocol was approved by the institutional committee in the hospital.
The aetiologies responsible for the ESRD in the study population were as follows: diabetic nephropathy in 12 patients, chronic glomerulo nephritis in 10 patients, 10 patients with interstitial nephritis, two with chronic urate nephropathy, five with lupus erythematosis, two with polycystic kidney and idiopathic in 11 patients.
Patient's medications
The medication of each patient was recorded. All patients were on one alpha tablet of 0.25 ug and calcium carbonate tablet. 32 patients were on beta blockers, 38 patients were on calcium blockers, 14 were on statin tablet and four patients on alpha blockers, 18 patients were on oral hypoglycaemic drugs and four were insulin dependent.
The Study Protocol
The study was performed in the Renal Dialysis Unit of King Fahad Military Hospital in Dharan, Saudi Arabia, and salmanyia medical complex in Bahrain over twelve month's duration.
Patients were entered consecutively into the study, 52 patients out of 64 were included and 12 patients were excluded, four had significant mitral or aortic valve disease, seven had coronary artery disease and or left ventricle dysfunction on echo and one was not willing to participate.
Before entry into the study each patient had a clinical history and examination of the cardiovascular system, respiratory system, with record of12 leads ECG, the heart rate, and blood pressure. The body mass index was calculated according to the weight and height of each patient.
All patients were not allowed to take any medications up to six hours before the dialysis in order to eliminate the medication effect on the study outcomes.
The history of diabetes mellitus and hypertension (BP) or hyperlipidemia and current medications were all recorded.
Blood sample were taken for the level of fasting sugar, lipid profile including total cholesterol, low density lipoprotein (LDL), high density lipoprotein (HDL), triglyceride (TG), haemoglobin level (HB). Patients were regarded hyperlipidemic if the total choestrol is more than 240 mg/dl (4.91 mmol/l) or LDL level is more than 160 mg/dl (4.1 mmol/l). 7
Echocardigram
Pulsed Doppler echocardiogram was performed using the Hewlett Parker Echo System (mode 5500) incorporating a 2.0-2.5 MHZ phase array transducer. The M mode measurement was of the LV cavity and wall thickness, left atrial diameter, and LV Ejection fraction (EF%). Echocardiographic measurement was carried out according to the recommendation of the American Society of Echocardiography. 7
Pulsed Doppler measurement of the LV diastolic filling in apical four chamber view includes: E wave of early filling of mitral valve in ms, A wave of the Atrial contraction in ms, the E/A ratio, Isovolumic relaxation time in m.sec, deceleration time of the E wave in m.sec (DT), the aortic valve time velocity integral (TVI) in cm is the calculated. The diameter of inferior vena cava (VCD) in mm on sub-costal view was obtained at end of expiration.6 The readings were taken as a mean of five consecutive cycles. All the 2-D echo and pulsed Doppler results were calculated by a second operator, who was blinded of the clinical status of the patient.
During HD the duration of dialysis in hours was recorded. Each patient was examined for heart rate, blood pressure, and monitored for cardiac events such as hypotension (defined as reduction of systole <90 mmHg, arrhythmia or chest pain). During HD, BP and heart rate were recorded automatically every 15 minutes. Immediately after haemodialysis session, the heart rate, blood pressure and the net volume loss of ultrafiltate in ml as measured by the machine was recorded. A second post dialysis pulsed echo Doppler echocardiogram was performed immediately after dialysis, the measured M mode and 2-D values and pulsed Doppler data were tabulated. The study group (n = 52) were divided according to the net volume fluid loss at the end of dialysis session.
The clinical data and the echo Doppler data were all tabulated and analysed for each patient included in the study.
Statistical Analysis
All numerical values were expressed as mean ± standard deviation. The two tailed paired student test used for comparison of pre and post dialysis within the same group.
Chi-square analysis was applied for qualitative data of clinical outcomes. The probability value (P) less than 0.05 was considered significant.
Results
52 patients with end stage renal disease on regular dialysis were entered in the study.
Table 1 discloses the clinical characteristic of the whole study group (n = 52), the two subgroups I (n = 25) and group II (n = 27). In group I, the patients ages were 45 ± 12 year and 46 ± 11 year for group II. The prevalence of hypertension, diabetes mellitus and hyperlipidemia were matching in both groups with no statistical difference.
The clinical characteristics of the study group and the two sub-groups.
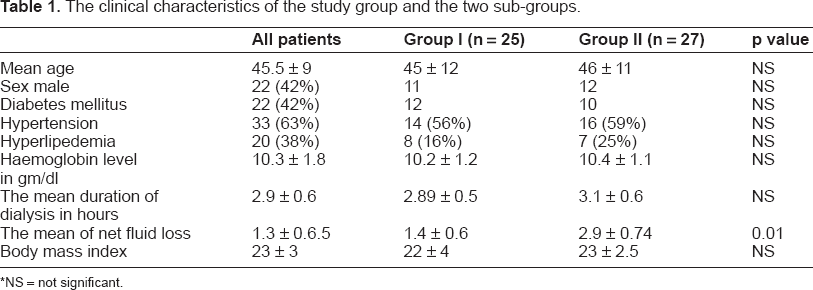
NS = not significant.
The mean haemoglobin level was 10.2 ± 1.2 gm/dl for group I and 10.4 ± 1.1 gm/dl for group II. The mean duration of the dialysis session was 2.89 ± 0.5 hours for group I and 3.1 ± 0.6 for group II, with no significant differences in both groups. The diameter of inferior vena cava that reflects the hydration status of a patient before dialysis was similar in both groups.
Table 2 discloses the haemodynamic data of heart rate and blood pressure of both groups. The systolic blood pressure (SBP) decreased from 137.7 ± 28 to 112.7 ± 26 mmHg, p < 0.01 that were significant statistically in comparison to group.
The mean heart rate and systolic pressure, the M mode echo parameters and the mean difference between variables before and after haemodialysis inboth groups.

NS = not significant, SBP (systolic blood pressure), HR (heart rate), LVEDD (left ventricle end diastolic dimension), LVESD (left ventricle end systolic dimension), Inferior Vena cava Diameter (VCD).
In group II, there was a significant increment of mean LV EF% of 7% (4.2 vs. 0.2) in group I, and reduction of LV End Diastolic Dimension (LVEDD) from 4.6 to 4.28 cm, p < 0.05.
Table 3 showed the pulsed Doppler data of LV diastolic filling of the tranmitral valve, and the aortic valve velocity integral in both groups.
The pulsed Doppler indices compared in both groups before and after haemodialysis.
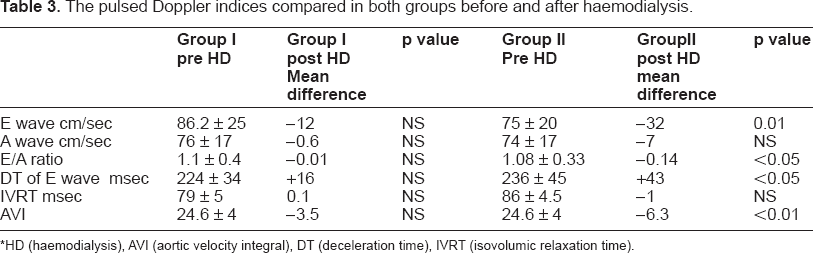
*HD (haemodialysis), AVI (aortic velocity integral), DT (deceleration time), IVRT (isovolumic relaxation time).
In group I, the differences of Doppler variables between the pre and post haemodialysis were of no statistical significance. In group II, as shown in Figure 1 and Table 3. There was a significant difference of Doppler variables between the pre and post dialysis for transmitral E wave velocity reduction of 42%, and the reduction of velocity integral of the aortic valve by 26%. The inferior vena cava diameter was reduced significantly by 17%.
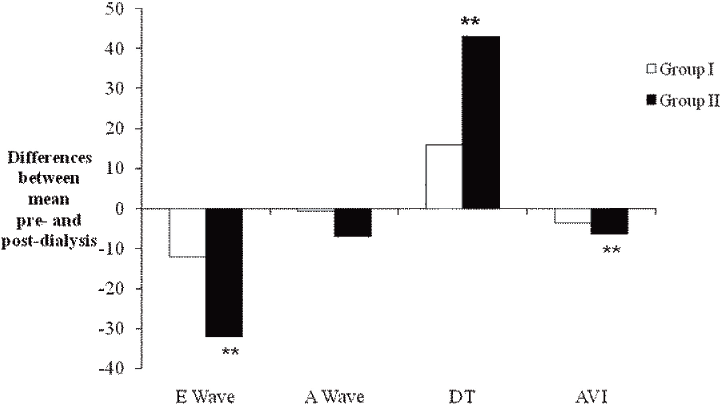
Mean differences of Doppler Indices between pre-dialysis and post-dialysis in group I (with net fluid loss < 2L) and Group II (net fluid loss ≥ 2L). (**) = significant comparing pre-dialysis with post-dialysis.
The predialysis pattern of diastolic filling in the was of abnormal relaxation pattern (Type I) in 40 out of 52 (78%) and of constrictive pattern (Type III) in six (10%) and another six (10%) of pseudo-normal pattern, (Type II).
Left Ventricular Hypertrophy
Patients who had left ventricular hypertrophy on 12 leads ECG were 26 (50%), in the whole group all had left ventricular hypertrophy on M mode echocardiogram.
The number of patients that had LVH on echo were 36 out of 52 (69%), all of them had abnormal relaxation pattern on pulsed Doppler except one.
Asymptomatic Hypotension during Dialysis
Eleven patients (21%) had episodes of intradilaysis hypotension with SBP less the 90 mmHg towards the end of the dialysis, none of them had syncope or giddiness and there was no need to discontinue HD, one had an episodes of atrial fibrillation.
Eight of the eleven (29%) were observed in group II and three (12%) patients in group I.
Among those with asymptomatic hypotension seven (60%) were diabetic.
On sub-group analysis for patients with intra-dialysis hypotension (n = 11) in comparison with those without (n = 41). The pulsed Doppler analysis showed, the deceleration time of the E wave was 246 m.sec ± 40 vs. 210 ± 15 (p value <0.01) for those without, like wise the E/A wave ratio was (0.7 ± 0.3 vs. 1.01 ± 0.25, p < 0.001).
Discussion
In this study the impact of net fluid loss (preload reduction) during haemodialysis on the pulse Doppler indices of LV was evaluated.
The predialysis pattern of diastolic flow was of abnormal relaxation pattern (Type I) in 78% of the study population regardless of whether they were LV hypertrophy on echo or not. The possibility that ESRD may cause the abnormal relaxation pattern in the absence hypertension may explain the above finding. A high number of abnormal relaxations were observed by others, where the incidence of abnormal relaxation was noted of 77% and the restrictive pattern and pseudonormal was 13% and 21% respectively.4,5
The post dialysis data of M mode echo and Pulsed Doppler indices of all patients showed a trend for reduction of all pulsed Doppler velocities but a significant reduction was observed in group II only for E wave velocity, E/A ratio, the Aortic Time velocity integral with significant prolongation of DT time of E wave. These findings were in agreement with an earlier study by Gagliardi et al. and others, where patients with end stage renal disease on regular haemodialysis had a significant reduction of E wave velocity and prolongation of DT time.8,9,10.
The pulsed Doppler velocity reduction is probably due to the significant reduction of venous return (preload) during HD evidenced by the significant reduction 17% of the inferior vena cava diameter. This suggest that the preload reduction is possibly the main mechanism account for the observed dynamic changes in pulsed Doppler indices.
The post dialysis time velocity integral (TVI) of the aortic valve as a parameter of LV systolic forward stroke was significantly low in group II compared to group I, mostly due to the significant net fluid loss and low venous return in that group. However no predictive value for hemodynamic events suggested from the baseline data of TVI similar to the diastolic indices.
An observed increment of the left ventricular ejection fraction by 7% mostly in groupie mostly due to the reduction of the LV end diastolic dimension and the significant reduction of after load, this was in agreement with others where improvement of LVEF% at end of HD was observed. 15
Intradialysis hypotension with systolic BP of less than 90 mmHg was observed more in group II, this reduction of SBP may be due to the reduction of venous return. The rapid removal of large volume during dialysis with autonomic dysfunction among diabetics may attribute to the hypotension in this sitting. 12 Hypovolemia is mostly due to the imbalance between the amount of fluid removal and the refilling capacity of the intravascular compartment.12,13
Patients with intradialysis hypotension (n = 11) compared to without (n = 41) had prolonged DT of E wave >246 m.sec and the E/A ratio of <0.7 when
This Observation is in keeping with previous reports that showed DT of E wave as the most powerful predictor of hypotension during HD.4,10,11,14
All patients with hypotension had abnormal relaxation pattern (Type I), however, the incidence Diabetes mellitus were similar. This finding is different from previous reports where hypotension was observed exclusively amongst diabetic patients. 16
Limitation of the Study
This study is small in number, open labelled and although randomisation was consecutive, patients with ischemic heart disease or valve disease were excluded in order to eliminate errors of measuring the Doppler indices, thus, the study represent certain groups of ESRD patients, but not all of them.
This study may serve as a pilot study, Large sample population may be warranted in the future.
Conclusion
In the clinical setting of patients with end stage renal disease on regular haemodialysis, the net fluid loss (preload reduction) is directly proportional with reduction of early diatolic filling and E/A ratio of the LV.
Patients with prolonged DT more than 246 m.sec and E/A ratio less than 0.7 on base line echo-Doppler may be used as a Doppler predictors of intradialysis hypotension.