
Abstract
Apoptosis was induced in heparinized human whole blood by 3 different ways (radiation, bleomycin, or etoposide), and various mRNA were quantified using the method we reported (Clin. Chem. 2006; 52:634-642). We found that cyclin-dependent kinase inhibitor 1A (p21) and p53 upregulated modulator of apoptosis (PUMA) were the most sensitive and universal mRNA markers of apoptosis in leukocytes. In order to define positive and negative responses, a synthetic RNA was spiked into the lysis buffer and the fold increase was calculated. As a result, 837/880 (95.1%) of data points stayed between 0.75 and 1.5 fold increase, and 874/880 (99.3%) were within 0.5-2.0 fold increase. When blood samples from 40 healthy adults were stimulated with 22 different drugs, more than 75% of the samples responded to bleomycin (1 μM), idarubicin (2 μM), vincristine (1 μM), daunorubicin (2 μM), cytarabine (10 μM), to induce p21 and/or PUMA mRNA, and approximately 25% showed no induction. Significant correlation was found between p21 and PUMA mRNA responses, and between daunorubicin and cytarabine, idarubicin, and vincristine for both p21 and PUMA. The quantification of drug-induced mRNA in whole blood will be considered as ex vivo, and is a suitable platform for biomarker screening as well as a model system for drug sensitivity tests in future.
Introduction
Various gene amplification technologies are used to determine the levels of specific mRNA in human peripheral blood. Diagnostic tests for minimal residual diseases, which are based on the detection of unique mRNA derived from circulating tumor cells (Kwon et al. 2005), leukemia cells (Jones et al. 2003), infected leukocytes (Furtado et al. 1999), etc, are the first in a series of clinical applications. Since these target mRNA do not exist normally, the detection of such abnormal mRNA shows clear clinical utility. The next challenge is to identify abnormal levels of mRNA that commonly exist in both normal and disease states. Although normal reference values of these mRNA were quantified using healthy subject population (MAQC Consortium, 2006; Mitsuhashi et al. 2006; Peters et al. 2007; Zheng et al. 2006), the identification of disease-specific mRNA levels is one of the current topics in molecular diagnostics development.
We recently realized another frontier related to the clinical application of these mRNA detection technologies. This is an ex vivo diagnostics assay (Mitsuhashi, 2007), where whole blood was stimulated with appropriate drugs in vitro, and drug-induced mRNA was successfully quantified within 1-4 hours. The use of whole blood and a short incubation period can be considered as ex vivo. The measurement of proteins or other biological assays require much longer incubation periods, usually overnight to a couple of days, that may induce additional artifacts. Typically, mononuclear leukocytes are isolated, suspended in culture media, and incubated in a CO2 incubator with various drugs. However, this assay condition is no longer physiological due to a lack of communication among different cell populations, oxygen supply from erythrocytes, as well as complex interactions with plasma proteins and other components.
Although current gene amplification technologies have the power to detect a single copy of mRNA, the sensitivity of ex vivo tests is susceptible to variations among multiple aliquots. Moreover, because a single blood sample becomes at least 6 aliquots (triplicate for both untreated and treated samples), a high throughput assay platform is required. Here we report comprehensive studies of ex vivo assay of drug-induced mRNA in human whole blood.
Materials and Methods
Primers and probes
Polymerase chain reaction (PCR) primers and TaqMan probes were designed by Primer Express (Applied Biosystem, Foster City, CA) and HYBsimulator (RNAture, Irvine, CA) (Mitsuhashi et al. 1994; Hyndman et al. 1996) (Table 1). Oligonucleotides were synthesized by IDT (Coralville, IA), Tsukuba Oligo Service (Tsukuba, Japan), Nippon EGT (Toyama, Japan), and Hokkaido System Science (Sapporo, Japan).
Primer and probe sequences used in the study.

Blood treatment
In 8-well strip microtubes, 1.4 μl of 50x concentrations of drugs or controls (phosphate buffered saline (PBS) and dimethyl sulfoxide (DMSO)) were added, and stored at -20 °C until use. The final concentrations of these drugs were summarized in Table 2. Heparinized whole blood samples were obtained from Hitachi, Ltd., Hitachi General Hospital (Hitachi, Japan) and Apex Research Institute (Tustin, CA) after respective Institutional Review Board (IRB) approvals. Forty healthy adult volunteers used in Table 2–3 and Figure 4–5 were 10 each of twenties, thirties, forties, and fifties of Japanese with an equal number of male and female. Blood samples were stored at 4 °C, and stimulated with appropriate drugs on the same day of blood draw. Seventy μl of blood samples was added into each well in triplicate, and incubated at 37 °C for 0-8 hours with cap closed. For radiation treatment, blood was stimulated with designated doses using cesium-137. In Table 2–3 and Figure 4–5, the volume of whole blood was approximately 5 mL (= 70 μl/well × 3 wells (triplicate) × 24 (22 drugs and 2 controls (PBS or DMSO). After each drug treatment, blood samples were stored frozen at -80 °C. Chemicals used in the study were purchased from Sigma (St Louis, MO) and Wako Pure Chemicals (Osaka, Japan). Each concentration was equivalent to the blood level 1-5 hours after intravenous injection, except idarubicin (IDR), mitoxantrone (MIT), vincristine (VCR), and aclarubicin (ACR) which used 2 different doses.
Summary of drug-induced p21 and PUMA mRNA expression in 40 healthy adults.

Drug-induced p21 and PUMA mRNA and subject's characteristics.

: M: F = Male vs Female
: FI = Fold Increase
: p < 0.05
:p < 0.001
mRNA quantification
Fifty μl of blood samples were applied to 96-well filterplates to trap leukocytes. Sixty μl of lysis buffer containing known amounts of external control RNA34 and a cocktail of specific reverse primers was applied to the filterplates, and the resultant cell lysates were transferred to oligo(dT)-immobilized microplates (GenePlate, RNAture) (Mitsuhashi et al. 1992; Hamaguchi et al. 1998) for poly(A)+ mRNA purification. The cDNA was directly synthesized in 30 μl solutions at each well: specific primer-primed cDNA in the liquid phase and oligo(dT)-primed cDNA in the solid phase (Mitsuhashi et al. 2006). Four μl cDNA solution was used for TaqMan PCR (Applied Biosystem) (Holland et al. 1991) or SYBR Green PCR (BioRad, Hercules, CA) (Morrison et al. 1998). Each gene was amplified individually. The cycle threshold (Ct), which was the cycle of PCR to generate certain amounts of PCR products (fluorescence), was determined using analytical software (SDS, Applied Biosystems). For TaqMan PCR, 10-10 6 copies/well of oligonucleotide standards were used for calibration. The Ct values of RNA34 were converted to copy number, and the % recovery was calculated in each well. For cell-derived mRNA, the Ct values were converted to the copy number using respective calibration curves, and these values were further converted to copies/μl blood by dividing with % recovery of RNA34 in each sample (Mitsuhashi et al. 2006). Each copy number of drug-treated triplicate samples was divided by the mean copy number of control samples (vehicle-treated ones) to calculate the mean ± standard deviation of the values of the fold increase. For SYBR Green PCR, 1× RT buffer was used as negative controls to confirm no primer dimer was generated, and the melting curve was analyzed to confirm that PCR signals were derived from a single PCR product. The Ct values of drug-treated triplicate samples were subtracted by the mean Ct values of control samples to calculate δCt, and the fold increase was calculated as 2^(-δCt). Student's t-test was used for statistical analysis.
Comparison to standard methods
Three ml each of heparinized whole blood samples were stimulated with various concentrations of IDR for 4 hours at 37 °C in triplicate, then 2.5 ml was added into PAXgene tubes (PreAnalytix). As parallel experiments, the leftover samples were used for mRNA analysis by our method. After incubation of PAXgene tubes at room temperature for 2 hours, the samples were stored frozen at -80 °C. The samples were shipped to Asuragen (Austin, TX) for total RNA purification, similar to the recent publication (Peters et al. 2007). The cDNA was then synthesized in solution by the standard protocol (Promega) using either oligo(dT) or random hexamers as primers. The resultant cDNA was used for TaqMan PCR. Since the amounts of total RNA were different in each sample, the fold increase of each gene derived from TaqMan PCR was divided by the fold increase of total RNA as a normalization procedure.
Results
Apoptosis induction
In order to calculate fold increase, 2 data points (stimulated and control) are required. There are 2 potential controls, one for the values of time = 0 (baseline expression level, no drugs, no incubation), and vehicle control (incubation with vehicle alone). In Figure 1A–C, control was the values of time = 0. As shown in Figure 1A, the fold increase derived from spiked external control RNA (RNA34) to the assay system was all less than 2 folds among various stimulations and controls. The CD4 mRNA was also measured as a negative control, but was not induced by these stimulations (data not shown). The cyclin-dependent kinase inhibitor 1A (p21) mRNA was increased without any stimulation (Fig. 1B, ○◊δ) as shown in our previous studies (Mitsuhashi et al. 2006). This result indicated that the values of time = 0 were not appropriate control, and vehicle control was used throughout except Figure 1A–C. The levels of p21 were all significantly increased after 3 different stimulations (Fig. 1B● (radiation), ♦ (bleomycin (BLM)), ▲ (etoposide (VP16)). The levels of p21 mRNA increased continuously for 8 hours when blood samples were stimulated with radiation or BLM, whereas VP16 exhibited a transient induction with the peak around 2-4 hours (Fig. 1B).

Screening of mRNA markers
As shown in Figure 2, all tested individuals showed significant (>4 fold increase, all p < 0.001) p21 and p53 upregulated modulator of apoptosis (PUMA) mRNA (Han et al. 2001; Nakano and Vousden, 2001; Yu et al. 2001) induction under 3 different stimulations. NOXA (Oda et al. 2000) was also induced in all individuals, but the basal expression levels were much lower than that of PUMA (data not shown), and the degree of induction was less than that of PUMA (Fig. 2). As shown in Figure. 1C, baseline PUMA expression was unchanged during 8 hours' incubation at 37 °C (Fig. 1C). Upon stimulation, PUMA was induced rapidly with a peak around 2-4 hours (Fig. 1C). In Figure. 1D–F, dose response was also analyzed. As controls, the fold increase of RNA34 was unchanged (Fig. 1D-F●). Significant induction of p21 (Fig. 1D-F▲) and PUMA (Fig. 1D-F▲) was observed at more than 0.1 (PUMA)-1 (p21) Gy of radiation (Fig. 1D), 0.1 μM BLM (Fig. 1E), and 100 μM VP16 (Fig. 1F), respectively. The values of Figure 1A–C and D–E were different because these values were derived from different individuals and the fold increase of Figure 1A–C was calculated by using the values of time 0 as control, whereas control values of Figure 1D–E were vehicle-treated samples at each time point.
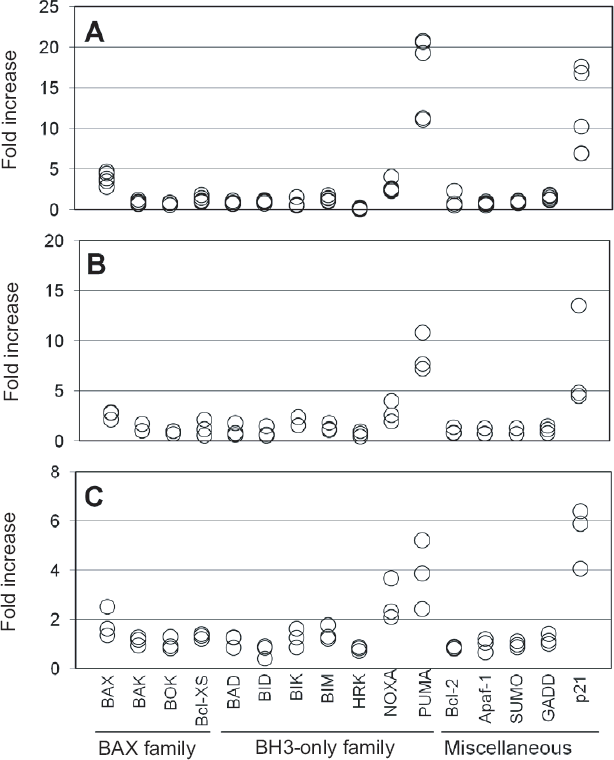
Screening of various pro-apoptotic mRNA expression with 30 Gy radiation (
Comparison to standard methods
The blood volume used in each TaqMan PCR was equivalent to 6.7 μl in our method (30 μl cDNA from 50 μl whole blood, used 4 μl cDNA for PCR) and 8 μl in PAXgene (approximately 25 μl total RNA from 2.5 ml whole blood, 2 μl of total RNA for 25 μl cDNA, 1 μl cDNA for PCR) of whole blood. As shown in Figure 3B–C, significant induction of p21 (▲) and PUMA (♦) mRNA was identified by the standard PAXgene analysis when whole blood was stimulated with >0.5 μM IDR, whereas control CD4 mRNA (○) was unchanged. In contrast, our method (Fig. 3A) showed much smaller variations among triplicate samples (standard deviation bars), and statistical significance was identified from 0.13 (p21) -0.25 (PUMA) μM IDR.

Method comparison. Three ml each of heparinized whole blood samples was stimulated with various concentrations of IDR for 4 hours at 37 °C in triplicate, then 2.5 ml was added into PAXgene tubes (PreAnalytix) for total RNA preparation. The cDNA was then synthesized in solution using either oligo(dT) (
Judgment of positive and negative responses
In order to characterize the variation of our assay, the synthetic RNA34 was spiked into the lysis buffer and the fold increase was calculated. As shown in Figure 4A (y-axis), 837/880 (95.1%) of data points stayed between 0.75 and 1.5 fold increase, and 874/880 (99.3%) were within 0.5-2.0 fold increase. This means that the fold increase more than 1.5 or 2.0 should be considered as positives with 95% or 99% confidence, respectively. More interestingly, the variation was so small in our assay that many data points exhibited statistical significance less than p < 0.05 even the fold increase was less than 1.5 (Fig. 4, x-axis). In contrast to RNA34, p21 and PUMA showed many data points in the upper left quadrant (> 1.5-2.0 fold increase, and p < 0.05), suggesting that these data could be considered as positive (Fig. 4BC). Large fold increases also showed small p values (Fig. 4BC). In our preliminary studies, CD4 mRNA was also measured as an internal control. However, the fold increase was all <1.5 (data not shown).

Judgment of positive and negative responses. Heparinized whole blood samples from 40 healthy adult volunteers as shown in Table 1 were incubated with 22 different drugs or controls (PBS or DMSO) in triplicate, and incubated at 37 °C for 4 hours. Then RNA34 (A), p21 (B) and PUMA (C) mRNA were quantified by TaqMan real time RT-PCR and the fold increase (y-axis) was calculated as described in the Materials and Methods. Statistical significance was also analyzed by the Student's t-test using the values of mRNA of drug and corresponding control (x-axis). Vertical dotted lines showed p = 0.05, and horizontal dotted lines indicated the range of 0.5-2.0 and 0.75-1.5 fold increases.
Drug-induced p21 and PUMA mRNA in healthy adults
As shown in Table 2, more than 3/4 of people responded to BLM, IDR (2 μM), VCR, daunorubicin (DNR), and cytarabine (AraC) to induce p21 and/or PUMA mRNA, however, the results also identified non-responders. Approximately 10% of study subjects responded to carboplatin (CBDCA) and cisplkatin (CDDP), and majority of people did not respond to methotraxate (MTX), cyclophosphamide (CPA), pirarubicin (THP), fludarabine (FDB), ACR, and doxorubicin (DXR) at designated doses (Table 2). The p21 mRNA was induced more frequently than PUMA mRNA, and IDR, MIT, VCR showed dose response reaction (Table 1). We also measured BAX in all cases, and NOXA in some cases, however, BAX and NOXA responses were less than that of PUMA (data not shown).
In Table 3, drug-induced p21 and PUMA mRNA were compared with subject's characteristics, and found that DNR- and IDR-induced p21 and PUMA mRNA, and AraC- and BLM-induced p21 mRNA were age-related (higher in young population than old one). However, no difference was found for gender and the number of leukocytes. Since the fold increase was calculated using the values of drug- and vehicle control-treated samples, the variation of the number of leukocytes may be compensated.
As shown in Figure 5A–D, the results of p21 were correlated with those of PUMA in AraC, DNR, VCR, and IDR, with r 2 values of 0.407, 0.322, 0.402, 0.684 (all p < 0.001), respectively. Ten, 15, 13, and 8% showed double negatives for both p21 and PUMA mRNA against AraC, DNR, IDR, and VCR, respectively (Fig. 5). The degree of induction of p21 and PUMA was very similar in DNR, IDR, and VCR (both x- and y-axis were the same or similar scale in Fig. 5B–D), whereas the degree of p21 responses was much larger than that of PUMA in AraC (Fig. 5A) (p < 0.0001), suggesting that the cytocidal action of AraC was weaker than that of cytostatic action. As shown in Figure 5E–G, the results of DNR (y-axis) were also correlated with those of AraC (Fig. 5E), and IDR (Fig. 5F) for both p21 (○) (r 2 = 0.505, 0.309, respectively) and PUMA (▲) (r 2 = 0.3, 0.37, respectively) (all p < 0.001). Three individuals showed different patterns in Figure 5G, however, once these were removed, significant (p < 0.001) correlation was observed for both p21 (r 2 = 0.244) and PUMA (r 2 = 0.297). The weak cytocidal action of AraC described in Figure 5A was clearly shown in Figure. 5E, where data points of PUMA (▲) were located left side of those of p21 (○). Two regression lines in Figure 5E for p21 (○) and PUMA (▲) mRNA were significantly different (p < 0.02).

Analysis of drug-induced p21 and PUMA mRNA. The same data shown in Table 1 and Figure 4 were transformed to x–y graphs with x-axis as p21 and y-axis as PUMA for AraC (
Discussion
In order to quantify specific mRNA from human whole blood, RNA purification, cDNA synthesis, and gene detection steps are required. Although gene amplification technologies demonstrate an ultimate sensitivity to detect a single molecule in samples, a serious problem must be considered, such that a tiny variation in any step produces a huge variation at the end of exponential gene amplification. Especially in ex vivo analysis, this variation becomes an unacceptable problem, because the fold increase is derived from at least 6 data points (triplicate for both control and drug-stimulation). In this study, we found that >1.5 or >2 fold changes with p < 0.05 could be considered as positives with 95% and 99% confidence, respectively (Fig. 4). This sensitivity is better than that of currently available microarray or RT-PCR experiments, where researchers consider >3 fold increase as meaningful results.
When 21 drugs and 2 controls (PBS and DMSO) are analyzed as shown in Table 2, 69 samples (=23 × 3) should be analyzed. Thus, ex vivo analysis also needs a high throughput assay platform with minimum consumption of blood sample per reaction. Because our assay platform uses 96-well format, as many as 384 (96 × 4) blood samples (=128 samples in triplicate) can be processed simultaneously using a 4 arms-centrifuge. If one patient's sample is used for an entire 96-well plate, blood volume needed is approximately 5 ml (50 μl/well × 96). Since each PCR uses 4 μl of cDNA, 30 μl cDNA allows us to determine 7 different mRNAs from each well. Once cDNA is diluted, many other mRNA can be analyzed as shown in Figure 2. Thus, the method demonstrated in this study shows practical sensitivity and maneuverability for clinically diagnostics.
When cells are determined to undergo apoptosis, several pro-apoptotic proteins are known to be activated. These are so called Bcl-2/BAX family genes, which consist of BAX, BAK, BOKk, BclXS, etc. (Antonsson, 2001). Truncated form of BAX, so called BH3-only members are also known to be pro-apoptotic, and this group consists of BID, BAD, BIK, BIM, NOXA, PUMA, etc. (Wu and Deng, 2002). Many other apoptosis-related proteins have been also identified and characterized, such as Apaf-1 (Robles et al. 2001; Kannan et al. 2001), SUMO (Kannan et al. 2001), and GADD153 (Eymin et al. 1997). Thus, we screened these apoptosis-related mRNAs as shown in Figure 2. Fifteen-25 Gy of radiation is used clinically to kill the donor's leukocytes to prevent graft-versus-host disease during blood transfusion (Davey, 1995). BLM is known to induce apoptosis in human lymphocytes via DNA and chromosome breakage (Vernole et al. 1998). VP16, a potent topoisomerase II inhibitor, induces DNA strand breaks and apoptosis in human lymphocytes (Tronov et al. 1999). As shown in Figure 2, p21 and PUMA mRNA were the most sensitive and universal markers for apoptosis in human leukocytes. These results are reasonable because BAX, PUMA, and NOXA are known to be expressed at the transcription level through p53 activation (Villunger et al. 2003), which is the primary target of most genotoxic drugs. Since p21 is responsible for cell cycle arrest, and PUMA is pro-apoptotic, analysis of these genes may correspond to cytostatic and cytocidal effects of drugs, similar to bacteriostatic and bacteriocidal effects of antibiotics.
Since both p21 (Artuso et al. 1995) and PUMA (Villunger et al. 2003) mRNA are regulated by p53 after DNA damages, correlation between these 2 mRNA shown in Figure 5A–D was reasonable. Dual negative populations shown in the lower left quadrant of Figure 5A–D may indicate a weak p53 functionality due to a mutation of the gene, or the presence of strong DNA protection mechanism such as anti-oxidant activity in these individuals. However, individual-to-individual and drug-to-drug variation shown in Table 2 and Figure 5 uncover the complexity of biology. Even among healthy subjects between 20's and 50's, the responses to AraC, BLM, DNR and IDR were age-related, and younger generation exhibited higher responses than old ones (Table 3). The identification of functional responders and non-responders will provide interesting clinical research models for the analysis of drug response and resistance in humans, which cannot be replaced by experiments with animals or cultured cells (Mitsuhashi, 2007).
The present study will lead to the development of drug sensitivity tests for leukemia, when substantial amounts of leukemic cells exist in peripheral blood (Shinagawa et al. 2004). Moreover, because leukocyte toxicity is one of the unpredictable and fatal problems of chemotherapeutic drugs for patients with solid tumors, ex vivo tests may be used to identify such high risk patients. Since the assay uses whole blood, we do not know which leukocyte population responds to each drug in each patient. If specific cell types are isolated and reacted with drugs separately, the assay condition is no longer physiological. Moreover, plasma factors, erythrocytes, and cell-to-cell communication, which may influence the action of drugs, cannot be assessed by isolated cells. If specific cell population is isolated after drug treatment, gene expression can be analyzed by individual cell basis. However, such isolation procedure must be quick and high throughput in order to avoid secondary gene expression during procedure. Moreover, contamination of other cells makes the interpretation of the results difficult. Thus, this study insists on an ex vivo condition, which shows a clear advantage as a screening tool to identify individuals who need various downstream assays, such as individual cell analysis, genotyping of p53 and other oncology-related genes, expression of drug resistance genes etc.
The mRNA analysis is only applicable to certain classes of drugs, which induce p21 and PUMA mRNA, not for drugs which induce apoptosis via direct interaction with mitochondria or caspases. It is also possible that post-mRNA cascades may be altered, and failed to produce appropriate proteins. If inhibitory cascades, such as Bcl-2 etc. become more dominant, or multi-drug resistance transporter (MDR1) is expressed, a small induction of PUMA may not be enough to induce actual apoptosis. Since these altered functions are more relevant to leukemia than healthy controls, these genes will be analyzed in our subsequent studies of leukemia. In any event, mRNA analysis cannot be ignored, and will add substantial values for the analysis of drug-induced apoptosis. The ex vivo mRNA analysis will be a candidate platform for drug sensitivity tests in the future.
Footnotes
Authors are employees of Hitachi Chemical Research Center (MM), Hitachi Chemical Co., Ltd. (KE, KO, HI), and Hitachi Ltd., Hitachi General Hospital (TI, NC, AS).
Acknowledgements
This study was financially supported by Hitachi Chemical Research Center, Hitachi Chemical Co., Ltd., and Hitachi Ltd., Hitachi General Hospital. We would like to thank Y. Oka, S. Nemoto, N. Sasaki and staffs of clinical laboratories of Hitachi General Hospital, Dr. MJ Tonkon, C. Fox, C. McGinty, and J. Haire (Apex Research Institute), T. Otake, H. Ito, B. Maekawa (Hitachi Chemical), Y. Hasegawa, H. Kojima (Division of Hematology, Institute of Clinical Medicine, University of Tsukuba, Tsukuba, Japan) for the support of the blood draw and clinical section of this study, and E. Elmore (Radiation Oncology, University of California, Irvine) for radiation treatments.
Part of the study was presented at the annual meeting of the Japanese Society of Hematology in 2005 in Yokohama, Japan.