
Abstract
Platelets play a major role in the pathophysiology of acute myocardial infarction (AMI). Recent evidence reveals megakaryocyte-derived platelet pre-mRNA is spliced to mRNA and then translated into functional proteins in response to external stimulation. An exon microarray analyzes pre-mRNA alternative splicing and is thus applicable for studying gene expression in the anucleate platelet. We hypothesized a subset of megakaryocyte/platelet genes exists that are significantly over or underexpressed in AMI compared with stable coronary artery disease (CAD), yielding a gene expression profile for further study. Microarray analysis employing platelet mRNA was used to generate gene expression data in the above two patient groups. Unsupervised hierarchical clustering has revealed an expression profile that includes 95 over- or under-expressed genes depicted in a heat map where separation of both sets takes place. This preliminary study reveals a platelet-based gene expression signature that differentiates between AMI and stable CAD, and further study may yield a prognostic tool for a future AMI event in atherosclerosis risk factor-based subsets of CAD patients.
Introduction
Platelets arise as cytoplasmic fragments from megakaryocytes in the bone marrow. Thus they are anucleate, but retain megakaryocyte-derived cytoplasmic pre-mRNA, at least some of which is spliced into mRNA and translated into protein in response to external stimulation through surface receptor activation and outside-in signaling.1–4 Prior studies have shown that the platelet transcriptome correlates well with platelet proteomic data, demonstrating that transcriptional analysis is relevant to the study of platelet biology, and can likely provide insights into platelet function and the mechanisms of platelet disorders. 5 While the platelet mRNA transcriptome in normal healthy subjects has been reported, 6 little is known about the platelet mRNA transcriptome in pathological states.
Previously unrecognized synthetic capabilities of platelets have recently emerged. The profile of proteins released by activated platelets (the “secretome”) has been well characterized. It has been shown that low abundance mRNA's in the platelet transcriptome are repressed and untranslated in the basal state, but are rapidly translated in response to activation.3–7 Examples include the ability of activated platelets to synthesize aggregation mediators such as thromboxane A2, leukocyte adhesion and activation mediators such as platelet-activating factor, and many other inflammatory and immune modulating factors. 8
Approximately 10,000 genes are transcribed in megakaryocytes and, using microarray analysis, it has been reported approximately 1,500-3,000 transcripts (13%-17% of probed genes in one study) are present in unstimulated platelets.4,6,9–14 For this reason evaluating the platelet transcriptome will be useful for identifying proteins that regulate normal and pathologic platelet functions. 6 In this study we isolated platelet mRNA from patients with AMI and stable CAD and compared gene expression using exon microarray technology capable of documenting alternative splicing. We identified a subset of 95 genes that is capable of differentiating between the two disease states with a corresponding t-test P value of ≤1.5 x 10⁻⁴.
Methods
Patients
Acute myocardial infarction patients (n = 5) presented with a clinical picture, EKG findings, and serum troponin levels compatible with a non-ST elevation MI and were consecutively selected. Stable coronary artery disease patients (n = 7) were selected on the basis of angiographically confirmed stenosis of at least 50% in at least one major coronary artery noted at the time of elective cardiac catheterization. Traditional atherosclerosis risk factors were documented in both groups including age, gender, family history of acute coronary syndrome at an early age (less than 55 in men and less than 65 in women), smoking history, hypertension, diabetes mellitus, and hyperlipidemia. Informed consent was obtained from all patients in accordance with the Declaration of Helsinki.
Isolation of Platelet Mrna
45 ml of blood was drawn into 5 ml of 3% sodium and PRP was isolated from whole blood following centrifugation at 1200 rpm for 20 min. Platelets were isolated after addition of 2 x inactivation buffer (14 mM theophylline + 50 mM EDTA in PBS) to the plasma layer followed by centrifugation at 2100 rpm for 15 min. 15 The platelet pellet was suspended in MACS buffer (2 mM EDTA + 0.5% BSA in PBS) and further isolated using a MACS cell separation column with micro beads conjugated to anti-CD45 antibody to facilitate leukocyte removal (Miltenyi Biotec, Auburn, CA). RNA was then isolated employing an RNeasy mini kit (Qiagen, Valencia, CA). Purity of platelet pellets was checked employing anti-CD61 (platelet) and anti-CD45 (WBC) staining of aliquots for flow cytometry analysis. Any platelet activation was also documented by flow cytometry with anti-CD62P labeling. The integrity of extracted RNA from platelets was analyzed using an Agilent 2100 Bio-analyzer and the RNA 6000 Pico Kit (Agilent Technologies, Santa Clara, CA) and concentrations were determined using a NanoDrop spectrophotometer (NanoDrop Technologies, Wilmington, DE).
Exon Microarray Protocol
Transcriptional analysis was done at the University of Colorado Denver Microarray Core facility. Per standard protocol, RNA was amplified to generate cDNA from 500 pg to 50 ng of starting total RNA with the WT-Ovation Pico RNA Amplification System following the manufacturer's protocol (NuGEN Technologies, San Carlos, CA). Sense transcript cDNA was synthesized using the NuGEN WT-Ovation Exon Module kit following the manufacturer's protocol. The sense transcript cDNA was fragmented and labeled using the Nugen FL-Ovation cDNA Biotin Module V2 kit following the manufacturer's protocol. After standard labeling, each sample was hybridized to an Affymetrix Human Exon 1.0 ST array followed by examination with an Affymetrix GeneChip Scanner 3000 (Affymetrix Inc., Santa Clara, CA).
Data Analysis
Gene and Exon Level Analyses
The gene-level and exon-level intensity values were generated with Affymetrix Power Tools (APT), using the PLIER normalization method. All analysis from this point forward was performed using R statistical computation software and packages from Biocon-ductor open source software for bioinformatics.
For the gene-level analysis three filters were applied. First, only the “core” transcripts were selected. Second, transcripts that demonstrated little variation across all arrays were removed. This was accomplished by comparing the variance of the log-intensities for each transcript with the median of all variation for the entire array. Genes not significantly more variable than the median were filtered out. Lastly, low expressing genes were filtered out using the Detection Above BackGroup (DABG) values where genes with DABG value higher than 0.05 were removed. The remaining genes were subjected to a student t-test.
For the exon-level analysis, three filters were applied to reduce the noise level of the data. First, only the “core” exons were selected which represent exons from well annotated transcripts. Second, exons with sequences that were cross hybridized to more than one unique region were removed. Lastly, exons with expression values lower than the 25th percentile of the overall intensity distribution were eliminated. The exon values were further normalized to generate the “Gene-Normalized Intensity” (GNI) value by dividing the exon value with the corresponding transcript cluster intensity and taking the log of the results. A student t-test was performed using the GNI values comparing the two experimental groups, where exons with P-values less than 1.5 x 10⁻⁴ were selected as alternatively spliced. The splicing index was calculated as the log(2) of the AMI population GNI divided by the CAD population GNI.
Results
Demographics
The small number of study subjects precludes any meaningful interpretation of differences in baseline characteristics between groups. Those in the MI group were slightly older (mean 66.7 versus 63.1 years) and had higher rates of diabetes (40 versus 29%) and family history of heart disease at an early age (40 versus 14%). Those with stable CAD had a higher prevalence of current smoking (43 versus 40%), hypertension (86 versus 60%), and hyperlipidemia (86 versus 80%).
Gene Expression Profile
Since platelets are anucleate and our goal was to identify altered gene expression among CAD patients experiencing an MI in comparison with stable CAD patients, by definition this goal involves the identification of alternative splicing from pre-mRNA to mRNA. One tool situated to accomplish this is the Affymetrix GeneChip Human Exon 1.0 ST Array. Minimal platelet activation of identical magnitude in both groups was documented with anti-CD62P labeling. Flow cytometry using anti-platelet and anti-WBC antibodies documented platelet RNA purity of ≥99.7% and RNA integrity was verified with an Agilent 2100 Bioanalyzer and RNA 6000 Pico Kit (Agilent Technologies, Santa Clara, CA).
In total we identified 95 genes differentially expressed between AMI and stable CAD patients with a corresponding t-test P value of ≤1.5 x 10⁻⁴. In addition to this we identified 528 exons as having significant over or under expression in AMI patients versus controls and these were included in 285 genes.
Hierarchical Clustering
The hierarchical cluster diagram of the 95 differentially expressed genes is shown in Figure 1. This demonstrates that acute MI patient platelet gene expression segregates from that of control patients—the lower the branch points are across the top of the map, the more the two members of each pair have in common with each other, and it can be seen the 5 MI samples cluster independently from controls. To the left of the map it can be seen that 95 genes have been identified that manifest significantly different expression levels between the two groups.

Gene level analysis: Heat map showing hierarchical clustering between acute MI and controls with stable CAD. Each column is one microarray (one patient) while each differentially expressed gene is represented by 1 row. Gene clusters are defined by the dendrogram to the left of the heat plot. Upregulated genes are shown in red; downregulated genes are shown in green. A clear pattern of upregulation and downregulation is seen and an expression profile was derived including 95 genes with a corresponding t-test P value of ≤1.5 x 10⁻⁴.
Exon Level Analysis
The criteria leading to an exon being included in the data set was it had to exhibit a minimum fold change in expression of 1.2 and a corresponding t-test P value of ≤1.5 x 10⁻⁴ when its expression was compared between the MI and stable CAD groups. There were 528 exons that met the criteria that were contained within 285 genes. Each of these genes was plotted using the two bar chart method. The fold change and splicing index involving a representative gene is shown in Figure 2.

Exon level analysis: Example of significant under expression of a representative exon between acute MI patients and stable CAD controls. Each bar in the upper panel represents the fold change in expression for the individual exon between the two populations, and the line graph designates the significance level of this difference in units of (-log10 P value). The exon identified by probe set 5419040shows markedly lower expression in the MI patients (-16.87 fold difference), and an elevated-log10 P value (3.19, equivalent to a P value of 6.49 x 10⁻³ The lower panel shows that exon 5419040 has a splicing index of -4.63 with an accompanying inverse log10 P-value of 2.7 (P = 1.97 x 10 -3).
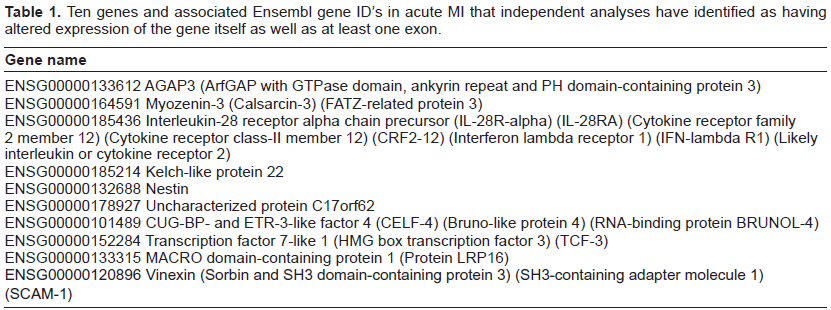
Figure 3 is a Venn diagram to illustrate how the discoveries of 95 genes with altered expression and 528 exons with altered expression contained within 285 genes has resulted in a core set of 10 genes containing at least one over- or under expressed exon. Table 1 lists these genes and, among others, they include cytokine, cytoskeleton, and transcription factor representatives.

A Venn diagram showing derivation of the 10 genes among the 95 detected with altered expression, and that also contain one or more of 528 significantly alternatively spliced exons represented among 285 genes.
Ten genes and associated Ensembl gene ID's in acute MI that independent analyses have identified as having altered expression of the gene itself as well as at least one exon.
Discussion
In this pilot study a platelet gene expression profile during acute MI using platelets was demonstrated. The small number of study subjects in each group means the findings may be further consolidated in a future study with additional subjects. The conclusions from the current study are limited by the small number of study subjects in each arm and by the inability to match patients and controls for each of the atherosclerosis risk factors. While the present study outlines potential platelet bio-markers predictive of acute MI risk among those with stable CAD, it would be more ideal in this respect if gene expression patterns were characterized before the event as well. However such a prospective study would require a much larger number of patients to be studied to identify a statistically sufficient number who go on to develop an acute MI. The preliminary nature of this study coupled with a lack of financial resources have meant we have been unable to carry out confirmatory experiments for the transcripts with altered expression in the acute MI group versus the stable CAD group. The fact we have identified 10 genes with both altered expression of the whole gene as well as at least 1 exon within the gene is suggestive that this group would be truly likely to have altered expression if tested employing a method other than microarray. These study limitations notwithstanding, the genes identified in the current study could act as a basis for further studies of the platelet biology associated with atherothrombotic events. The 10 gene panel identified by statistical analysis may also serve as a tool in the prediction, diagnosis, and prognosis of myocardial infarction.16,17
Human platelets play a critical role in atherothrombotic complications of coronary artery disease and we hypothesized that a significant difference exists between subsets of the platelet mRNA transcriptome profile of stable CAD patients and CAD patients presenting with acute MI. If this reflects a baseline difference between the platelet mRNA transcriptome of MI patients prior to the coronary event and those with stable CAD, then arguably inter-individual variation in the mRNA transcriptome may play a role in predicting future coronary events. This would provide a very powerful tool to examine susceptibility to atherothrombosis, as relatively small cross-sectional studies will be sufficient to examine the atherothrom-botic risk of candidate gene products in the platelet mRNA transcriptome. 18
Some evidence that transcript profiling can distinguish diseased from normal platelet profiles is reflected in a study of essential thrombocythemia (ET) that was conducted with megakaryocytes and platelets. 19
This myeloproliferative disorder is characterized by increased proliferation of megakaryocytes, elevated numbers of morphologically normal circulating platelets, and thrombohemorrhagic events. Results demonstrated different gene expression signatures capable of distinguishing normal platelets from ET platelets and statistical analysis revealed 170 genes that were differentially expressed between ET and normal platelets.
We were interested in determining if any of the 95 genes we identified from the gene expression data shared anything in common with a database of genes already known to have altered expression in the MI or CAD settings. To do this we went to the microarray repository site, GEO, (http://www.ncbi.nlm.nih.gov/geo/) and identified public dataset GSE974 in which genomic expression was catalogued in humans before and after implantation of a left ventricular assist device. The group was separated into those with clinical evidence of either coronary artery disease, acute myocardial infarction, or neither. When comparing CAD and MI to Control samples using a similar statistical routine and setting the false discovery rate at 0.05, we found 56 and 51 genes respectively. When these genes were compared to our 95 genes, none of them were in common with the MI group while 2 were documented in the CAD group-melanophilin (MLPH) and meis homeobox 3 pseudogene 1 (MEIS3P1).
Despite the relative paucity of gene transcription compared with nucleated cells, the platelet proteome is mirrored in the transcriptome and transcriptional analysis predicts the presence of novel proteins in the platelet.5,20,21 McRedmond et al identified 82 proteins secreted from activated platelets and compared these, as well as published proteomic data, to the transcriptional profile. 5 Platelet proteomic data correlated well with the transcriptome, with 69% of secreted proteins detectable at the mRNA level. While many of the most abundant mRNAs encoded known platelet proteins, messages were also detected for proteins not previously reported in platelets. Hence transcriptome analysis has one key advantage over proteome studies of facilitating the identification of previously unknown proteins on the basis of mRNA differentially expressed in a pathological condition over a healthy one.
While conclusions from the above platelet study are encouraging with respect to correlation between protein and transcript expression, in general other (non-platelet) studies comparing quantitative proteomics and standard (i.e. non-exon) microarray data have been conflicting with respect to correspondence between the two. One group hypothesized that this might in part be because the different assays were targeting different parts of the expressed genome and might therefore be subjected to confounding effects from processes such as alternative splicing. 22 Using a genome database as a platform for integration, they combined quantitative protein mass spectrometry with Affymetrix Exon array data at the level of individual exons and found significantly higher degrees of correlation than have been previously observed (r = 0.808). The study was performed using cell lines in equilibrium in order to reduce a major potential source of biological variation, thus allowing the analysis to focus on the data integration methods in order to establish their performance. The authors concluded this approach opens up the possibility for the first time of considering combined microarray and proteomics datasets at the level of individual exons and isoforms, important given the high proportion of alternative splicing observed in the human.
In conclusion this pilot study suggests that platelet gene expression is different between those with acute myocardial infarction and those with stable coronary artery disease. A larger study may serve as a next step in determining whether its results are applicable to a cadre of patients with stable CAD who may have similar traditional atherosclerosis risk factors, yet maybe at varying risk for a future acute MI. If so, then platelet gene expression may serve as a useful biomarker risk stratification tool in acute MI.
Disclosures
This manuscript has been read and approved by all authors. This paper is unique and is not under consideration by any other publication and has not been published elsewhere. The authors and peer reviewers of this paper report no conflicts of interest. The authors confirm that they have permission to reproduce any copyrighted material.
Footnotes
Acknowlegement
This study was supported by pilot project funding provided by the University of Colorado Department of Medicine.