
Abstract
Raman spectroscopy was applied to nail clippings from 633 postmenopausal British and Irish women, from six clinical sites, of whom 42% had experienced a fragility fracture. The objective was to build a prediction algorithm for fracture using data from four sites (known as the calibration set) and test its performance using data from the other two sites (known as the validation set). Results from the validation set showed that a novel algorithm, combining spectroscopy data with clinical data, provided area under the curve (AUC) of 74% compared to an AUC of 60% from a reduced QFracture score (a clinically accepted risk calculator) and 61% from the dual-energy X-ray absorptiometry T-score, which is in current use for the diagnosis of osteoporosis. Raman spectroscopy should be investigated further as a noninvasive tool for the early detection of enhanced risk of fragility fracture.
Introduction
The current reference standard for the diagnosis of osteoporosis and assessment of fracture risk is measurement of bone mineral density (BMD) using dual-energy X-ray absorptiometry (DXA). In the developed world, the lifetime risk of a fracture in Caucasian women is between 30% and 40%. 1 Femoral neck fracture has the highest mortality rate of any type of fragility fracture, 2 with incidence increasing exponentially with age.3,4 Responding to the rising population burden of the disease, the World Health Organization (WHO) has identified a need for improved prognostic indicators and alternatives to BMD-based diagnostic tools to assess fracture risk.1,5 Recently, there has been a trend toward the use of BMD measurements in combination with other clinical risk factors in order to improve overall predictive performance.6,7 A clinically accepted risk calculator is the QFracture tool for assessment of fracture risk. 8 Clinical variables evaluated in the QFracture algorithm in men and women are age, sex, body mass index (BMI), smoking, alcohol intake, glucocorticoid use, asthma, cardiovascular disease, history of falls, chronic liver disease, rheumatoid arthritis, type 2 diabetes, and tricyclic antidepressants. Additional factors used in women only are hormone replacement therapy, parental history of hip fracture, menopausal symptoms, gastrointestinal malabsorption, and other endocrine disorders. 9 Screening programmes that use a simple initial assessment such as QFracture may be able to target further evaluation in subjects identified as being at very high risk of fracture.
Anecdotally, patients diagnosed with osteoporosis have reported loss of fingernail resilience 10 with disease progression. Attempts have been made to investigate potential associations between aspects of nail composition and osteoporosis or fracture risk. Bahreini et al. 11 demonstrated some correlation between individual fingernail elements and BMD using laser-induced breakdown spectroscopy; however, there was no correlation between fingernail elements and osteoporosis or fracture risk. Vecht-Hart et al tested cation concentrations in fingernail sourced from subjects and found no significant correlation between calcium or magnesium concentrations and BMD. 12 However, a study completed 10 years later by Ohgitani et al concluded that nail mineral content, specifically calcium and magnesium concentrations, could be used as an indicator of BMD. 13 The discrepancy between these last two studies may reflect the complex nature of bone metabolism and/or the variation between different techniques.
Preliminary studies by the authors have suggested a possible relationship between human fingernail structure, osteoporosis, and fracture risk14–17 using Raman spectroscopy, an optical analytical technique for obtaining vibrational information on molecules in a sample excited by a laser source. The spectrum of a sample with many different molecules is a linear combination of the spectra of all the Raman active molecules in the sample and can be regarded as an optical molecular fingerprint of the sample. 18 Keratin and type I collagen are the two key proteins in nail and bone, respectively. They both undergo posttranslational and nonenzymatic modifications. Raman spectroscopy can identify such changes,19–21 but the tissue under analysis needs to be accessible, and so we have chosen to study the nail. We speculate that the degree of posttranslational modification of keratin and type I collagen is associated. Collagen and keratin are both fibrous proteins that serve structural and mechanical roles in the body, providing a strong flexible framework for the support of cells and tissues. Both proteins consist of polypeptide chains formed by amino acid condensation 22 and express the same characteristic bands (CH2 and amide I) in the 1200–1800 cm–1 region of Raman spectra. 23 It is valid, then, to speculate that the degree of posttranslational modification of keratin and type I collagen are associated. The research contained herein is motivated by this hypothetical link between bone collagen and nail keratin.
The authors incorporated the Raman data derived from the nails of the subjects into an algorithm that provides an assessment of underlying bone health as pertaining to the risk of a fragility fracture. The primary objective of this study was to determine the sensitivity and specificity of the Raman spectroscopic method in discriminating between subjects who have fractured in the absence of major trauma after the age of 45 years and subjects who have never had a fracture in adulthood. The secondary objective of the study was to determine whether the information provided by the Raman spectra is different to that obtained from existing methods of determining bone health and whether combining the Raman data with information from those existing standards will enhance discrimination.
Materials and Methods
Study design and patient population.
A clinical study entitled Fracture Risk Assessment Nail correlation (FRAN) was designed to test the link between the nail keratin and the current status of bone health. This was a cross-sectional, international, and multicenter study to determine the sensitivity and specificity of Raman spectroscopy for assessing fracture risk. A total of 633 eligible women were recruited in this study, and two distinct gold standard measurements of bone health were recorded for each patient, namely fracture history and BMD, the latter as measured by DXA. The research presented here was carried out in compliance with the Declaration of Helsinki. Sample collection was carried out at six centers across the UK and Ireland, and ethical approval was obtained through a multicentre research ethics committee application (MREC number 07/Q1704/1). The centers were Southampton University Hospitals NHS Trust (Southampton, England, UK), Western General Hospital Edinburgh (Edinburgh, Scotland, UK), Sheffield Teaching Hospitals NHS Foundation Trust (Sheffield, England, UK), Cardiff University Academic Centre Llandough Hospital (Cardiff, Wales, UK), Greater Glasgow and Clyde NHS Trust (Glasgow, Scotland, UK), and Mid-Western Regional Hospital Limerick (Limerick, Ireland), providing a wide geographical distribution in terms of the British Isles. Patients presenting for a DXA scan at each participating center were invited to enroll and subjected to a series of inclusion and exclusion criteria that are briefly summarized as follows:
Inclusion criteria: active (ambulatory) Caucasian females aged between 50 and 85 years (inclusive) who were at least 5 years postmenopause and had at least 2 mm of clippable nail.
Exclusion criteria:
History of metabolic bone diseases such as hyper- or hypothyroidism, Paget's disease of bone or osteomalacia, or other potentially confounding diseases such as Celiac or Crohn's disease, chronic liver disease, stage 4 or 5 chronic kidney disease, hyper- or hypoandrenocortism, or any malignant disease in previous 5 years.
A current or recent prescription of a bone active medication such as bisphosphonates (a history of more than 1 week), strontium ranelate (a history of more than 1 week), calcitonin (within 3 months), therapeutic vitamin D (>1000 IU daily), estrogen (within 6 months) or selective estrogen receptor modulators (SERMs, within 6 months), fluoride supplements (>2 mg day–1 fluoride within the previous 2 years), any as yet unstudied or unapproved drugs, aromatase inhibitors, or concomitant use of corticosteroids.
Any fractures with a traumatic cause (eg, road traffic accident).
The patients in the study were divided into the following two groups for the purpose of classification and comparison:
Nonfracture group: women with no history of fracture.
Fracture group: women with a history of fracture (excluding major trauma, eg, car crash) of the proximal femur (hip), vertebra, proximal humerus (upper arm), pelvis, or distal radius (wrist), after the age of 45 years.
Fingernail tissue sourcing.
Subjects were asked to remove any nail polish before presenting and to clean their hands thoroughly with warm soapy water. Fingernail samples were clipped, using nail scissors, from the largest nail available (>2 mm depth of clipping possible) on each hand, and the samples were then placed in a 1.5-mL microtube labeled with a unique identifier code. This code allowed identification of the collection center but not the patient. The samples were stored at room temperature and shipped to a central laboratory for analysis.
A clinical health questionnaire was also completed by each subject and included questions pertinent to bone health such as age, previous fractures, number of falls experienced, alcohol use (< or ≥14 units per week), smoking habits (never, past, current), medications, menstruation history, relevant pathologies, date of birth, height (cm), and weight (kg). The height and weight were also used to calculate BMI.
DXA scans.
Subjects underwent DXA scans, as per WHO guidelines, 24 in the relevant UK or Irish health care center, and the resulting BMD (in g cm–2) for anteroposterior lumbar vertebrae, total femoral neck, and lowest BMD at either right or left femoral neck was recorded. BMD was transformed into a DXA T-score according to the specifications of the manufacturer/model of each scanner used. The study did not follow up the subjects nor were they required by the study to return to the clinic for further procedures. Aside from DXA scans and the collection of nail samples, no additional procedures were performed.
Raman spectroscopy analysis.
Raman spectroscopy analysis was carried out using a Sierra Reader (Snowy Range Instruments) using 785 nm excitation with 50 mW power at the sample. Measurements were carried out by three operators blind to clinical details, based at one location, and using one instrument. Triplicate, spatially separated measurements, each lasting 1 minute, were carried out on each sample. The nails were inspected to confirm they were free of visible contamination and then placed so that the upper surface of the nail faced the laser exit aperture. No further sample preparation was undertaken. Of the 633 samples analyzed, only one (a fracture case in the calibration set) did not give a useable Raman signal, as the detector saturated. The Raman data collected from the nails were processed using singular value decomposition-based background removal,25,26 normalized to the first principal component (PC) score, using Matlab 2013a.27,28 Spectra were acquired from 400 to 1800 cm–1, and this full spectral range was used for the data processing and analysis (see below).
Calibration and validation.
The spectral data acquisition and subsequent data processing and statistical analysis have been modified from the original protocol proposed for the study. In order to provide an independent assessment of the analytic method and data analysis model, the data were split into two sets, one used for optimizing all aspects of the analysis and the other for validating the full analytical process.
The calibration set was made up of complete data from four centers, together providing approximately 75% of the total samples for the study. Data from the two remaining sites were used for validation. This analysis design ensured that between the two phases, DXA scans, questionnaires, and samples were collected and processed by different pools of operators, and patients were drawn from regions that were geographically distinct. The aim was to mimic a real-world-independent application of the method.
The data processing procedures (preprocessing) for the Raman data were created based on the calibration set alone, blind to clinical data. Next, for the purposes of analytical algorithm development, the fracture status and clinical data of the samples in the calibration set (only) were unblinded. Once the signal preprocessing and analytical (risk) algorithms had been locked on the basis of the calibration data, Raman scores were calculated using parameters derived during the calibration phase, for the two centers in the validation set (Edinburgh and Cardiff). Finally, the clinical data for the validation set were unblinded, and the risk scores calculated from the algorithms were compared to the incidence of fracture, allowing an independent evaluation of test performance.
Statistical analysis.
Analyses were performed in Matlab 2013a and R version 3.2.2. 29 The following key clinical parameters, elements of QFracture, were considered: age, BMI, alcohol intake, smoking status, number of falls, use of anticonvulsants, and parental history of osteoporosis. In order to assess differences between fracture and nonfracture groups, continuously distributed parameters were first tested for approximate normality using the Kolmogorov–Smirnov goodness-of-fit test. A Student's t-test was applied for parameters showing approximate normality, and a Wilcoxon rank sum test was applied otherwise. Categorical variables were tested using a Chi-squared test. The results of these statistical comparisons are found in Supplementary Table 1.
Summary of key clinical characteristics of the participants in the study. Counts are given with percentages in parentheses; continuous variables are given by the mean ± standard error.

Risk prediction scores.
For comparison purposes, a number of models were considered, models based on the individual methods and models based on each permutation of combing those methods.
The Raman score was derived as follows. The dimensionality of the Raman data was reduced using principal components analysis (PCA), calculating the PCA model blind to the fracture outcome of the sample. In order to reduce the risk of overfitting further, the PC scores for each component were compared based on fracture incidence and those with a P-value >0.05 for association with fracture were excluded. Remaining PC scores (eight were found to be significant) were used to build a classification model using linear discriminant analysis.
The minimum T-score arising from DXA scans of lumbar spine, total hip, and femoral neck was considered as a continuous measure and shall henceforth be referred to as DXA score.
The clinical score was derived by using the clinical variables listed previously and using the published relative weightings to calculate a truncated QFracture score. 8 It is acknowledged that due to the lack of availability of certain QFracture parameters, some test performance will have been lost in the current application.
The combined models were created by converting both the DXA T-score and the Raman score to a relative risk of fracture. The relationship between relative risk of fracture and the scores was calculated by means of regression lines between scores (average score per 1SD of variation) and risk of fracture. This allows the relationship between each score type and the relative risk of fracture to be determined in a format compatible with the relative risk of fracture used to calculate QFracture.
Test performance calculations.
The scores were characterized in the validation data using receiver–operating characteristic (ROC) curves, making use of sensitivity and specificity over a range of diagnostic thresholds. For each, the area under the curve (AUC) was calculated, and the four scores were ranked accordingly. In order to determine whether improvements in AUC were statistically significant, pairs of scores were tested using the DeLong method, 30 in which significant differences were found, the net reclassification improvement (NRI) and the integrated discrimination improvement (IDI), a generalization of NRI, were calculated as well.
Interaction between Raman test and other parameters.
The degree of interaction between the results of the Raman-based test and the other parameters used within the study was assessed using least squares correlation analysis for all parameters with a continuous numeric scale, while the results of parameters with ordinal or categorical data were assessed using logistic regression. These data are presented in Supplementary Table 1.
Results
Raman spectra of human fingernails.
Figure 1 shows the spectra obtained from the fingernails recorded from the fracture group (red) and the nonfracture group (green). Detailed discussion of the spectral differences is beyond the scope of this manuscript, but briefly, the Raman spectra offer information on the protein structure in the nail.31,32 The primary structures of nail protein are the amino acid residues; the peak labeled “phe” is related to the content of a particular amino acid residue, phenylalanine, which is much stronger in the fracture group. The secondary structure of proteins reflects how the sequence of amino acid residues organizes themselves relative to neighboring residues (whether they adopt helices, beta sheets, turns, or nonsystematic random conformations). The peaks labeled “α” are peaks that are known to be related to alpha helical content, and these show that the nonfracture group has a higher alpha helical content. Tertiary protein structure describes how the secondary structures are then folded together, while quaternary protein structure is how individual peptides (continuous lengths of amino acid residues) interact with each other to form superstructures. The peaks labeled “S-S” and “S-H” are related to the degree to which cysteine (side group is S-H) bonds to itself (forming cystine, side group is S-S), and these are critical in determining the tertiary structure and the quaternary structure of proteins. The spectral differences suggest that there are measureable changes in all levels of protein structure within the fingernails of the subjects in the fracture group compared with the subjects in the nonfracture group.
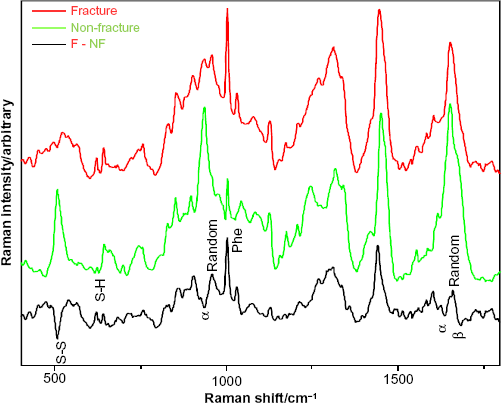
Partial subtraction Raman spectra of the fracture group (red) and the nonfracture group (green). Also included is the one to one subtraction (black) and some key peak assignments. Protein secondary structure indicated by α (alpha helical), β (beta sheet), and random, S-S indicates disulfide bonds, S-H free sulfydryl bonds, and Phe phenylalanine.
Clinical features.
As shown in Table 1, the calibration and validation sets were well matched in terms of age, height, weight, and thus BMI. Although the calibration set was composed of 40% fracture cases, however, the validation set was composed of 53% fracture cases. The comparisons of fracture versus nonfracture groups showed differences in age (P = 0.02), anticoagulant use (P = 0.03), and number of falls (P < 0.001); other differences were not statistically significant.
Interaction of individual Raman model and risk factors.
None of the continuous factors show a strong correlation to the Raman score (Supplementary Table 1), with the highest least squares correlation at 0.08 meaning that at most 8% of the variation in the Raman score can be explained by a continuous clinical parameter recorded within this study. The individual correlations for specific DXA sites are R 2 = 0.02 and 0.012 for the lumbar spine (vertebra) and femoral neck (hip) sites.
None of the binomial parameters showed a significant difference in Raman score between the categories. For the multinomial parameters, logistic regressions failed to identify significant trends for the two of the parameters.
Score performance.
Table 2 lists the values of parameters, as calculated in the validation set (n = 179), used to evaluate the comparative effectiveness of classification using different inputs. For the individual tests, the AUC is highest for the Raman data (67% test, P < 0.05) compared with DXA (57%, P < 0.05) and CRFs (61%, P < 0.05). Scores were placed in increasing order of AUC, from clinical (AUC = 0.60) to Raman/clinical (AUC = 0.74), and a significance test was applied to compare each AUC with each model built on individual data type.
Arear under the Curve (AUC) in the validation set for the four scores. A DeLong confidence interval is provided. The P-value indicates the significance of the difference in AUC, in comparison to the row above.

There were three key findings. First, all the models built on individual approaches were statistically significant, with the Raman spectra yielding the best numerical result.
Second, the estimates of AUC for clinical score, DXA score, and DXA/clinical score were not significantly different from one another; all yielded similar test performance.
Third, the combined Raman/clinical score provided a clear improvement over and above the DXA/clinical score (P = 0.009). The addition of the DXA scores to the combined Raman/clinical score did not improve the performance of the classifier. Figure 2A shows the ROC curves for the discriminant score derived from each of the individual models, while Figure 2B shows the ROC curves for the scores derived from the combined models.

ROC curves for the fracture risk models built on (A) individual approaches and (B) combined approaches.
For the purposes of reclassification analysis, the latter two scores were rescaled to a common [0–1] range, by subtraction of the minimum and division by the range. The comparison of Raman/clinical versus DXA/clinical had P = 0.276 for NRI and P = 0.037 for IDI.
In order to characterize further the performance of the Raman/clinical score in the validation set, the sensitivity and specificity arising from different diagnostic thresholds are shown in Table 3. It is noted that for the current noninvasive method, some reduction in specificity may be tolerated in the interests of increased sensitivity. In other words, for postmenopausal subjects who have the opportunity to make dietary and lifestyle changes in order to reduce their risk of fracture, false positives may be less damaging than false reassurance. Table 3 also shows the effect of varying the decision threshold on diagnostic accuracy and positive and negative predictive values.
Test performance of the Raman/Clinical Score, for different diagnostic thresholds.
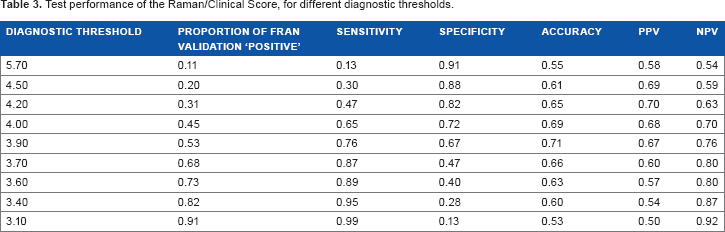
The diagnosis of osteoporosis, according to DXA, correctly eliminated 80% of the nonfracture controls within the study from being identified as at-high-risk of fracture. This is equivalent to specificity if an osteoporosis diagnosis is considered equivalent to assigning a person to a high-risk fracture group. In contrast, only 25% of the fracture cases within the study were diagnosed as osteoporotic ie, 75% of the fracture cases would have been placed in the non-intervention, lower risk category if based on this test alone. Given that an osteoporotic diagnosis is labeling the patient as diseased and considered at high risk of fracture, this value of 25% will be considered equivalent to the sensitivity to fracture. To compare the sensitivity of the tests on an equal footing, the specificity for the other sources of information was set to the value closest to 80%. The sensitivity at specificity closest to 80% for Raman spectroscopy alone is 42%, and when the Raman score was combined with the reduced QFracture score, the sensitivity achieved is 52% (data not shown in Table 3 as this table corresponds to fixed intervals of decision threshold).
Discussion
The results demonstrate that the Raman spectra of human fingernails may be used to discriminate between postmenopausal patients who have sustained a fragility fracture and those who have not. Of the individual tests, it gave the best AUC, while combining it with clinical variables gave a statistically significant difference in its AUC compared to all other individual model scores, showing that it provides additional information beyond earlier established methods. It suggests that combining the Raman data with the clinical information provides more insight into the underlying bone health of the subjects in the study than has hitherto been possible.
The performance of the Raman/clinical algorithm was very similar between calibration and validation (AUC = 0.73 in calibration; AUC = 0.74 in validation), suggesting that the model is stable and can be applied to a wider population than was captured in the calibration set. The geographical distribution of the calibration and validation sets spans all the major regions of the British Isles including the Republic of Ireland.
The underlying link between nail keratin composition/structure and bone health has not been fully elucidated, but a number of studies have shown a link between the chemical composition of nail and fracture risk/bone health.14–17 In our published preliminary studies investigating the link between collagen and keratin, the mean elastic modulus and hardness as measured by nanoindentation were lower in osteoporotic patients than in controls, although this did not reach significance 14 ; however, disulfide bond (S-S) content of fingernail was found to be significantly lower in the osteoporotic group.14,17 A further study population 16 comprised 159 women of whom 81 were premenopausal and 78 were postmenopausal. A total of 34 fracture cases were recorded with 16 occurring in the premenopausal and 18 occurring in the postmenopausal women. Significantly lower disulfide content of fingernails was observed in subjects with a history of fracture. In comparison to the other methods used in this study (DXA, biomarkers), the Raman test discriminated most accurately between the control and the fracture cases (P = 0.003). There is little in the literature to directly link S-S and S-H bonding to osseous changes, but the presence of these bonds is acknowledged to play a direct role on bone formation and subsequent strength: Both collagen and keratin require cysteine incorporation and sulfation for structural integrity; S-S bonding is essential for procollagen folding and stability of mature collagen, 34 and the biosynthesis of procollagen requires both intra- and inter-chain disulfide bond formation. Noncollagenous proteins in the organic matrix of bone such as osteonectin also require disulfide bonding for stability. 35 It has been reported that postmenopausal women with osteoporosis have elevated total homocysteine (Hcy) and significantly reduced plasma cysteine (Cys) levels in comparison to their healthy counterparts. 36 The inverse relationship between total Hcy and Cys might imply that a trans-sulfuration defect could be impairing the irreversible conversion of total Hcy to Cys. The authors suggest that a low Cys concentration, possibly due to reduced flux from Hcy, may lead to less availability for collagen formation, resulting in poor bone quality. 36
The mineral phase of bone provides strength (the ability to withstand force), while the proteins provide resilience (hence ability to recover from a force), giving two independent dimensions to fracture risk. The evidence presented in this study shows that Raman spectroscopy provides information over and above DXA, suggesting that it may capture a different dimension of fracture risk. The authors hypothesize that the Raman test on nails is measuring a surrogate marker of protein quality in the bone.
Conclusions
The data presented in the study demonstrate that Raman spectroscopy can provide novel insight into a subject's fracture risk, and this information is sufficiently distinct from other readily available fracture risk predictors that it can be combined with those approaches to deliver a powerful algorithm that outperforms the information that can be derived from DXA T-score and clinical data alone.
Limitations of the study.
The study was a cross-sectional study looking at existing recent fracture (in the absence of a major trauma) against absence of adult fracture. It is not designed to demonstrate the potential for the method to predict future fracture. It is intended to capture two distinct groups of people with different states of bone health, with the presence of fragility fracture (the cause of which cannot be attributed to a major trauma) taken to confirm the presence of poor bone health.
The FRAN study was designed to utilize the occurrence vs. nonoccurrence of a fragility fracture as its gold standard assessment of bone health. This is due to the absence of any widely accepted gold standard reference measurement technique and the practical and ethical issues that would be involved in collecting biopsy samples (which is relatively straightforward for fracture cases undergoing corrective orthopedic surgery, but challenging for healthy controls). However, fracture measurement is an imperfect gold standard; the clinical end point measured in the FRAN study is not a definitive end point from a negative (absence) view point but is robust from a positive (presence) view point. Absence of a fracture is NOT definitive proof of healthy bone, as the subject may have thus far avoided low impact trauma. Due to the heterogeneity of the nonfracture control group, the outcome is expressed in terms of risk of fracture rather than a definitive diagnosis.
Author Contributions
Conceived and designed the experiments: NMC, OMO'D, MRT. Analyzed the data: JRB, CC, ATB. Wrote the first draft of the manuscript: JRB. Contributed to the writting of the manuscript: JRB, NMC, CC, ATB, MRT. Agree with manuscript results and conclusions: JRB, NMC, CC, OMO'D, ATB, RE, SHR, MDS, GP, MRT. Jointly developed the structure and arguments for the paper: JRB, NMC, CC, ATB, RE, SHR, MRT. Made critical revisions and approved final version: JRB, NMC, CC, ATB, RE, SHR, MRT. All authors reviewed and approved the final manuscript.
Supplementary Material
Supplementary Table 1.
The significance of different variable clinical risk factors for fracture and their correlation with the Raman based fracture score.