
Abstract
Owing to the heterogeneous and continuously evolving nature of cancers, classifiers based on the expression of individual genes usually do not result in robust prediction of cancer outcome. As an alternative, composite gene features that combine functionally related genes have been proposed. It is expected that such features can be more robust and reproducible since they can capture the alterations in relevant biological processes as a whole and may be less sensitive to fluctuations in the expression of individual genes. Various algorithms have been developed for the identification of composite features and inference of composite gene feature activity, which all claim to improve the prediction accuracy. However, because of the limitations of test datasets incorporated by each individual study and inconsistent test procedures, the results of these studies are sometimes conflicting and unproducible. For this reason, it is difficult to have a comprehensive understanding of the prediction performance of composite gene features, particularly across different cancers, cancer subtypes, and cohorts. In this study, we implement various algorithms for the identification of composite gene features and their utilization in cancer outcome prediction, and perform extensive comparison and evaluation using seven microarray datasets covering two cancer types and three different phenotypes. Our results show that, while some algorithms outperform others for certain classification tasks, no single algorithm consistently outperforms other algorithms and individual gene features.
Introduction
The development of high-throughput gene expression profiling techniques, such as microarray and RNA deep sequencing, enables genome-wide differential gene expression analysis for complex phenotypes, including various types of human cancer. Researchers are usually interested in identifying one or more genes that can be used as markers for diagnosis, potential targets for drug development, or features for predictive tasks to guide treatment. Indeed, previous studies show that features selected based on the differential gene expression of individual genes are useful in predicting patient outcome in cancers. Various gene expression-based features for certain types of cancer 1 are also studied and used as targets for drug development. 2 However, an important problem with individual gene markers is that they usually cannot provide reproducible results for outcome prediction in different patient cohorts. For example, two previous studies in breast cancer have identified a set of about 70 genes from two different breast cancer microarray datasets, and they only share three genes and produce poor cross-dataset classification accuracy.3,4
A majority of recent studies focus on identifying composite gene features and using these features for classification. Composite gene features are usually defined as a measure of the state or activity (eg, average expression) of a set of functionally related genes in a specific sample. The idea behind this approach is that individual genes do not function independently and complex diseases such as cancer are usually caused by the dysregulation of multiple processes and pathways. Therefore, instead of performing classification by using the expression of individual genes as features, we can aggregate the expression of multiple genes that are functionally related to each other. This approach is expected to increase the discriminative power of each feature by deriving strength from multiple functionally associated genes, and noise caused by biological heterogeneity, technical artifacts, and the temporal and spatial limitations can be eliminated. 5 Consequently, these composite gene features have the potential to provide more accurate classification.
The main problem in identifying composite gene features is to find sets of genes that are (i) functionally related to each other and (ii) dysregulated together in the phenotype of interest. Two common sources of functional information we can use to identify the genes that are functionally related are protein-protein interaction (PPI) networks and molecular pathways. Over the past few years, many algorithms are developed utilizing these two sources of information to improve predication accuracy. Three main challenges in utilizing composite features are the following: (1) identification of composite gene features (ie, which genes to integrate), (2) inferring the activity of composite features (ie, which function to use to integrate the individual expression of the genes in each feature), and (3) feature selection (ie, which composite features to include in the predictive model).
Previous studies majorly focused on composite gene feature identification. Various algorithms have been proposed to combine genes into a composite feature using PPI networks6,7 and pathway information. 8 These algorithms combine genes together based on different statistical criteria like t-test score, or mutual information to achieve maximal differentiation power for the features. Feature activity is usually calculated by averaging the expression levels of the genes composing the feature. Test with microarray datasets in these studies shows that composite gene features offer great advantage in classification compared to individual genes.
One common issue with these studies is that their testing datasets are limited. For most studies, only a few datasets relating to a single type of cancer and a specific outcome are used. Also, different studies adapt different training and testing procedures, as well as different feature ranking and feature selection methods. Finally, different studies try to improve classification from different angles. For example, in network-based studies, the emphasis is on finding the best way to identify the subnetwork features, whereas studies on pathways focus on improving activity inference for multiple gene features. However, since these approaches are not necessarily mutually exclusive, and it is desirable to understand how well these methods work together.
In this study, we take a comprehensive approach to evaluate the algorithms and techniques involved in feature extraction, feature activity inference, and feature selection in a unified framework. By doing so, we are able to make a direct comparison between these different algorithms and techniques. We perform computational experiments in a total of 12 setups (different phenotypes, training instances, and test instances), using seven microarray datasets covering three types of phenotypes for two different cancers (breast and colorectal). With multiple tests on different datasets and phenotypes, we are able to evaluate performance more reliably. Finally, by combining algorithms and techniques for feature identification and feature activity inference, we investigate how well different techniques work together and characterize the limits of the prediction performance they can achieve.
Review of Existing Methods
The process of using composite gene features for prediction tasks can be divided into three stages: (1) feature identification, (2) feature activity inference, and (3) feature selection. Feature identification refers to the process of identifying sets of genes to be collapsed into a single composite feature, based on the collective ability of genes in distinguishing different phenotypes. Feature activity inference refers to the model used to represent the state of multiple genes in a sample. Such a model is needed to score the collective dysregulation of a set of genes, ie, to assess the ability of multiple genes in distinguishing phenotypes. For this reason, all methods for composite feature identification are coupled with a method for feature activity inference. Feature activity is also used in performing the classification task. Finally, feature selection refers to the process of selecting the composite features (sets of genes) to be used in the classification task. In this section, we provide an overview of existing methods for each of these tasks.
Feature Identification
One of the first algorithms for the identification of network-based composite gene features is developed by Chuang et al. 6 This algorithm quantifies the collective dysregulation of a set of interacting gene products based on the mutual information between subnetwork activity and phenotype. It then performs a greedy search by growing a set of interacting gene products and adding to this set the most promising interacting partner of the current set of genes to maximize the mutual information. Testing on two 7 breast cancer datasets shows that classification with subnetwork features improves the prediction of metastasis in breast cancer over individual gene-based features. Chuang et al also conclude that subnetwork features are more reproducible across different breast cancer datasets.
Chowdhury and Koyutürk 7 propose a dysregulated subnetwork identification algorithm based on set cover-based model, called NetCover. Instead of using actual gene expression values, this algorithm binarizes gene expression. Namely, in NetCover, a gene is said to cover a phenotype sample positively/negatively if it is upregulated/downregulated with respect to the control samples. Similar to Chuang et al's algorithm, NetCover performs a greedy search on the PPI network by adding genes that maximize positive or negative cover of the subnetwork. Chowdhury and Koyutürk test their algorithm on three colon cancer datasets. Their results show that, by converting the problem to sample cover problem, not only are they able to reduce the computational complexity but also the subnetworks identified by NetCover, providing better classification performance as compared to the algorithm that directly maximizes mutual information.
Su et al. 11 describe another method that limits the search to sets of gene products that induce a linear path in the PPI network. Different from other algorithms, Su et al's algorithm uses average t-test score as a scoring criterion to assess the dysregulation of subnetworks. For every gene in the PPI network, Su et al use dynamic programing to find short paths in the network with maximum average t-test score. Then they rank all the short paths based on the average t-test score and combine top-scoring paths together into a longer linear path. Su et al also improve on the linear path-based algorithm by modifying the objective function to incorporate the correlation among the genes in the subnetwork. 10
Besides these network-based algorithms, other subnetwork identification algorithms are also proposed, with differences in the way they score the dysregulation of subnetwork, the way they restrict the topology of target subnetworks, and the search algorithm they use. 12 14
As compared to networks, utilizing pathways to identify composite gene features is more straightforward, since the set of genes involved in each pathway is available. Most common studies use canonical pathways curated from literature resources such as the Gene Ontology, 15 KEGG (Kyoto Encyclopedia of Genes and Genomes), 16 and MSigDB (Molecular Signatures Database) 17 pathway databases to identify sets of genes that are involved in the same pathway. Generally, however, pathway-based approaches do not demonstrate significant improvement in classification accuracy over conventional individual gene-based classifiers. One possible explanation for this is that not all the member genes in a perturbed pathway are necessarily dysregulated. Motivated by this observation, Lee et al. 8 propose algorithms to preselect a subset of genes from a pathway and use them as composite features. Lee et al's algorithm ranks the genes within a pathway based on individual t-statistic, and performs a forward search starting from the top ranked gene to select a subset of genes that maximize the t-test score of the composite feature. By doing so, they are able to improve the classification performance over standard pathway-based classifiers and individual gene-based classifiers.
Feature Activity Inference
One key question in using composite gene features is how to compute a function that represents the collective state of multiple genes in a specific sample. In most of the network- and pathway-based approaches described above, the average expression value of all genes in the composite feature is used to represent the activity of the feature. One shortcoming of additive subnetwork activity is that the genes composing subnetworks are required to be dysregulated in the same direction; ie, they must be either all up-regulated or all down-regulated in the phenotype samples compared to the controls. Clearly, this assumption may be biologically unreasonable since the interplay among biomolecules is rather complex.
For pathway-based composite features, Tomfohr et al. 18 describe a method to compute pathway activity based on principal component analysis. Later, this method is also used to infer pathway activity for classification purposes, demonstrating improved accuracy over individual gene features. 9 As an alternative, Su et al. 9 describe an approach for probabilistic inference of pathway activity. Su et al's method estimates the probability density function (PDF) of gene expression for different phenotypes on the training dataset based on an assumed Gaussian distribution. Subsequently, they compute the log-likelihood ratio (LLR) between different disease phenotypes based on the PDF and infer the activity of a given pathway by averaging the LLRs of all genes in the set. Testing of this method on breast cancer metastasis shows that classification with pathway activity inferred by this approach results in higher accuracy than a subnetwork-based approach and other pathway-based approaches.
Feature Selection
Feature selection plays an important role in improving the accuracy of any classification task, especially when working with high-dimensional datasets as in gene expression data. Many feature selection methods have been developed in the literature and studied for particular applications. For the application in our study, ie, prediction of cancer outcome based on gene expression, there are many comparative studies that evaluate different gene selection techniques in the context of cancer outcome prediction.19,20
Existing feature selection algorithms are traditionally categorized as the filtering method, wrapper method, and embedded method. 21 Filtering method ranks each feature according to some score that quantifies the discriminative ability of the feature, and only the highest ranking features according to this score are used for classification. 21 The problem with the filter method is that it cannot remove redundant features in an informed way. A simple improvement to the filtering method is the minimum redundancy and maximum relevance (MRMR)-based feature selection, which removes redundant features based on their correlation with the features that are already selected. 22 The wrapper method, on the other hand, employs a classification algorithm to conduct a search for all features and evaluates the goodness of each selected feature subset by estimating classification accuracy. 21 Previous studies show that the wrapper approach generally results in better predictive accuracy than the filtering approach. 22 However, the major issue with wrapper methods is their high computational complexity, and wrapper methods usually do not scale to high-dimensional microarray datasets. Many heuristic algorithms like forward and backward selection are used to alleviate computational complexity, but these methods do not provide any guarantee of optimality. 23 More recently, several embeddings are proposed. A notable embedding method is support vector machine (SVM)-based recursive feature elimination (RFE). 24 SVM-RFE is specifically designed for gene expression data analysis, and it works by iteratively training an SVM classifier with a current set of features and then heuristically removing the features with small feature weights.
All the studies presented here employ a different approach to improve classification performance in cancer outcome prediction, and they all claim that their approach improves classification accuracy over other methods. Detailed accuracy metrics are provided for all the studies, and some studies also include comparison with previous methods. However, these results often conflict with each other,6,10,11 making it very difficult to have a comprehensive understanding of how robust these methods are in terms of improving the accuracy of outcome prediction in cancer.
Methods
Microarray Data
The datasets used in our experiments are described in Table 1. As shown in the table, we use a total of eight datasets; two of these datasets (GSE2034 and GSE7390) contain samples for breast cancer metastasis (including controls) and three (GSE7390, GSE1456, and GSE6532) contain samples for breast cancer relapse (including controls). GSE7390 is a dataset generated by a survey of both metastasis and relapse; thus, it contains information on both phenotypes. Finally, three datasets (GSE17536, GSE27854, and GSE17537) contain samples with colorectal cancer metastasis (including controls).
Gene expression datasets.

PPI and Pathway Data
The human PPI data used in our experiments are obtained from the Human Protein Reference Database. 25 This dataset contains 35,023 binary interactions among 9299 proteins as well as 1060 protein complexes consisting of 2146 proteins. The binary interactions contain in vivo as well as in vitro interactions obtained via high-throughput screening. We integrate the binary interactions and protein complexes using a matrix model (ie, each complex is represented as a clique of the proteins in the complex), to obtain a PPI network composed of 42,781 binary interactions among 9442 proteins.
To obtain the set of known biological pathways, we refer to MSigDB version 4.0. 17 We pick the canonical pathways in the C2 curated gene set, which contains 1320 gene sets and covers about 8000 distinct genes. These gene sets are curated from different pathway databases including KEGG, Reactome, and BioCarta. They provide canonical representation of known biological pathways.
Feature Identification, Activity Inference, and Feature Selection Algorithms
To have a representative set of composite feature identification methods, we consider methods that utilize PPI networks as well as those that utilize pathways. Namely, for network-based feature identification, we implement NetCover from Chowdhury and Koyutürk's study, 7 GreedyMI from Chuang et al' study, 6 and two versions of Linear Path (LP1 11 and LP2 10 ) from Su et al's study. For pathway-based feature identification, we implement a method that builds composite features by utilizing all genes in a pathway (Pathway1) and a method that selects genes in a pathway based on t-statistic score from Lee et al's study (Pathway2). 8 In total, we implement six different feature identification methods, and we use individual gene-based features as a baseline.
For feature activity inference, we compare two methods: (i) aggregate expression of all genes in the set, which is the most commonly utilized technique, and (ii) probability inference based on LLR proposed by Su et al. 9
For feature selection, we compare simple filtering, forward selection, MRMR, 22 and SVM-RFE. 24
We implement all the feature extraction, activity inference, and feature selection algorithms as well as the testing framework in MATLAB. The detailed algorithm can be found in Supplementary File 1.
Testing
The framework we use to test and compare algorithms is shown in Figure 1. In order to evaluate the classification performance of the composite and individual gene features, we utilize a commonly used and widely accepted cross-validation protocol. For each phenotype, we consider any pair of two datasets available for that phenotype, and use the first dataset exclusively for feature identification and the second dataset for feature selection, training, and testing. For testing, we perform five-fold cross-validation on the second dataset. Namely, we partition the samples in the dataset into five subsets of equal size and class distribution. We then designate one-fifth of the samples as testing data and put together the other four folds as training set. To rank the features extracted from the first dataset, we use the training data in the second dataset. For this purpose, we use the appropriate ranking criterion that matches the specific feature identification and activity inference algorithms being tested (eg, the P-value of t-test score for individual gene features, or the mutual information between subnetwork activity and phenotype for aggregate features). We select the 50 features that rank best according to this criterion, train SVM classifiers for the top K (K = 1, 2, …, 50) features on training data, and test the resulting classifier on the test fold. We repeat this procedure by treating each of the five folds as the test fold, and we repeat the entire cross-validation procedure by randomizing the folds 20 times for each dataset.

Schematic illustration of test process. For each disease and outcome combination, the datasets are matched into pairs. The first dataset in each pair and pathway or PPI data are used for feature identification using various algorithms. The second dataset is used for feature selection, training, and testing using five-fold cross-validation. For this purpose, features extracted from the first dataset are ranked using the training data from the second dataset, based on the P-value of t-test score or other ranking criteria based on discrimination of two phenotype classes. Top 50 features are selected according to these criteria, and SVM and logistic regression classifiers are trained with top K (K = 1, 2, …, 50) features on training data and tested on the testing dataset.
We evaluate the performance of the classifier by computing the area under ROC curve (AUC). 26 For each set of features tested (resulting from a specific combination of feature identification and activity inference methods), we compute the average and maximum AUC values across varying values of K(K = 1, 2, …, 50) features. The purpose of this is to assess the average and best possible performance that a set of features can deliver. Subsequently, we compute the average of these two performance figures across the 20 random five-fold partitions. We also compute the standard deviation of these figures across the 20 random partitions, in order to assess the robustness of the features to variation in the distribution of samples. Note that, in most cases, classification accuracy declines significantly when the number of features considered is above 10. For this reason, we consider the top 50 features as the set of candidate features for each combination of algorithms, since this ensures that all potentially valuable features are considered by the feature selection algorithm.
Results
In this section, we present the results of our comprehensive computational experiments by focusing on the general themes that emerge based on the comparison of the different feature identification, activity inference, and feature selection algorithms.
Composite Features Improve Stability of Classification over Individual Gene Features across Different Datasets
It is often claimed that composite features that incorporate protein interaction network or pathway information are likely to be more stable than individual gene-based features. In other words, composite features extracted from different datasets for the same phenotype are expected to exhibit more overlap as compared to individual gene features. The basic premise here is that the composite gene features capture how the regulation of a process, as opposed to the regulation of a specific gene, mediates phenotypic outcome. In order to determine whether feature sets identified by different algorithms show a significant improvement over individual gene features in terms of stability, we employ Jaccard index as a measure of overlap. More specifically, for each dataset pair, we take the union of top 50 features identified by each algorithm on each of the two datasets. Subsequently, for each algorithm, we compute the overlap between the two combined gene sets from the two datasets using Jaccard Index. The results are shown in Figure 2A. In the figure, the box plot shows the Jaccard index for five dataset pairs for each algorithm (Since GSE17537 has a limited number of samples, we do not use this dataset for feature identification.). As expected, individual gene features from different datasets do not show considerable overlap. Among the five data pairs, the overlap is zero for individual gene features for three pairs, one for one pair, and two for another pair. On the other hand, for all other composite feature sets, the overlap in gene content between two pairs of datasets increases considerably over individual gene features.

The stability and reproducibility of composite gene features across different datasets. (
Composite Features do not Significantly Increase Discriminative Power across Datasets
Composite feature identification algorithms are based on combining the differently expressed and functionally associated genes together. For this purpose, these algorithms use different search criteria in the algorithm like mutual information, sample cover, or t-test score. However, ultimately, they all try to maximize the power in discriminating phenotypes. In order to assess the discriminative power of composite gene features, we compute the t-statistic of the feature activity of features identified on the first dataset by using the first and second datasets, for all feature sets identified by different algorithms. The results of this analysis are shown in Figure 2B and C. In the figure, for each of the seven different feature identification methods, the average t-statistic of the feature activity in two different classes is reported. When the first dataset (ie, the dataset used for feature identification is considered), all but one of the composite feature extraction methods is able to improve the t-statistic considerably as compared to individual gene features. The only composite method that is not able to outperform individual gene features is the pathway-based method without feature selection.
An important problem with individual gene features is that genes extracted from one dataset fail to differentiate phenotype in the other dataset. While composite features improve stability of gene content as we discuss above, the cross-dataset t-statistic of composite gene features does not show any noticeable improvement over individual gene features. Thus, the reproducibility of composite gene features is also questionable; the majority of top features extracted from one dataset does not provide a clear differentiation for different phenotypes in other datasets. Note that this is somewhat surprising since there is considerable overlap in gene content, and the underlying reason for this unexpected result may be inconsistencies introduced by normalization.
Composite Gene Features Improve Classification Accuracy over Individual Gene Features, but not Consistently
As we describe in the Methods section, we have a total of 12 test cases. For each of these test cases, the mean and maximum AUC values provided by the top 50 features for each combination of algorithms are shown in Supplementary Figure 1. Surprisingly we do not observe any common patterns across all the 12 test cases. We see clear performance improvement for composite features over individual gene features for many of the test cases, and in most cases, the best performance is always achieved by composite features. However, we are not able to identify a particular feature extraction algorithm that provides consistent performance improvement over single individual features in all tests. In some cases, such as GSE27854-GSE17536 and GSE17536-GSE27854 (Supplementary Fig. 1J, K), we observe that all the composite features deliver identical or even poorer performance as compared to individual gene features. Overall, it is difficult to conclusively identify a composite feature identification algorithm that performs consistently better than other algorithms.
Greedy Mutual Information Shows Overall Improvement over other Methods
In order to comprehensively assess the overall performance of the six composite feature identification algorithms, we take the 12 average and maximum AUC values of top 50 features from all tests for each algorithm and compute the average AUC value provided by each algorithm across all test cases (Fig. 3A, B). As seen in the figure, the only feature identification algorithm that clearly stands out is GreedyMI, which shows slightly larger average AUC value over individual gene features. The average AUC value is 0.606 for the composite features identified by GreedyMI and 0.576 for individual gene features, which account for 5.2% increase. All other methods show AUC values comparable to that of individual gene features, with values ranging from 0.565 to 0.584. The improvement provided by GreedyMI over individual gene features is relatively small and may not be significant. However, when we look at the heat map shown in Figure 3C, which shows the relative performance over individual gene features for each test, we can clearly see that GreedyMI stands out among all the feature extraction algorithms. In 4 of the 12 test cases, GreedyMI achieves 10% or more improvement over individual gene features (17.2% for GSE2034-GSE7390, 13.8% for GSE6532-GSE7390, 12.8% for GSE17536-GSE17537, and 14.7% for GSE27854-GSE17537); in 3 test cases, it achieves 5% or more improvement (6.6% for GSE7390-GSE2034, 5.6% for GSE1456-GSE7390, and 5.2% for GSE7390-GSE6532); in 4 others, it delivers compatible performance; and in 1 test case, it delivers poorer performance. Other methods are less consistent in the improvements they provide. NetCover, for example, delivers improved performance in 6 of the 12 test cases (5.7%, 4.3%, 2.0%, 7.2%, 8.5%, 9.1%) and poorer performance in the remaining 6 (-4.9%, -1.3%, -10.6%, -12.5%, -10.5%, -11.7%), as compared to individual gene features.

Overall performance of different composite feature identification algorithms. Average of (
Search Criterion, Rather than Search Algorithm, Plays a Key Role in Composite Feature Identification
Besides their difference in how they combine genes together to identify composite gene features, feature identification algorithms also differ in terms of the statistical criteria they use to assess the collective dysregulation of gene sets. GreedyMI uses mutual information to quantify the statistical dependency between aggregate gene expression and the phenotype. On the other hand, the Linear Path algorithm is based on t-test statistics, which measures the difference between gene expressions in two phenotypes. Clearly, these two criteria are closely related, and we can expect to see a strong correlation between them. In order to empirically assess how these two measures are related to each other, we focus on the GSE2034 dataset. For every gene in this dataset, we compute mutual information of expression with phenotype, rank all genes according to mutual information, and select the top 1000 genes with maximum mutual information. Subsequently, we compute the average mutual information and t-test score of top k genes (k = 100, 200, …, 1000). The resulting numbers are shown in Figure 4A. As can be seen in the figures, these two measures are indeed highly correlated. Similar observations can be made for other search criteria, eg, chi-square statistic or information gain. Indeed, for the NetCover algorithm, mutual information is proven to be a monotonic function of sample cover, the search criterion used by the NetCover algorithm. 16
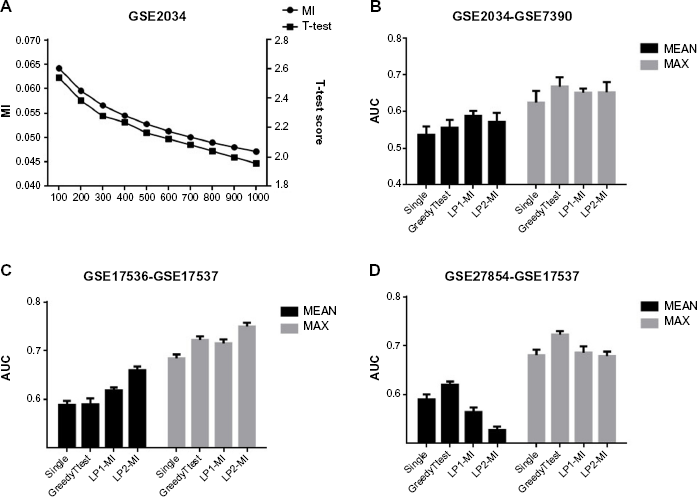
Impact of search criterion on prediction performance. (
Given the observation that the search criteria employed by different methods are usually correlated, an interesting question is whether different search criteria employed by these methods affect the performance despite the apparent correlation. In order to answer this question, we focus on three test cases, in which we observe considerable performance gap between features identified with GreedyMI, LinearPathl and LinearPath2. We modify the GreedyMI feature identification method to create a hybrid feature identification method. Instead of searching for gene sets to maximize the mutual information, we search for genes to maximize the t-test score. We call this algorithm GreedyTtest. Similarly, for the linear path-based algorithms, we replace t-statistic with mutual information to create two other hybrid algorithms, named LP1-MI and LP2-MI. We then compare these three hybrid algorithms to understand whether it is the search algorithm or search criterion that underlies the superiority of a set of features on another set of features. Surprisingly, we observe that changing the search criteria can alter the performance results for search algorithms. Namely, for the test cases involving GSE2034-GSE739 and GSE17356-GSE17357, although our previous results show that the GreedyMI delivers much better performance compared to LP1 and LP2, after switching the search criteria, LP1-MI and LP2-MI achieve a higher AUC value than GreedyTtest. For the test case involving GSE27854-GSE17537, however, we do not observe this change. Therefore, the search criterion (scoring function) appears to have a significant impact on classification accuracy of some datasets.
Probabilistic Inference of Feature Activity Improves Predication Accuracy
In all the experiments presented so far, feature activity is computed by averaging the expression value of all the genes in the gene set that comprises the composite feature. The idea of probabilistic inference is similar, but instead of using gene expression directly, one transforms the gene expression to LLR between the two phenotypes of interest for each gene. Subsequently, the feature score is computed by averaging the LLRs for all genes in the set comprising the feature. Transformation from gene expression requires estimation of the conditional PDF for each gene in two phenotypes. To estimate the PDF for each phenotype, we assume that the gene expression for each phenotype follows a Gaussian distribution with mean and standard deviation of all gene expression values corresponding to that phenotype. For feature extraction, we first transform the whole dataset to LLR and we use the feature identification algorithm as is. During cross-validation, we use only the four folds comprising the training data to estimate the PDF and then transform all five folds to LLR based on the PDF estimated using the training set. In order to compare the performance of probabilistic inference with average gene expression, we perform the same set of tests and compute the average AUC and maximum AUC values across 12 test cases for all feature identification methods. The results of this analysis are shown in Figure 5A and 5B. Surprisingly, as seen in the figure, the average AUC value is improved significantly for all feature extraction algorithms except for GreedyMI. The maximum AUC value, on the other hand, does not show any significant difference.

Performance comparison between aggregate activity and probabilistic inference of feature activity. Average of (A) average and (B) maximum AUC values across 12 test cases for each algorithm is shown for the two different methods used in feature activity inference.
Current Feature Selection Techniques are Limited in Terms of Optimizing Classification Performance
Simple filtering method for feature selection depends on a certain scoring criterion to rank the features. In this study, we use the P-value of t-test as the ranking criterion. In order to see whether different ranking criteria have impact on the classification performance, we repeat the same experiments with features ranked with mutual information and chi-square test score (Supplementary Fig. 2). We indeed observe that there are differences between different ranking methods, and some of these differences are notable. However, none of the ranking criteria provide consistent improvement in classification accuracy over other criteria. Therefore, in the following, we use P-value of t-test as the ranking criterion.
Beside the simple filtering method, we also consider more sophisticated feature selection methods, namely, MRMR and SVM-RFE. MRMR is a multivariate filter-based feature selection algorithm. It ranks the features by relevance score minus the redundancy score. Here, we use t-test score and correlation coefficient to respectively quantify these two criteria. Similar to our previous experiments, we select the top 50 features and compute the average AUC and maximum AUC values. The results of these experiments are shown in Figure 6. As seen in the figure, while MRMR delivers similar results to simple filtering, SVM-RFE leads to degraded classification performance.

Performance comparison of feature selection algorithms in selecting composite gene features. (
The results presented above suggest that there is big gap between average and maximum AUC values that can be provided by considering the top 50 features as the candidate features for selection. One question that naturally arises from this observation is whether there is an optimal number of candidate features that should be considered for selection to optimize classification accuracy. Usually, for a classification problem, accuracy increases with increasing number of features until it reaches a peak value. Therefore, it would be fairly easy in principle to determine the number of features required to achieve optimal performance; however, we do observe this expected pattern for neither individual gene features nor composite gene features (Supplementary Fig. 3A). Consequently to determine a global Kmax (the number of features needed to obtain optimal performance), we plot a histogram of all optimal K (number of features that result in peak performance in a specific test case) for all of our test cases, and we obtain the global Kmax by selecting; the K value with the highest frequency (Supplementary Fig. 3B). Using this global number of features (Kmax = 1 for individual gene features, Kmax = 6 for GreedyMI), we apply tests on 12 test cases, and we plot the resulting AUC value together with the average and maximum AUC values provided by the top 50 features so as to obtain a direct comparison. As seen in Figure 7A, for individual gene features, in 6 out of all 12 tests where with feature selection was applied, the AUC value is lower than the average AUC value; for the other six tests, it is either close to or slightly higher than average AUC value. On the other hand, for GreedyMI features, feature selection leads to a better AUC value than average for all the 12 test cases.

Comparison of forward selection and filter-based feature selection. Performance of (
Another method for feature selection is sequential selection, which is one of the most commonly used methods in literature. Starting with an empty (no features selected) or full (all features selected) model, this method adds (forward selection) or removes (backward selection) features based on the classification performance of the validation set. In order to apply the sequential feature selection, we further partition the training data (four out of five folds) into a training set and a validation set. Subsequently, we use forward selection on the training set to select a locally optimal set of features based on cross-validation within the training set. The results of forward selection are shown in Figure 7B. As seen in the figure, for both individual gene features and GreedyMI features, forward feature selection is able to achieve slightly better results than average AUC value of top 50 features in all 12 test cases.
Discussion and Conclusion
In this study, we comprehensively evaluate the prediction performance of four network-based and two pathway-based composite gene feature identification algorithms on five breast cancer datasets and three colorectal cancer datasets. In contrast to all the previous individual studies, we do not identify a particular composite feature identification method that can always outperform individual gene-based features in cancer prediction. However, this does not necessarily mean that composite features do not add value to improving cancer outcome prediction. We actually observe some significant improvement in some cases for certain composite features. These results suggest that the question that needs to be answered is why we observe mixed results and how we can consistently obtain better results.
There are several issues that could potentially contribute to the inconsistencies in the performance of composite gene features. First, the algorithms for the identification of composite features are not able to extract all the information needed for classification. For NetCover and GreedyMI, greedy search strategy is used to search for subnetworks, and as it is known, greedy algorithms are not guaranteed to find the best subset of genes. Also, our results show that search criteria (scoring functions) employed by feature identification methods play an important role in classification accuracy. While certain datasets favor mutual information, others may have better classification accuracy if t-statistic is used as the search criterion. Another potential issue that may have led to mixed results is the inconsistency (or heterogeneity) among datasets that are in principle supposed to reflect similar biology. As the results presented in Figure 3 clearly demonstrate, for two datasets (GSE27854 and GSE17536), none of the composite features is able to outperform individual gene-based features.
One possible explanation for the inconsistency between datasets is the systematic difference between the biology of samples across different datasets. These may include factors such as different subtypes that involve different pathogeneses, age of the patient, disease stage, and heterogeneity of the tissue sample. For example, for breast cancer, there are multiple ways to classify the tumor, eg, ER positive vs. ER negative or luminal, HER2, and basal. 27 Furthermore, samples used for classification are categorized based on different clinical standards. Specifically, for our datasets, the two phenotype classes are metastatic and metastasis-free, or relapsed and relapse-free. The sample phenotype is determined based on the clinical status of the patient at the time of survey. For some patients, this is done 10 years after surgery, whereas for others, it may be only one year or even several months after surgery. Therefore, depending on how the study is designed, there may be a considerable number of miscategorized samples for some datasets.
Besides the inconsistent performance improvement provided by composite gene features, the overall classification performance obtained is not impressive. Overall, the average maximum AUC value that can be obtained is around 70% across all test cases. In this study, we find out that some techniques may improve prediction performance, such as probabilistic inference of feature activity. This observation suggests that there is indeed potential to improve the performance of composite gene features based on PPI networks, since most of the current studies for feature activity inference are focused on pathway features. We also compare several feature selection techniques in terms of their performance in improving accuracy; however, there seems to be no significant benefit provided by any feature selection algorithm.
Author Contributions
Conceived and designed the experiments: DH, MK. Analyzed the data: DH. Wrote the first draft of the manuscript: DH. Contributed to the writing of the manuscript: MK. Agree with manuscript results and conclusions: DH, MK. Jointly developed the structure and arguments for the paper: DH, MK. Made critical revisions and approved final version: DH, MK. Both authors reviewed and approved of the final manuscript.
Supplementary Materials
Footnotes
Acknowledgement
This manuscript is based on research conducted and presented as part of the Master of Science thesis of Dezhi Hou at Case Western Reserve University.