
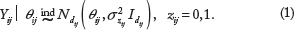
Abstract
Computed tomography perfusion (CTp) is an emerging functional imaging technology that provides a quantitative assessment of the passage of fluid through blood vessels. Tissue perfusion plays a critical role in oncology due to the proliferation of networks of new blood vessels typical of cancer angiogenesis, which triggers modifications to the vasculature of the surrounding host tissue. In this article, we consider a Bayesian semiparametric model for the analysis of functional data. This method is applied to a study of four interdependent hepatic perfusion CT characteristics that were acquired under the administration of contrast using a sequence of repeated scans over a period of 590 seconds. More specifically, our modeling framework facilitates borrowing of information across patients and tissues. Additionally, the approach enables flexible estimation of temporal correlation structures exhibited by mappings of the correlated perfusion biomarkers and thus accounts for the heteroskedasticity typically observed in those measurements, by incorporating change-points in the covariance estimation. This method is applied to measurements obtained from regions of liver surrounding malignant and benign tissues, for each perfusion biomarker. We demonstrate how to cluster the liver regions on the basis of their CTp profiles, which can be used in a prediction context to classify regions of interest provided by future patients, and thereby assist in discriminating malignant from healthy tissue regions in diagnostic settings.
Keywords
Introduction
Functional imaging techniques have been progressively used in oncology to improve tumor detection, characterization, staging, prognosis, and treatment of cancer patients. 1 In particular, computed tomography perfusion (CTp) has recently emerged as a widely available, inexpensive and noninvasive, imaging technique to evaluate changes in tumor vascular physiology and tumor biology. CTp can potentially lead to biomarkers for tumor characterization, as well as for early assessment of therapeutic response in multiple cancers.2,3 Any modern CT scanner system can perform CTp: a small bolus of iodine-based intravenous contrast is injected rapidly over a target region, and repeated images are taken at regular frequent time points before, during, and after the passage of the contrast agent through the tumor vasculature. Hence, this dynamic acquisition allows to measure temporal changes in tissue density after injection with the contrast agent. Tissue perfusion can then be estimated in the target region through the use of different kinetic models. 4
The importance of assessing tumor perfusion and vascular permeability is related to their association with tumor angiogenesis, ie, the formation of new blood vessels, in several tumors.5–8 Neovascularization is considered an important process in cancer progression and tumor growth. For example, high tumor angiogenesis activity has been often associated with distant metastases and adverse clinical outcomes.9–11
The angiogenic vasculature of malignant solid tumors is usually characterized by dense, dilated, and tortuous microvessels. In particular, blood volume (BV) and blood flow (BF) are higher in malignant tumors due to the proliferation of new blood vessels through the process of tumor angiogenesis.12,13 Therefore, it has been suggested that perfusion imaging can yield biomarkers of angiogenesis and tumor growth and thereby greatly enhance the clinical development of antiangiogenic therapies. This is because changes in tumor perfusion appear to occur soon after therapy initiation with antiangiogenic drugs.14–16
CTp parameters are commonly calculated after the scan session by using commercially available postprocessing software platforms (CT Perfusion 4, version 4.3.1, Advantage Windows 4.4; GE Healthcare). Typical CTp parameters include BF (mL/100 g/minute), BV (mL/100 g), mean transit time (MTT, seconds), and permeability surface area product (PS, mL/100 g/minute), which are obtained using standard deconvolution physiological modeling, based on the central volume principle (BF = BV/MTT) first described in the context of cerebral perfusion.17,18 PS is a measure of capillary permeability and it reflects the flux of solutes from blood plasma to the interstitial space. 19 As an illustration, Figure 1 reports the time course of the PS parameter observed during the imaging session for two representative normal and tumor regions of interest (ROIs) in a single patient. The disruption and decline in PS values within the first 100 seconds of the scan in Figure IB are usually the result of neoangiogenesis and microvascular attenuation.

Illustrative plot of the observed measurements on the PS perfusion characteristic in two ROIs for a representative patient, as a function of scan time, zoomed in the first 100 seconds of the scan: (A) normal tissue and (B) tumor tissue.
The trajectory of the perfusion parameters over the scan period can be affected by many factors, which may pertain to patient and tumor characteristics. For example, in squamous cell carcinoma, BF and PS values have been shown to be significantly higher in subjects with longer local tumor control than in subjects with local recurrence.
20
This consideration highlights the heterogeneity of the perfusion parameter-time curves both between ROIs within a patient as well as between patients, in addition to the fact that the temporal resolution and duration of the CT acquisition can also impact the CT perfusion parameter values.21,22 Yet, heretofore, the clinical implications that have been
In this manuscript, we consider a functional data analytic approach
24
and assume that the observations collected on each CTp parameter during the scan period are a realization, up to a measurement error, of an underlying perfusion process. The corresponding
Bayesian hierarchical models and Dirichlet Process (DP) mixtures have been successfully exploited to represent functional curves, eg, clustering spline coefficients in Bayesian multivariate adaptive regression splines models. 29 In computer modeling 30 and machine learning, 25 Gaussian process realizations are often used as a basis to model random functions. 31 Finite mixtures and Dirichlet process mixtures of Gaussian processes have also been proposed to model a sample of curves, possibly encoding complex spatiotemporal or covariate dependencies.32–37
With respect to those contributions, the method we propose for the analysis of functional CTp responses takes explicitly into account prior information about the perfusion imaging experiment and the vascular physiology of normal and tumor tissues. Because the time course mappings of CT perfusion parameters are expected to stabilize some time after injection of the contrast agent, in order to obtain a reliable quantification of the perfusion characteristics, 21 our proposal accommodates change-points in the distribution of the functional responses over time, namely, in their temporal covariance structure. Moreover, since the perfusion time courses may vary across tissue types, we also allow for distinct change-points in the curves characterizing the normal and tumor tissues.
In addition, we demonstrate how to use the results from the posterior inference obtained from our Bayesian modeling framework to characterize ROIs from future patients as malignant tumor tissues to reflect diagnostic clinical settings. The classification is based on posterior predictive computations and the use of the Bayes factor, which weights the evidence in the data for the tested hypotheses. 38 More specifically, we describe how the classification can be conducted by compounding the contribution of time courses from multiple perfusion parameters. Figure 2 summarizes the main features of our contribution.

General scheme of our modeling framework and inferential objectives.
The remainder of the manuscript is organized as follows. The “Methods” section describes the details of Bayesian nonparametric approach. Methods for posterior inference and classification are succinctly described in “Gaussian processes with varying autocorrelation” and “Posterior inference” sections. In the “Results” section, we describe the posterior and clustering results for analysis of tissue permeability in a sample of 16 patients with neuroendocrine liver metastases. We also provide an illustration of the classification performance of our algorithm on the basis of two studies: one aimed at comparing the predictive ability of our model with respect to commonly used classifiers in our small dataset, and a more comprehensive simulation study that further illustrates its general properties. We provide some concluding remarks in the “Discussion” section.
Methods
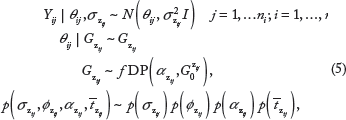
Bayesian mixture for modeling the heterogeneity of CTp characteristics
Without loss of generality in this section, we detail our modeling strategy for a single perfusion characteristic. More specifically, let
Following the typical functional data analysis framework,
24
we envision that for either the normal or tumor tissue, the CTp responses can be formally described by the following model,

Arguably, the inferential interest often pertains to the modeling of the mean vector θ . A typical assumption specifies θ
 . The vector of observed CTp parameter values can then be described by the following location mixture of Gaussian densities,

where, for notational simplicity, we have used the symbol
Functional Dirichlet process priors
We follow a Bayesian nonparametric approach and further assign a prior probability to the mixing distributions 

Gaussian processes with varying autocorrelation
We further take  , where θ0 may be either known (eg, a constant function) or itself assigned a prior. In the following, we assume θ0 ~
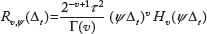
In order to obtain a reliable quantification of the perfusion characteristics, since the perfusion values are expected to show low autocorrelation soon after injection of the contrast agent, but subsequently they become more stable and highly correlated,
21
we allow for changes in the correlation structure of the process over time. More specifically, we assume that the decay parameter in the correlation function may vary with time. Mathematically, we could describe these changes as different states 

Posterior inference
Lai and Xiang
45
have recently considered a simple Bayesian model for multiple parameter changes in a multiparameter exponential family, developing explicit formulas for the estimators of the change-points. Our Dirichlet process formulation does not allow the use of the formulas of Lai and Xiang. Thus, we rely on a Markov chain Monte Carlo (MCMC) algorithm to obtain samples from the posterior distribution of the parameters of interest and conduct posterior inference. In this section, we provide a very brief description of the basic steps of the MCMC algorithm. Since perfusion parameters can be acquired at different time points across patients, we start by considering the union set of all observed time points. We then treat the values of the perfusion parameters at the times not observed as missing at random.46,47 Following the standard Bayesian approach,
48
we impute the missing values within each MCMC iteration by drawing from the relevant posterior predictive distributions conditionally on the observed data and the currently sampled values of the parameters. Due to the normality and conjugacy of the model, the corresponding posterior predictive distribution is multivariate normal. More precisely, let
Sampling the canonical curves
Updating the change point
Updating the covariance parameters
The updates of the other model parameters are standard.
52
For example, the full conditional of θ0 is multivariate normal and that of σ
2
is an inverse gamma. The update of
The posterior samples so obtained can be used to provide posterior estimates of the parameters of interest, as well as highest posterior credible intervals. For example, the MCMC sample average provides an ergodic estimate of the posterior expected value of a parameter. Let
Classification via Bayes factors
We can use the information obtained from posterior inference to classify new observations, eg, from ROIs for which the tissue class is heretofore unknown. Let 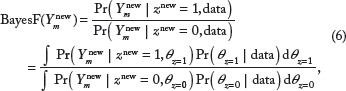
For clinical purposes, the classification of targeted ROIs shall rely on the Bayes factor computed either on a single perfusion characteristic (eg, blood flow) or from a combination of the perfusion characteristics, eg, only those which have been previously found in the literature to be associated with angiogenesis and tumor growth. For 
Results
A case study from patients with neuroendocrine liver metastases
In this section, we apply our Bayesian nonparametric approach to a retrospective clinical study. Both our study and the retrospective clinical study were approved by the MD Anderson Institutional Review Board (IRB). The study included 16 patients (6 men and 10 women) with metastatic neuroendocrine tumors who received optional CT perfusion imaging between April 2007 and September 2009 as part of two IRB approved clinical trials. CT perfusion was performed for a target lesion in the liver, which was clinically or radiologically determined to be malignant. Images were obtained with a 64-row multidetector CT scanner (VCT; GE Healthcare) and with acquisition time of 12–590 seconds.
21
We consider the time courses of four perfusion characteristics, as follows: BF, BV, MTT, and PS. The measurements were obtained on 27 separate ROIs in liver metastases and 25 separate ROIs in normal liver tissue. More specifically, for each of the eight axial slice locations of each dataset, a liver tumor ROI was drawn free hand around the periphery of the primary target lesion, using an electronic cursor and mouse, with reference to the source cine CT images and perfusion parametric maps, displaying the images at soft tissue windows (width = 350 HU, level = 40 HU). Wherever possible, a second tumor ROI was delineated, provided it was greater than 1.5 cm in diameter. ROIs were placed in the abdominal aorta and in the portal vein on the source images to provide these vascular inputs. Refer to Ref. 21 for more details. In this section, we illustrate the results of our analysis for the time courses of the PS characteristic, since PS values have been previously associated with the markers of angiogenesis.
54
More specifically, we apply model Equation (5) to a normalizing log-transformation of the PS perfusion values, and then perform posterior inference as described in the “Posterior inference” section. The log scale is frequently used in CT perfusion analysis to adjust for conditionally asymmetric residual error at a given acquisition time and to alleviate the effect of heteroskedasticity as a function of time. In terms of prior choices, we assume that the mean of the base
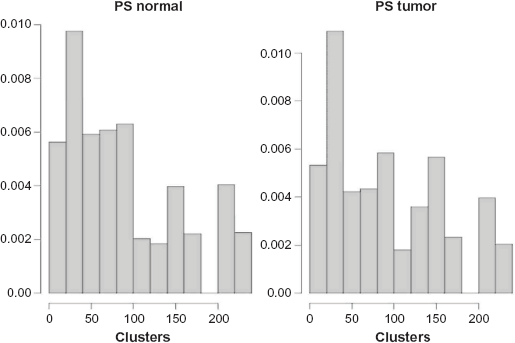
Figure 3 displays the posterior distributions of the number of clusters for the normal (left panel) and the tumor liver tissue (right panel). In both cases, the posterior is characterized by high variance and long tails. However, the modal number of clusters is estimated around 5 in the normal tissue and 6 in the tumor tissue type. Hence, we may conclude that there is evidence of heterogeneous clustering patterns among the CT perfusion time courses. The MCMC algorithm typically samples possibly different cluster configurations at each iteration. Several methods have been used in the literature to obtain a single-point estimate of clustering draws from the posterior distribution.55,56 In the following, we consider the maximum a posteriori (MAP) estimate. The MAP clustering is the clustering estimate that maximizes the posterior density.

Posterior of the number of clusters of PS time courses for the normal (left) and tumor (right) liver ROIs.
Figure 4 (top) displays a cubic spline interpolation of the original PS values, with different colors to highlight the different MAP clusters. In both normal and tumor samples, the clusters appear to represent different time course trajectories, either because of their behavior within the first 300 seconds of acquisition or because of the resultant level that they achieve at the end of the scanning period. Figure 5 shows the posterior distribution of the change point in the covariance structure of the CT perfusion values. It is well known that for many of the correlation functions typically used for Gaussian processes, the decay parameters are only weakly identifiable.57,58 Accordingly, the posterior distribution of the change-points is quite diffuse. Nevertheless, one can recognize a mode within the first 100 seconds of the acquisition time. More specifically, the posterior expectation is 89.6 seconds (67.8 SD) for the normal tissue and 93.6 seconds (68.4 SD) for the tumor tissue. These values reflect the heteroskedasticity patterns typically observed in CT perfusion values.

Posterior clustering: cubic spline interpolation of the observed log-PS values, color coded according to the MAP estimate for normal tissue type (left) and tumor tissue type (right).
Posterior distribution of the change point in the correlation structure of log PS values for the normal (left) and tumor (right) liver tissues.
Classification performance
In order to assess the classification performance of our Bayesian nonparametric modeling approach, we devise two different strategies. First, we consider the dataset analyzed in “A case study from patients with neuroendocrine liver metastases” section and we select one normal and one tumor curve for each of the 16 patients. We then use formula (6) to classify the selected curves either as normal or tumor, separately for each perfusion parameter. Ng et al. 21 have recently discussed the minimal acquisition duration that is necessary to attain stability and good quantification of the CT perfusion parameter values. There is clear motivation to reduce the overall duration of CT acquisition to the shortest time possible to reduce radiation exposure without compromising quantification of the CT perfusion parameter values. A few studies have suggested that acquisition times of 30–60 seconds might be satisfactory for some of the CT perfusion parameters.59,60 However, Ng et al. 21 suggest that for most parameters stabilization with moderate confidence is attained only between 220 and 360 seconds of acquisition. Those studies did not address the predictive ability of the measurements collected over the different acquisition times to discriminate between tissue types. For this reason, in the following, we will evaluate the predictive ability of observations collected over 30–100 seconds in addition to the full-time courses over the complete 590 seconds of acquisition duration.
For comparison, we also implement the commonly used classifiers, linear discriminant analysis (LDA), quadratic discriminant analysis (QDA), and support vector machine (SVM) algorithms. LDA assumes that the measurements from each class are normally distributed with the same variance-covariance matrix for both tumor and normal tissues, whereas QDA relaxes the homoskedasticity assumption. As these classifiers require the same number of time points for each observation, we first fit cubic spline interpolations to the data in order to be able to evaluate all the classifiers on the same acquisition intervals. This is particularly true for the PS and the BF parameter, which is consistent with previous literature. The discriminant analysis techniques (run after curve interpolation) do not appear to perform consistently well, especially when using the first 30–100 seconds of the acquisition scans. This is particularly relevant considering that higher acquisition duration would require high overall radiation exposures.
Table 1 shows the true negative and true discover rates for the prediction of normal and tumor curves, separately for the four CT perfusion parameters. The BNP method we propose generally seems to perform better than the alternative methods in most cases.
Prediction true negative (normal) and true discover (tumor) rates using LDA, QDA, and the proposed BNP between 30–100 seconds and 0–590 seconds.

To further test our classification method, we also devise a simulation strategy where we consider a larger dataset, obtained by generating 1,000 distinct time courses for each of the four CT perfusion parameters, as follows. First, we obtain spline interpolations of the observed time courses in the liver metastases case study considered in “A case study from patients with neuroendocrine liver metastases” section. The spline interpolations are fit using the R package spline on each of the 52 curves and for each of the four characteristics. 61 Then, we select one of the 52 original observations by sampling with repetition, separately for each characteristics. A new time course is generated as a draw from a multivariate normal distribution with the selected interpolation as the mean and a diagonal covariance matrix, with variance η 2 . This simulation scheme allows us to evaluate the effect of the noise η 2 on the prediction and also to more accurately assess the asymptotic performance of our classifier under multiple realizations of the generating models.
Tables 2 and 3 report the results of the classification for varying degrees of the noise η
2
η
2
= 0.1, 0.2, 0.5) using the first time frame of 30–100 seconds of acquisition duration and the full scanning period, respectively. The column corresponding to
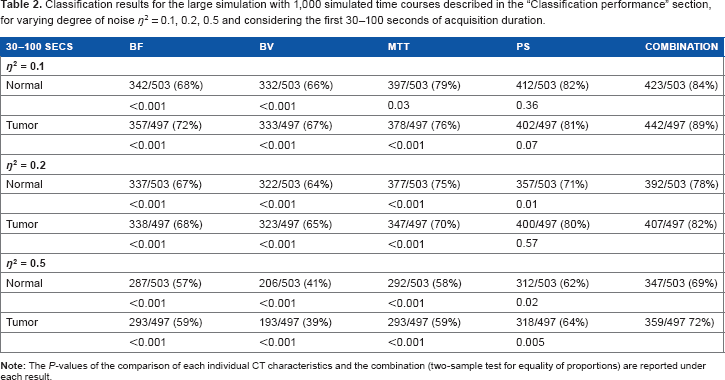
Classification results for the large simulation with 1,000 simulated time courses described in the “Classification performance” section, for varying degree of noise η 2 = 0.1, 0.2, 0.5 and considering the first 30–100 seconds of acquisition duration.
Classification results for the large simulation with 1,000 simulated time courses described in the “Classification performance” section, for varying degree of noise η 2 = 0.1, 0.2, 0.5 and considering the full acquisition duration.

Discussion
With the advances of the contrast-enhanced functional imaging technology, the development of noninvasive perfusion imaging biomarkers for tissue characterization, cancer prognostication, and detection has emerged as an area of recent focus in clinical cancer research. Moreover, these imaging features have the potential to enhance quantitative evaluations for measuring therapeutic response to antiangiogenic treatment strategies. Future endeavors to further develop and translate this technology should rely on appropriate analytical models for characterizing the multiple sources of variance that are inherent to the acquisition and measurement of temporal changes in contrast enhancement obtained from dynamic CT.
In this article, we presented a Bayesian nonparametric functional analytic approach for the analysis of CT perfusion time courses, which allows for heterogeneity observed across patients and tissues, by clustering the measurements of perfusion characteristics into groups characterized by similar temporal behavior. Our approach takes explicitly into account prior information about the perfusion imaging experiment and the vascular physiology of normal and tumor tissues, by accommodating change-points in the temporal covariance structure of responses over time in order to appropriately describe the temporal heteroskedasticity observed in such measurements. We demonstrate how our approach can lead to improved performance with respect to commonly used classification methods for classifying ROIs in future patients, especially when considering the typical length of acquisition times. Therefore, our approach can assist in discriminating malignant from healthy tissue regions in diagnostic settings.
The clinical study was limited only to metastases to the liver from a specific tumor (metastases arising from neuroendocrine tumors) and consisted of a relatively small number of patients. The extent to which the conclusions of our case study might be generalizable to other tissues and tumors requires future exploration. However, we expect that the proposed methodology for functional data classification is generalizable to any perfusion study. Our data were obtained using a specific acquisition protocol based on relatively high temporal sampling initially (in the first 30s), and more sparsely sampled data in its second phase (out to 590s). While one would not expect more widely spaced temporal sampling in the second phase to have substantial impact on analyses, an ideal dataset might be the one that was acquired at a high temporal sampling in the second phase as well. However, obtaining such data would require high overall radiation exposures and present practical challenges in acquisition because of the constraints of breathing motion and registration.
Furthermore, we should note that our study does not characterize treatment-induced changes in the perfusion values. Using data from a larger randomized clinical trial, the clustering detection could be informed by treatment information, eg, by using an ANOVA-dependent Dirichlet process. 62 Finally, our modeling formulation is more computationally demanding than competing approaches. While our extensive simulation studies suggest that computations do not slow down substantially for datasets comprising a few hundred patients’ samples, for larger datasets, computational speed could be improved through the use of variational Bayes approaches. 63 The precision of the classification, when considering the full acquisition duration, is dramatically decreased, as presented in Table 3. Scarpa and Dunson 64 have recently proposed enriched stick-breaking processes for functional data, which enable incorporation of prior information about attributes of the curves in the classification. A similar feature selection-based strategy could be used to guide the classification of the curves so that specific characteristics of each perfusion parameter are taken into account and/or relevant portions of the time courses can contribute to the inference more than others.
Additionally, while our framework considered ROI-level inference, which is perhaps most prevalent in clinical practice, the methodology could be adapted to accommodate voxelwise analysis following image registration. The methods, when implemented in this context, could be leveraged to create spatial-temporal posterior probability maps, providing diagnostic tools that could potentially be used to enhance existing tumor segmentation approaches.
Author Contributions
Conceived and designed the experiments: CSN. Analyzed the data: KMF Wrote the first draft of the manuscript: MG. Contributed to the writing of the manuscript: KMF, MG, BH, CSN, MV. Agree with manuscript results and conclusions: KMF, MG, BH, CSN, MV. Jointly developed the structure and arguments for the paper: MG, BH, CSN, MV. Made critical revisions and approved final version: MG, BH, CSN, MV. All authors reviewed and approved of the final manuscript.