Ovarian cancer (OC) is a leading cause of cancer mortality, but aside from a few well-studied mutations, very little is known about its underlying causes. As such, we performed survival analysis on ovarian copy number amplifications and gene expression datasets presented by The Cancer Genome Atlas in order to identify potential drivers and markers of aggressive OC. Additionally, two independent datasets from the Gene Expression Omnibus web platform were used to validate the identified markers. Based on our analysis, we identified FXYD5, a glycoprotein known to reduce cell adhesion, as a potential driver of metastasis and a significant predictor of mortality in OC. As a marker of poor outcome, the protein has effective antibodies against it for use in tissue arrays. FXYD5 bridges together a wide variety of cancers, including ovarian, breast cancer stage II, thyroid, colorectal, pancreatic, and head and neck cancers for metastasis studies.
Ovarian cancer (OC) represents one of the leading causes of cancer mortality, exhibiting a five-year survival rate of 44%.1 The serous ovarian cancer (SOC) high-grade subtype is one of the most aggressive and metastatic forms of cancer.2 A number of previous studies focused on identifying the major genetic events that characterize and drive OC.3–5TP53 mutations, CCNE1 amplifications, and BRCA1/2 (and associated homologous recombination pathway) aberrations along with a few highly recurrent mutations or pathways have been observed to be associated with tumorigenesis in SOC.2,6
The need to better characterize the molecular genetics driving and accelerating OC have paved the way for large-scale studies with big cohorts profiled by a number of different omics technologies. One such study, The Cancer Genome Atlas (TCGA), profiled 572 different SOC tumors with RNA-Seq, Gene Expression Microarray, SNP 6.0 (copy number), and a number of other different platforms in addition to capturing clinical endpoints.6 A breakdown of the key characteristics of the SOC study cohort is shown in Table 1. The large sample size is especially important as cancer is recognized as being a heterogeneous disease, and thus finding drivers or genes playing a role in aggressiveness in a fraction of tumors is severely limited by small cohorts.
SOC TCGA study cohort information.
FACTOR
GROUP
VALUE
Age at initial pathologic diagnosis
Min.
26
1st Qu.
51
Median
59
Mean
59.68
3rd Qu.
68
Max.
89
Anatomic neoplasm subdivision
Not available
32
Bilateral
396
Left
79
Right
66
Clinical stage
Stage IIIC
407
Stage IV
86
Stage IIIB
24
Stage IIC
20
Stage IC
10
Stage IIIA
8
Other
18
Neoplasm histologic grade
Not available
3
G1
6
G2
69
G3
484
G4
1
GB
1
GX
9
Race
Not available
32
American indian or alaska native
3
Asian
19
Black or african american
24
Native hawaiian or other pacific islander
1
White
494
Tumor residual disease
Not available
61
>20 mm
105
1–10 mm
253
11–20 mm
37
No macroscopic disease
117
Vital status
Not available
3
Alive
272
Dead
298
The goal of this analysis was to determine genes whose expression and copy number changes associated with survival in SOC, even if the relative subset of patients was a small percentage. To this end, we initially used the TCGA SOC data to determine relevant survival-associated genes and then confirmed our discoveries with additional similar datasets available in the public domain. Results point to copy number amplification (CNA) and elevated gene expression levels of FXYD5 to be markers of poor survival in SOC.
Materials and Methods
Data Acquisition
TCGA SOC Affymetrix Human Genome U133A microarray gene expression data were obtained from TCGA Data Portal by using the Data Matrix method (https://tcga-data.nci.nih.gov/tcga/tcgaDownload.jsp). TCGA copy number data were collected with the help of the Cancer Genomics Data Server R (cgdsr) package (version 1.1.30) in R (version 2.15.3). Using a tool developed at MD Anderson Cancer Center, it was verified that the expression and copy number data did not suffer from significant batch effects (http://bioinformatics.mdanderson.org/tcgambatch/). The Vienna OC dataset (GSE49997), profiled on ABI Microarray version 2, was acquired for validation from the Gene Expression Omnibus (GEO) using the GEOquery (version 2.13) package in R. Also for further validation, the Mass General Hospital (MGH)'s high-grade SOC expression dataset (GSE18520), profiled on the Affymetrix Human Genome U133 Plus 2.0 Array, was selected from NCBI's Entrez GEO DataSets database.
Statistical Analyses
Survival analysis was performed on TCGA's copy number and expression data using the Mantel–Haenszel log-rank test and Cox proportional hazard regression in the Survival package (version 2.37–7) of R. As copy number and expression values are continuous variables, we incorporated a scanning approach to the Kaplan–Meier method by moving samples between the two groups to define the best P-value as the breakpoint or separation point R2: Genomics Analysis and Visualization Platform (http://r2.amc.nl). For instance, for a particular gene, the expression values were sorted. Upon sorting, the bottom 5% were assigned to group 1 and the top 95% were assigned to group 2. This step serves to convert this continuous variable into a binary variable for subsequent survival analysis. At this point, the logrank test was run on the two groups (group 1 and group 2), and a P-value was calculated. In the subsequent step, the smallest sample from group 2 was transferred to group 1 and the log-rank test was run again. This moving of samples iteratively continued until group 1 encapsulated the bottom 95% of values and group 2 held the top 5% of values. The lowest P-value was then chosen as the optimal breakpoint of the two groups and reported. A Benjamini–Hochberg correction was performed on all the P-values generated from this scanning approach to reflect the presence of multiple hypotheses testing. Consider, for example, 100 samples of data, one would end up running 91 different log-rank tests for a given gene using this approach. The multiple hypothesis problem grows linearly with the sample size. In the end, both the original and corrected P-values were returned at the optimal breakpoint (lowest P-value) for each gene. At this point, this same exercise was performed using the copy number data for each gene. Although, many times, studies bin copy number data into amplified, deleted, and neutral, this may not accurately reflect the clonal nature of the cancer. Some proportion of the cells in a sample dataset may have high gains, whereas others might have “neutral” copy numbers. The eventual copy number reported then actually represents an average of the clonal populations in the sample, thus hiding a subset with highly amplified copy number. Hence, the rationale for us to treat copy number as a continuous value and use the aforementioned Kaplan-scanning approach. At the end of this step, we had statistics on how the copy number and expression levels of all genes profiled, correlated with survival. Data are not available yet in the literature to track how the copy number profiles for genes change for a patient reflecting how clonal population percentages oscillate.
For our candidate hypothesis selection step, we chose genes having an adjusted P-value < 0.05 in both the expression and copy number analysis, ensuring these genes had correlated expression and copy number data. Visualization of results was performed using ggplot2 (version 0.9.3.1) and VennDiagram (version 1.6.5) packages in R. The procedure was employed for both the discovery (TCGA) and validation datasets (GEO).
Results
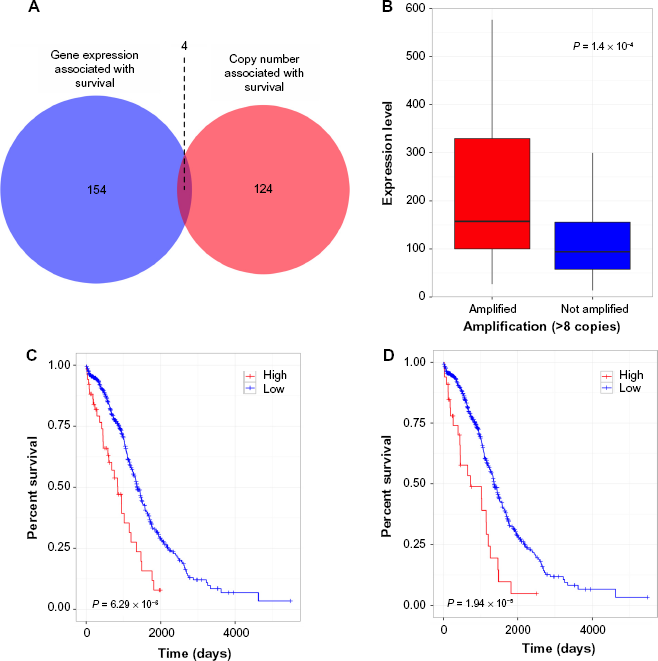
The Kaplan–Meier scan on the copy number identified 128 genes, as associated with survival, meeting the Benjamini–Hochberg corrected P-value < 0.05 cutoff criteria. A similar analysis using the expression data yielded 158 genes. The intersection of these two lists (Fig. 1A) subsumed four genes (Supplementary Table 1). We performed correlation of expression and copy number for each of these genes, as illustrated in Figure 1B for FXYD5, and all genes had copy number changes in line with expression changes.
FXYD5 is a marker for aggressive OC, as determined by the TCGA dataset. Intersection of gene sets with elevated gene expression and elevated copy number (A), Box plot of showing expression versus amplification for FXYD5 (B), and Kaplan–Meier survival curves showing survival based on FXYD5 expression and copy number data, respectively (C, D).
A literature search on the association of the four candidate genes with aggressive forms of cancers pointed to FXYD5 as a potential driver of metastasis in SOC as shown in Table 2. This gene sits within the 19q13 locus, documented to have CNA in SOC.7FXYD5 codes dysadherin, a cancer-linked cell membrane protein known to upregulate chemokine production and downregulate E-cadherin.8 FXYD5 expression has similarly been shown to induce vimentin expression in murine airway epithelial cells.9 Both increased vimentin expression and decreased E-cadherin are causally associated with epithelial-mesenchymal transition, linking FXYD5 with EMT.
Literature references of FXYD5 association with cancer.
CANCER
JOURNAL
REF #
ARTICLE
Thyroid neoplasias
J Clin Endocrinol Metab.
18
Colamaio et al. 2012: Let-7a down-regulation plays a role in thyroid neoplasias of follicular histotype affecting cell adhesion and migration through its ability to target the FXYD5 (Dysadherin) gene.
Breast carcinomas
Cancer Sci.
19
Lee et al. 2012: Dysadherin expression promotes the motility and survival of human breast cancer cells by AKT activation.
Renal cell carcinoma
Int J Cancer.
20
Schuler et al. 2012: Osteoblast-secreted factors enhance the expression of dysadherin and CCL2–dependent migration of renal carcinoma cells.
Fibrous sinovial sarcoma
Arch Pathol Lab Med.
21
Subramaniam et al. 2011: Immunohistochemical study of correlation between histologic subtype and expression of epithelial-mesenchymal transition-related proteins in synovial sarcomas.
Hepatocellular carcinoma
J Hepatol.
22
Park et al. 2011 : Dysadherin can enhance tumorigenesis by conferring properties of stem-like cells to hepatocellular carcinoma cells.
Gastric carcinomas
Hum Pathol.
23
Maehata et al. 2011: Significance of dysadherin and E-cadherin expression in differentiated-type gastric carcinoma with submucosal invasion.
Lung carcinomas
Histol Histopathol.
32
Mitselou et al. 2010: Comparison of the dysadherin and E-cadherin expression in primary lung cancer and metastatic sites.
GIST
Pathol Res Pract.
33
Liang et al. 2009: Dysadherin expression in gastrointestinal stromal tumors (GISTS).
Colorectal carcinomas
Oncology
25
Ochiai et al. 2008: A new formula for predicting liver metastasis in patients with colorectal cancer: immunohistochemical analysis of a large series of 439 surgically resected cases.
Colorectal cancer
Virchows Arch.
26
Batistatou et al. 2006: Expression patterns of dysadherin and E-cadherin in lymph node metastases of colorectal carcinoma
Head and neck squamous carcinoma
Am. J. Surg. Pathol.
27
Kyzas et al. 2006: Dysadherin expression in head and neck squamous cell carcinoma: association with lymphangiogenesis and prognostic significance
Testicular tumors
Br J. Cancer
28
Batistatou et al. 2005: Involvement of dysadherin and E-cadherin in the development of testicular tumours
Non-small cell lung cancer
J. Thorac. Cardiovasc. Surg
29
Tamura et al. 2005: Prognostic significance of dysadherin expression in patients with non-small cell lung cancer
Cutaneous malignant melanoma
Cancer
30
Nishizawa et al. 2005: Clinicopathologic significance of dysadherin expression in cutaneous malignant melanoma: immunohistochemical analysis of 115 patients
Cervical squamous cell carcinoma
Pathol. Oncol. Res.
31
Wu et al. 2004: Prognostic significance of dysadherin expression in cervical squamous cell carcinoma
Tongue cancer
Appl. Immunohistochem. Mol. Morphol.
33
Nakanishi et al. 2004: Prognostic significance of dysadherin expression in tongue cancer: immunohistochemical analysis of 91 cases
Esophageal squamous cell carcinoma
Oncology
34
Shimada et al. 2004: Prognostic significance of dysadherin expression in esophageal squamous cell carcinoma
Gastric cancer
Clin. Cancer Res.
35
Shimada et al. 2004: Clinical significance of dysadherin expression in gastric cancer patients
Thyroid cancer
J. Clin. Endocrinol. Metab.
36
Sato et al. 2003: Dysadherin: expression and clinical significance in thyroid carcinoma
Pancreatic ductal adenocarcinoma
J. Clin. Oncol.
37
Shimamura et al. 2003: Dysadherin overexpression in pancreatic ductal adenocarcinoma reflects tumor aggressiveness: relationship to E-cadherin expression
Breast cancer (stage II)
Proc. Natl. Acad Sci.
38
Ino et al. 2002: Dysadherin, a cancer-associated cell membrane glycoprotein, down-regulates E-cadherin and promotes metastasis
We wanted to investigate further whether FXYD5 was a marker of aggressive SOC, given its known role in cancer. Figures 1C and 1D show the results of the Kaplan–Meier survival analysis using gene expression and copy number, respectively. It is clear from the figures that CNA and elevated expression of FXYD5 independently constitute an effective marker for poor survival. Additionally, Figure 1B shows elevated expression of FXYD5 in the FXYD5 amplified group (>six copies). Comparing the expression levels of FXYD5 in the two groups using the Kolmogorov–Smirnov test, we found a statistically significant difference (P = 0.00014), thus confirming a positive correlation between expression and copy number for FXYD5. A more detailed scatter-plot of FXYD5 copy number levels versus expression levels is included in Supplementary Figure 1.
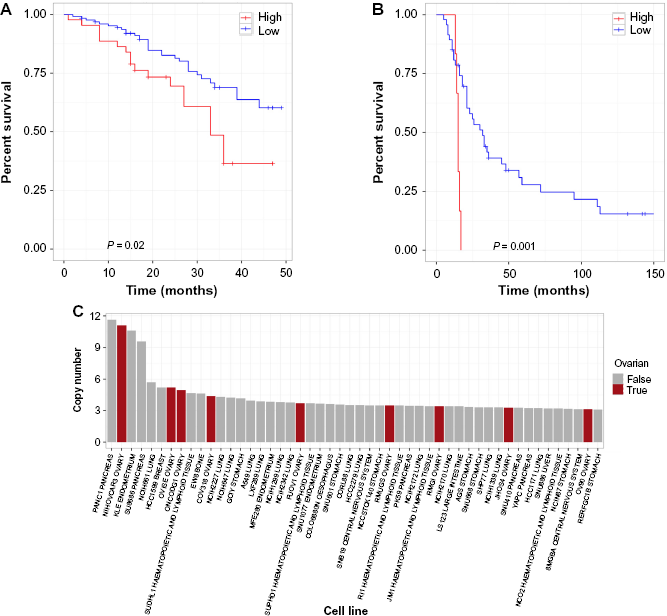
To further confirm our discovery of FXYD5 as a marker for aggressive OC, we performed survival analysis in another OC microarray study (GSE49997), which used a different platform (ABI Microarray version 2) on 204 epithelial OC samples.10 In this dataset, high expression of FXYD5 was again associated with poor outcome at the appropriate significance level (P < 0.05) in the SOC samples (Fig. 2A). Furthermore, using the MGH gene expression microarray dataset (GSE18520), which profiled 53 samples on the Affymetrix Human Genome U133 Plus 2.0 Array, we found again that high expression of FXYD5 was associated with poor survival (P < 0.005, Fig. 2B).11 Note that none of the other three genes, PSMC4, ZFP36, and POLR2I, had a significant association with survival in both of these validation data sets, thus substantiating our decision to pursue FXYD5.
FXYD5 as a marker for aggressive OC. Kaplan–Meier survival curves showing survival based on FXYD5 expression of GSE49997 and GSE18520 microarray datasets (A, B). Waterfall plot showing top 50 CCLE lines ranked by FXYD5 copy number (C).
To validate the clinical utility of FXYD5 expression in SOC, we also performed a multivariate analysis on our original TCGA dataset taking into account race, lymphatic invasion, tumor residual disease, and stage. Age (originally included) was taken out by stratification because it was not a constant hazard, and thus violated certain assumptions of the analysis. FXYD5 expression was still significantly associated with poor survival with a hazard ratio of 1.16 and P-value of 0.02 (Supplementary Table 2). A similar multivariate analysis was done using the aforementioned clinical annotation and FXYD5 copy number. Here again, we found a hazard ratio of 1.16 and a slightly higher P-value of 0.06 (Supplementary Table 3).
Next, we examined the Cancer Cell Line Encyclopedia (CCLE) and found that in fact FXYD5 is amplified, compared to other cancer lines, in NIH:OVCAR-3 (second line in figure), a cell line established from a highly progressive ovarian adenocarcinoma (Fig. 2C).12 Another OC cell line JHOS4–ovary, which is known for its slow growth, was among the lines of minimal FXYD5 copy number. The findings on cell lines not only strengthens the case of FXYD5 as a marker for poor diagnosis in OC but also provides an avenue for further testing with appropriate cell culture models.
Finally, it is well known that transcript levels do not always correlate with protein expression, thus having FXYD5 protein levels would be ideal. Unfortunately, there is no FXYD5 proteomics data in TCGA OC data set. However, eight of 11 OC samples were found to have either a medium or high degree of FXYD5 antibody (HPA010817) staining localized to the cytoplasm or membrane based on data from the human protein atlas.13
Discussion
Survival analysis on SOC samples presented by TCGA identified FXYD5 as a potential marker of metastasis in a subset of patients both in copy number and expression. We have checked the validity of our discovery by employing the same survival analysis on two other open-access microarray datasets. The results for the three different datasets were consistent and pointed to FXYD5 as a poor diagnosis marker for OC. None of the other genes in our list of four that exhibited elevated FXYD5 in poor outcome samples were as efficient in identifying poor prognosis as FXYD5.
Dysadherin, which is coded by FXYD5, functions in chemokine production central to growth, survival, and migration of cancer cells from the primary tumor. Additionally, as it downregulates E-cadherin and upregulates vimentin, it may serve to push the cell from epithelial to mesenchymal state, implicating this gene in metastasis. Moreover, recent studies identified dysadherin as an activator of AKT1 and a driver of the oncogenic PIK3CA pathway.14 To the best of our knowledge, dysadherin has not been linked to OC until this study. As in Table 2, it has been linked, however, to a large number of cancers as a marker for poor diagnosis. Our finding that FXYD5 is also a marker for poor survival in OC will provide a new light on metastasis patterns involving breast, cervical, and ovarian cancers.
Cancer driver genes have been annotated in the literature using different definitions based on mutational patterns.15 A recent study by Tamborero et al identified genes deemed driver by four different methods, and FXYD5 is not in the list of intersections of driver genes identified in this study.16 The small intersection between the different methods attests, however, to challenges for algorithmic identification of drivers of cancer. We think of FXYD5 not as an initiator of cancer but as a potential driver for metastasis of OC based on the finding that poor prognosis is linked to both elevated CNA and transcript expression.24
Since effective antibodies exist against dysadherin, fluorescence labeling of tissue arrays will identify whether this protein is a differentiating factor for poor prognosis in a clinical setting. In another set of experiments, gene silencing and rescue experiments could transform FXYD5 from a marker for poor diagnosis to metastasis driver, with causality and conclusion. If, in fact, the oncogenic potential of dysadherin is mediated via AKT1 and the PIK3CA pathway, then the emerging drug therapies in clinical trials and on the market targeting this pathway may be candidate treatment options for aggressive OC.17 Additionally, if FXYD5 is indeed simply a marker for metastasis, then aggressive disease modern therapeutic modalities such as antibody-drug conjugate or chimeric antigen receptor could be employed to target cancer cells with suitable expression of this gene. Indeed, a search in google patents reveals a patent (US 20110064752 A1) for a biologic Extracellular targeted drug conjugates (EDC) targeting FXYD5 with purported use in various cancers further strengthening the case to interrogate this target further in OC.
Author Contributions
Conceived and designed the experiments: PR, AT. Analyzed the data: PR, TP. Wrote the first draft of the manuscript: PR, AT. Contributed to the writing of the manuscript: PR, AT, TP, RP. Agree with manuscript results and conclusions: PR, AT, TP, RP. All authors reviewed and approved of the final manuscript.
McCluggageW.Morphological subtypes of ovarian carcinoma. Pathology.2011; 43(5): 420–32.
3.
BoltonK., GandaC., BerchuckA., PharaohP., GaytherS.Role of common genetic variants in ovarian cancer susceptibility and outcome: progress to date from the ovarian cancer association consortium (OCAC). J Intern Med.2012; 271(4): 366–78.
4.
Van NieuwenhuysenE., LambrechtsS., LambrechtsD., LeunenK., AmantF., VergoteI.Genetic changes in nonepithelial ovarian cancer. Expert Rev Anticancer Ther.2013; 13(7): 871–82.
5.
BraemM., SchoutenL., PeetersP., den BrandtP., Onland-MoretN.Genetic susceptibility to sporadic ovarian cancer: a systematic review. Biochim Biophys Acta.2011; 1816(2): 132–46.
6.
Cancer Genome Atlas Research Network.Integrated genomic analyses of ovarian carcinoma. Nature.2011; 474(7353): 609–15.
7.
SungC., SongI., SohnI.A distinctive ovarian cancer molecular subgroup characterized by poor prognosis and somatic focal copy number amplifications at chromosome 19. Gynecol Oncol.2014; 132(2): 343–50.
8.
InoY., GotohM., SakamotoM., TsukagoshiK., HirohashiS.Dysadherin, a cancer-associated cell membrane glycoprotein, down-regulates E-cadherin and promotes metastasis. Proc Natl Acad Sci U S A.2001; 99(1): 365–70.
9.
MillerT., DavisP.S163 is critical for FXYD5 modulation of wound healing in airway epithelial cells. Wound Repair Regen.2008; 16(6): 791–9.
10.
BarrettT., TroupD.B., WilhiteS.E.. NCBI GEO: archive for functional genomics data sets - 10 years on. Nucleic Acids Res.2010; 39(Database): D1005–10.
11.
BarrettT., WilhiteS.E., LedouxP.. NCBI GEO: archive for functional genomics data sets - update. Nucleic Acids Res.2012; 41(D1): D991–5.
12.
BarretinaJ., CaponigroG., StranskyN.. The cancer cell line encyclopedia enables predictive modelling of anticancer drug sensitivity. Nature.2012; 483(7391): 603–7.
13.
PontenF., JirströmK., UhlenM.The human protein Atlas-a tool for pathology. J Pathol.2008; 216(4): 387–93.
14.
LeeY.K., LeeS.Y., ParkJ.R.. Dysadherin expression promotes the motility and survival of human breast cancer cells by AKT activation. Cancer Sci.2012; 103(7): 1280–9.
15.
SchroederM., Rubio-PerezC., TamboreroD., Gonzalez-PerezA., Lopez-BigasN.OncodriveROLE classifies cancer driver genes in loss of function and activating mode of action. Bioinformatics.2014; 30(17): i549–i555. doi: 10.1093/bioinformatics/btu467.
16.
TamboreroD., Gonzalez-PerezA., Perez-LlamasC.. Comprehensive identification of mutational cancer driver genes across 12 tumor types. Sci Rep.2013; 3: 2650.
17.
AkinleyeA., AvvaruP., FurqanM., SongY., LiuD.Phosphatidylinositol 3-kinase (PI3 K) inhibitors as cancer therapeutics. J Hematol Oncol.2013; 6(1): 88.
18.
ColamaioM., CalìG., SarnataroD.. Let-7a down-regulation plays a role in thyroid neoplasias of follicular histotype affecting cell adhesion and migration through its ability to target the FXYD5 (dysadherin) gene. J Clin Endocrinol Metab.2012; 97(11): E2168–78.
19.
SchülerY., Lee-ThedieckC., GeigerK.. Osteoblast-secreted factors enhance the expression of dysadherin and CCL2–dependent migration of renal carcinoma cells. Int J Cancer.2011; 130(2): 288–99.
20.
SubramaniamM., NavarroS., Llombart-BoschA.Immunohistochemical study of correlation between histologic subtype and expression of epithelial-mesenchymal transition-related proteins in synovial sarcomas. Arch Pathol Lab Med.2011; 135(8): 1001–9.
21.
ParkJ.R., KimR.J., LeeY.K.. Dysadherin can enhance tumorigenesis by conferring properties of stem-like cells to hepatocellular carcinoma cells. J Hepatol.2011; 54(1): 122–31.
22.
MaehataY., HirahashiM., AishimaS.. Significance of dysadherin and E-cadherin expression in differentiated-type gastric carcinoma with submucosal invasion. Hum Pathol.2011; 42(4): 558–67.
23.
LiangJ., ZhengH., XiaoH., LiN., ChengC., WangH.Dysadherin expression in gastrointestinal stromal tumors (GISTs). Pathol Res Pract.2009; 205(7): 445–50.
24.
OchiaiH., NakanishiY., FukasawaY.. A new formula for predicting liver metastasis in patients with colorectal cancer: immunohistochemical analysis of a large series of 439 surgically resected cases. Oncology.2008; 75(1-2): 32–41.
25.
BatistatouA., CharalabopoulosA.K., ScopaC.D.. Expression patterns of dysadherin and E-cadherin in lymph node metastases of colorectal carcinoma. Virchows Arch.2006; 448(6): 763–7.
26.
KyzasP.A., StefanouD., BatistatouA.. Dysadherin expression in head and neck squamous cell carcinoma. Am J Surg Pathol.2006; 30(2): 185–93.
27.
BatistatouA., ScopaC.D., RavazoulaP.. Involvement of dysadherin and E-cadherin in the development of testicular tumours. Br J Cancer.2005; 93(12): 1382–7.
28.
TamuraM., OhtaY., TsunezukaY.. Prognostic significance of dysadherin expression in patients with non-small cell lung cancer. J Thorac Cardiovasc Surg.2005; 130(3): 740–5.
29.
NishizawaA., NakanishiY., YoshimuraK.. Clinicopathologic significance of dysadherin expression in cutaneous malignant melanoma. Cancer.2005; 103(8): 1693–700.
30.
WuD., QiaoY., KristensenG.B.. Prognostic significance of dysadherin expression in cervical squamous cell carcinoma. Pathol Oncol Res.2004; 10(4): 212–8.
31.
MitselouA., BatistatouA., NakanishiY., HirohashiS., VougiouklakisT., CharalabopoulosK.Comparison of the dysadherin and E-cadherin expression in primary lung cancer and metastatic sites. Histol Histopathol.2010; 10(4): 212–8.
32.
NakanishiY., AkimotoS., SatoY., KanaiY., SakamotoM., HirohashiS.Prognostic significance of dysadherin expression in tongue cancer: immunohistochemical analysis of 91 cases. Applied Immunohistochemistry and Molecular Morphology.2004; 12(4): 323–8.
33.
ShimadaY., HashimotoY., KanT.. Prognostic significance of dysadherin expression in esophageal squamous cell carcinoma. Oncology.2004; 67(1): 73–80.
34.
ShimadaY.Clinical significance of dysadherin expression in gastric cancer patients. Clin Cancer Res.2004; 10(8): 2818–23.
35.
SatoH., InoY., MiuraA.. Dysadherin: expression and clinical significance in thyroid carcinoma. J Clin Endocrinol Metab.2003; 88(9): 4407–12.
36.
ShimamuraT.Dysadherin overexpression in pancreatic ductal adenocarcinoma reflects tumor aggressiveness: relationship to e-cadherin expression. J Clin Oncol.2003; 21(4): 659–67.