
Abstract
Therapeutic resistance arises as a result of evolutionary processes driven by dynamic feedback between a heterogeneous cell population and environmental selective pressures. Previous studies have suggested that mutations conferring resistance to epidermal growth factor receptor (EGFR) tyrosine kinase inhibitors (TKI) in non-small-cell lung cancer (NSCLC) cells lower the fitness of resistant cells relative to drug-sensitive cells in a drug-free environment. Here, we hypothesize that the local tumor microenvironment could influence the magnitude and directionality of the selective effect, both in the presence and absence of a drug. Using a combined experimental and computational approach, we developed a mathematical model of preexisting drug resistance describing multiple cellular compartments, each representing a specific tumor environmental niche. This model was parameterized using a novel experimental dataset derived from the HCC827 erlotinib-sensitive and -resistant NSCLC cell lines. We found that, in contrast to in the drug-free environment, resistant cells may hold a fitness advantage compared to parental cells in microenvironments deficient in oxygen and nutrients. We then utilized the model to predict the impact of drug and nutrient gradients on tumor composition and recurrence times, demonstrating that these endpoints are strongly dependent on the microenvironment. Our interdisciplinary approach provides a model system to quantitatively investigate the impact of microenvironmental effects on the evolutionary dynamics of tumor cells.
Introduction
The past decade has seen an increase in the availability of molecular-targeted cancer therapies. 1 Though anticipated to revolutionize cancer treatment,2, 3 the rapid onset of drug resistance 4 has limited the effectiveness of such therapies. For instance, non-small-cell lung cancer (NSCLC) cells that harbor activating mutations in the epidermal growth factor receptor (EGFR) tyrosine kinase domain are exquisitely sensitive to small-molecule EGFR inhibitors such as erlotinib.5–7 However, prolonged treatment of EGFR-mutant tumors and tumor-derived cell lines ultimately lead to these cells becoming refractory to EGFR inhibition. Numerous cell-intrinsic (eg, alterations to the drug's target or activation of a compensating pathway) and cell-extrinsic (eg, environmental blockade or alterations in drug metabolism) mechanisms for the emergence of resistance have been identified; in EGFR-driven lung cancers, resistance can be driven by a secondary point mutation within EGFR, T790M, or amplification of MET.8, 9
Recently, several studies have noted both the extensive genetic heterogeneity present within tumors10, 11 and the significant role of tumor molecular evolution of resistance in which selective forces acting on a tumor rapidly promote the growth of subclones with a fitness advantage. This process ultimately leads to radical alterations in tumor composition as drug-resistant cells come to dominate a tumor.12, 13 Similarly, there have been numerous studies exploring the tumor microenvironment, 14 which comprises chemokines and other secreted factors, extracellular matrix components, nutrients such as oxygen and glucose, and various stromal cell types. The tumor microenvironment (TME) is known to radically influence tumor progression as well as cancer cell physiology.15, 16 For example, naturally occurring nutrient gradients resulting from diffusion limitations can create individual niches in which cells are typically exposed to either normoxic or hypoxic conditions.
Though both tumor genetic heterogeneity and tumor microenvironmental heterogeneity have been extensively investigated, only a few studies have linked the two. 17 For example, recent work has suggested that the microenvironment can drive cellular adaptation14, 15, 18; cells inhabiting regions of hypoxia and acidosis may upregulate glycolysis and become resistant to acid-meditated toxicity in order to survive these harsh environmental conditions.16, 19 Consequently, the microenvironment may influence the fitness of cancer cells and drive the evolution of a tumor.7,14,15,17,18 The interplay between the selective effects imposed by treatments and those of the tumor microenvironment is still poorly understood.19–21
One approach to gain insight into the emergence and spread of drug resistance throughout tumors relies upon the development of stochastic evolutionary models. So far, many of these models have been aimed primarily at understanding the accumulation of resistance mutations in exponentially growing, homogeneously mixed tumors so as to quantify the risk of resistance preexisting to therapy.22–31 These models employ stochastic processes that describe rare mutational events and the clonal evolution of sensitive and resistant cell population sizes. A second thread in current research is directed toward the dynamics of resistant cell populations during treatment. These works often utilize compartment-based ordinary differential equation models of sensitive and resistant cell populations32–36 or stochastic process models.37–43 A major goal of these studies is to optimize treatment scheduling to minimize the total tumor burden or resistance fraction and maximize survival time.
Although there has been a lot of effort devoted to developing spatial models of tumor growth,44–46 the majority of the stochastic evolutionary models of drug resistance in cancer mentioned above have assumed that the tumor is spatially uniform. These works have investigated the temporal dynamics of evolution and selection rather than the spatial dynamics in a tumor. For example, in previous work, we have utilized
Here, we explored whether selection pressures imposed by the microenvironment (ie, oxygen, glucose, and drug levels) influence the rate of tumor growth and the penetrance of drug resistance among clinically relevant subtypes of EGFR-mutant NSCLC. We found that exposing the same cancer cells to different microenvironmental conditions changed their overall behavior in terms of growth and response to therapy. This observation has a significant impact on the evolutionary dynamics of the entire tumor population as indicated by mathematical model predictions. We used our approach to ask the following questions: 1) to what extent does the microenvironment influence the time to tumor rebound? 2) what is the percentage of drug resistance at rebound time? and 3) what is the probability of resistance survival in different microenvironmental niches? By understanding the relationship between TME and evolution of resistance, it may ultimately become possible to develop treatment approaches that rely not only upon therapeutics targeting cancer cells but also upon therapeutics that modulate the microenvironment.
Materials and Methods
Derivation of a microenvironmental mathematical model
Here we extend a previously developed41, 47 model to incorporate the possible impact of inhomogeneous environmental conditions on the evolutionary processes within a tumor. In particular, the three environmental factors described (drug, oxygen, and glucose) were chosen because they are likely to 1) strongly impact the growth kinetics of tumor cells, 2) affect different cell types in distinct ways, thus altering selective advantages, and 3) vary in both time and spatial location throughout a tumor.52, 53 Within each compartment, we utilized a multitype time-inhomogeneous stochastic branching process model to describe the population of cancer cells. In this model, each cell waits a random amount of time to either divide or die; this random waiting time is an exponential random variable with parameters given by the birth and death rates of the cell, respectively. In our model extension, the birth and death rates are dependent on the cell type (drug-sensitive or resistant) and the current local availability of oxygen, glucose, and local drug concentration. Mutations can arise within the sensitive cell population to confer resistance; this happens with a small mutation probability each time a sensitive cell divides. However, here we considered a preexisting resistant population that comprises the dominant contribution to the resistant population, so that newly created resistant mutants after the start of therapy have negligible contribution to the dynamics. The evolutionary dynamics of each compartment is assumed to be independent of the other compartments. This assumption is made to preserve the simplicity of the model, but will be relaxed in future work involving a full model of the interaction between a cell population and its environment in a continuum setting.
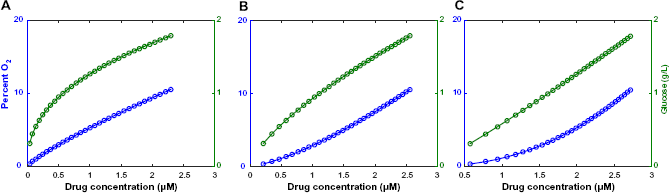
To investigate in detail the impact of simultaneously varying parameters in this model, we constructed an idealized model of a spatial microenvironment in which local concentration of environmental factors could be simultaneously varied. We first considered how oxygen, drug, and glucose vary simultaneously as a function of the distance from the nearest blood vessel (Fig. 1). The concentration of each factor was assumed to decay exponentially as a function of distance from the vessel. The rate of decay for each nutrient was parametrized by literature estimates of the half-life away from the vessel (18 μm for oxygen,14, 54 36 μm for glucose 54 ). The rate of decay for erlotinib was varied between 15 and 40 μm taking the baseline 15 μm value from the decay rate of doxorubicin, which has a molecular weight similar to that of erlotinib. 55 The model considers initial values at distance 0 from the vessel or nutrient source as 6 μM drug (high drug) or 2.5 μM drug (moderate drug), 12% O2, and 2 g/L glucose, which were chosen based on the literature.56, 57 Based on these considerations, we constructed a series of compartments representing various distances (in multiples of 20 μm) from the vessel, each reflecting a combination of drug, oxygen, and glucose levels expected to coincide in a particular localized environment (Fig. 2A–C). To estimate the relative contributions of each of these environmental compartments to tumor cell behavior, we utilized experimental data capturing relative frequencies of a spectrum of O2 partial pressures throughout solid tumors (squamous cell carcinomas) found in Vaupel et al. 58 (Supplementary Fig. 1). Specifically, we utilized experimental data that established the relative frequencies of a spectrum of O2 partial pressures (150 squamous cell carcinoma patient tumors, 13,596 pO2 values measured, median O2 = 9 mmHg) using a computerized Eppendorf pO2 histography system.58, 59 Based on these data, we constructed our mathematical model using a weighted mixture of compartments in which the relative frequency of each O2 partial pressure level was set using the experimental pO2 profile.
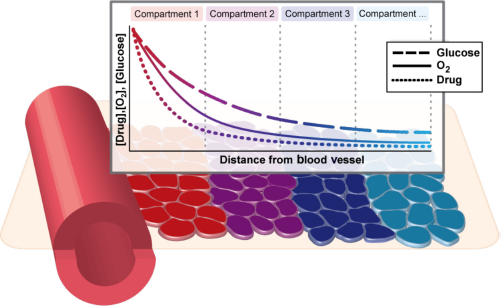
Microenvironmental heterogeneity in the tumor is modeled using a weighted series of compartments reflecting co-occurring drug, oxygen, and glucose levels disseminating from blood vessels within the tumor. Weights of the compartments are calibrated to match experimental observations of oxygen partial pressure distribution within tumors. Within each compartment, a stochastic multitype branching process describes the evolutionary dynamics of the tumor cell population.
Relationship between glucose (blue), pO2 levels (green), and drug concentration (varies along x-axis), modeled by consideration of relative diffusion length scales of each factor away from a source (eg, blood vessel). It relies on the assumption that the initial values at distance 0 from the vessel are: 12% O2, 2 g/L glucose, 3 μM erlotinib. The decay rate of the drug is (
Experimental Methods
Reagents
The following stains were purchased from Invitrogen: Hoechst 33342 (#H21492) and propidium iodide (PI, #P1304MP). Erlotinib was purchased from LC Laboratories (# E-4007), and D-(+)-glucose solution was purchased from Sigma-Aldrich (#G8644).
Cell Culture
The HCC827 drug-resistant cell lines R1 (T790M) and R2 (Met amplification) were derived from erlotinib dose escalation experiments of the HCC827 parental line, as described in Ohashi et al. 60 The HCC827 parental, R1, and R2 cells were cultured in Roswell Park Memorial Institute (RPMI) medium supplemented with 10% fetal bovine serum (FBS) and 1% penicillin/streptomycin solution using standard growth conditions of 37 °C and 5% CO2. Additionally, the R1 and R2 resistant lines were maintained in 1 μM erlotinib. All experiments were performed with cells at low passage numbers and before cells reached confluence. In addition, all cell lines were tested negative for mycoplasma.
Western Blots
Dimethyl sulfoxide (DMSO) control cells or μM erlotinib-treated cells (6-hour treatment) were lysed in radioimmunoprecipitation assay (RIPA) buffer (Sigma-Aldrich #R0278) supplemented with protease and phosphatase inhibitor cocktails (Thermo Scientific #78430 and 78420, respectively). Fifty micrograms of protein was separated on a 4%-20% Tris-HEPES gel (Thermo Scientific #25204) and transferred to a polyvinylidene fluoride (PVDF) membrane. The following primary antibodies were purchased from Cell Signaling: anti-EGFR (#4267), anti-phospho EGFR (Tyr1068 #2236), anti-phospho Met (Tyr1234/1235 #3129), anti-phospho Erk1/2 (Thr202/Tyr204#9101), anti-Akt (#9272), anti-phospho Akt (Ser473 # 4060). β-Actin (A5441) was purchased from Sigma-Aldrich, and anti-Met (#SC-10) and anti-Erk2 (#SC-154) were purchased from Santa Cruz.
Treatment and environmental perturbations
Cell birth/death experiments were conducted in 96-well black bottom plates (Corning Inc. #3904) under various environmental culture conditions (ie, combinations of 1, 5, or 20% oxygen and 0, 0.5, or 2 g/L glucose). Approximately 3,000 cells per well were seeded. Low oxygen levels were controlled using hypoxia incubator chambers by Stemcell Technologies (#27310) and were purged with special gas mixtures of 1% or 5% O2 and the remaining N-. Low glucose levels were controlled by purchasing RPMI media without glucose (0 g/L) and supplementing them with 0.5 g/L glucose. The following day, cells were treated with erlotinib (0, 0.001, 0.01, 0.1, 1, 10 μM).
Live/dead cell counts
Live and dead cell counts were determined using the Cellomics ArrayScan VTI High Content Screening (HCS) Reader, a high-throughput quantitative imaging system, at 0, 24, 48, and 72 hours post drug treatment. Briefly, cells were stained with 5 μg/mL Hoechst 33342 and 5 μg/mL PI for 30 minutes prior to analysis. Average intensity of Hoechst 33342 and PI was determined for each individual cell using the target activation bioapplication of the Cellomics Arrayscan. A final readout of total cell number and percentage of PI positive cells was quantitatively measured within a given well for a given treatment and for a given time. Each condition was performed in triplicate. All data points used in the analysis were taken before any confluence effects were apparent.
Model calibration to experimental data
For each cell line in each set of environmental conditions (specified by drug concentration, glucose level, and oxygen level), a time series of live/dead counts was obtained between 0 and 72 hour (described above in experimental methods). For each set of log-transformed time-series live cell counts, linear regression was performed to obtain the net growth rates. Using the assumption of a constant death rate per live-cell unit of time, death rates were calculated using the accumulated amount of cell deaths over the time period. The cell birth rate was then equated to the sum of the net growth rate and the death rate for each cell type in each environment. Growth rates (not raw data) were averaged over each set of experimental replicates. Thus, analysis of these time series allowed us to calculate the birth and death rates of all three cell types (HCC827, Rl, R2) in a series of 54 environmental conditions. Using linear/nonlinear regression on this panel of data, we then obtained functional representations reflecting cell birth and death rates as an explicit function of the three factors, namely, drug, glucose, and oxygen, for each cell type.
Results
We investigated the relationship between tumor microenvironment and the evolution of drug resistance in three steps. First, we experimentally generated a comprehensive panel of cellular growth rates under a wide range of environmental conditions. Next, we used these rates to inform a stochastic compartment-based tumor model of the outgrowth of preexisting drug resistance. Finally, we used our experimentally calibrated modeling framework to investigate tumor rebound kinetics, and in particular to provide insight into the magnitude by which the micro environment influences tumor progression.
The net growth rate of erlotinib-sensitive and -resistant cells depends on the microenvironment
One of the dominant factors influencing tumor evolution is the difference in net growth rates between the types of cells. 61 Consequently, we initially investigated the effect of the microenvironment on the birth and death rates of a series of erlotinib-sensitive and derived resistant NSCLC cell lines using a quantitative fluorescence-imaging-based platform across a range of environmental conditions. We defined 54 pseudo-environments as combinations of erlotinib drug concentration (0, 0.001, 0.01, 0.1, 1, 10 μM), oxygen level (1%, 5%, 20%), and glucose level (0, 0.5, 2 g/L). Using the live and dead cell counts at four time points during 0–72 hours, we fitted an exponential growth model to the data to obtain the birth and death rates. All experiments were performed before the cells reached confluence, and the data confirmed a good fit with the exponential growth model as shown previously.42, 46 Figure 3 and Supplementary Figure 2 illustrate the 54 observed net growth rates, death rates, and birth rates for the HCC827 NSCLC cell line, and two isogenic, resistant-derived cell lines 60 as a function of the pseudo-environment. As previously observed, we found that the HCC827 parental cells are highly sensitive to EGFR tyrosine kinase inhibitor (TKI) therapy (IC50 at 72 hours of 5 nM, 60 and inhibition of EGFR pathway, Supplementary Fig. 3). Since HCC827-R1 cells harbor the T790M point mutation and HCC827-R2 cells harbor a MET amplification, both cell types are significantly resistant to EGFR TKI therapy (IC50 at 72 hours of >5 μM 60 ). Interestingly, we found that the growth kinetics of all tested cell lines were significantly impacted by modulating the environmental conditions. For example, as the glucose concentration decreased, the cellular birth rates declined significantly for all cell types, whereas the death rates were less sensitive to this parameter (Fig. 3, Supplementary Fig. 2).
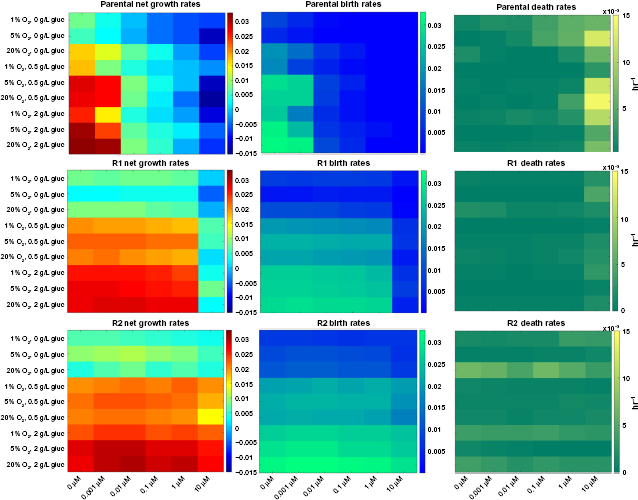
Net growth rate, birth rate, and death rate under 54 environmental conditions for the erlotinib-sensitive HCC827 NSCLC cell line in conjunction with two resistant derived cell lines: R1, harboring the T790M point mutation; and R2, harboring the MET amplification form of resistance to erlotinib. In each panel, the horizontal axis represents increasing erlotinib concentration while glucose and oxygen concentration are varied along the vertical axis. The difference between cell lines is most evident when comparing the lower left-hand quadrant to the upper right-hand quadrant (ie, the most extreme environmental conditions) of the net growth rate charts, with the biggest difference seen in the sensitive cells, followed by the R1 cells, and the least environmental effect being felt by the R2 cells.
Furthermore, we observed that changing the environment had a larger impact on erlotinib-sensitive cells than on resistant cells, consistent with higher growth rates in the resistant cell lines compared to the sensitive line. In addition, analysis of the cell birth rates (see next section) showed that, in the absence of drug, the parental HCC827 cells had a larger response to oxygen variation than either of the resistant lines. This difference was most evident in low glucose settings. Additionally, we determined that the R1 and R2 cell line response to glucose variation was slightly stronger than that of the HCC827 parental cell line.
Variation in growth rates across the microenvironment model
As described in Methods section, we constructed an idealized model of a spatial microenvironment in which local concentration of environmental factors can be simultaneously varied. Next, we calibrated our mathematical model using our growth parameters and studied the differences in birth and death rates between sensitive and resistant cells within a series of tumor microenvironments (Fig. 4). We estimated the birth and death rates for each cell type at interpolated microenvironmental conditions from the empirically measured growth data (Fig. 3, Supplementary Fig. 2). Rates were estimated by first performing nonlinear regression to fit the data in the drug dimension, and then linear regression to fit the data in the simultaneously varying oxygen and glucose dimensions, for each drug condition. As a result, we obtained six analytical functions of three variables (O2, drug, glucose) for the birth and death rates of each of the three cell types, which we then utilized to determine the evolutionary advantage of sensitive and resistant cells within the varying microenvironments of a tumor.

Net growth rates of sensitive, R1, and R2 cells as a function of microenvironmental compartment in (
In Figures 4A-C, we illustrate the changes in net growth rates relative to 1) the specific microenvironmental compartment, 2) the presence and type of drug resistance mutation, and 3) the drug decay rate. In the medium and low drug decay rate conditions, there is a strong selective pressure against the sensitive population throughout all environmental conditions. This observation stands in contrast to the high drug decay rate condition, where there is a spike in the sensitive cells’ growth rate within the lower compartment numbers (ie, furthest from the blood vessel). This effect arises because in those compartments the drug concentration has decreased below the threshold level required for growth inhibition, as specified by the experimental data. In addition, despite the R1 and R2 cells both being resistant to erlotinib, their growth rate profiles across the environmental compartments differ considerably.
We also studied the growth rate changes over the sequence of microenvironments in the absence of drug (Fig. 4D). We observed that in those environments in which oxygen and glucose are most plentiful (as would be the case in the laboratory setting), sensitive cells have a growth advantage as compared to both resistant types. This observation has led to the common conclusion that resistant cells are less fit than sensitive cells. 62 However, our analysis presents a more complex picture. We surprisingly found that the selective advantage switches between the sensitive and resistant populations as we move through microenvironmental compartments. In the nutrient-stressed environments (ie, lower compartment numbers), the resistant cells have a selective advantage; this observation holds true for both T790M and MET amplification-mediated resistance mechanisms. Thus, although some groups have concluded that sensitive cells have a survival advantage over resistant cells, 62 we observed that, within a tumor whose microenvironments are likely to be deficient in oxygen and nutrients, the opposite may be true.
Evolutionary dynamics of tumor population varies depending on the microenvironment
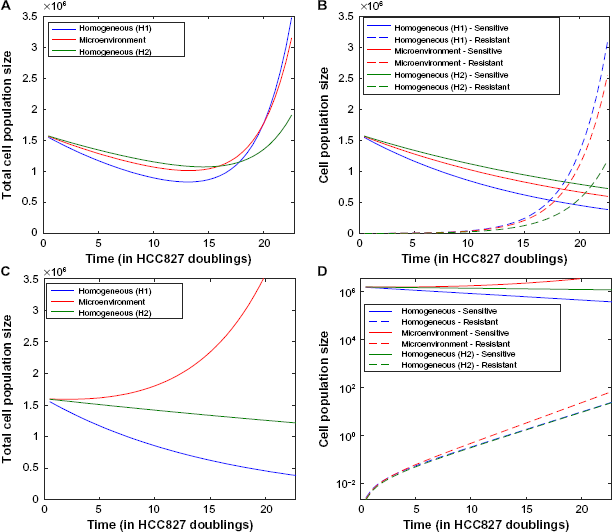
We next investigated the extent to which the tumor microenvironment influences the time until rebound, ie, time until the minimum tumor size is reached before increasing due to the outgrowth of resistance. Measuring rebound growth kinetics is important clinically, as it can be used as an indicator of tumor aggressiveness. Figure 5 shows the evolutionary dynamics of environmentally heterogeneous tumor model in which we initialized each compartment with a mixture of 1% resistant cells (either R1 or R2) and 99% sensitive cells. To evaluate the impact of microenvironmental heterogeneity on tumor evolutionary dynamics, we compared the heterogeneous microenvironmental model (consisting of a “mixture” of environmental compartments) against two environmentally homogeneous conditions (H1 and H2), for both high and moderate initial drug concentrations. The condition H1 models traditional lab culture conditions [20% O2, 2 g/L glucose, 6 μM (high drug)/2.5 μM (moderate drug)], whereas H2 represents a condition with the average concentration of each nutrient from the heterogeneous microenvironmental model [1.967% O2, 0.6517 g/L glucose, 0.5864 μM (high drug)/0.2444 μM (moderate drug)]. For the high drug case, the average conditions (H2) match closely to the mixed model (Fig. 5A), while the lab conditions (H1) result in very different predictions with a longer time to rebound, especially in the R1 case where it was more than double the timeframe. However, for the moderate drug case, the average conditions (H2) and our more detailed mixed environment model differ significantly, with a shorter time to rebound occurring in the mixed conditions. Upon further investigation, we found that in the detailed model, there exists a significant proportion of the tumor in which the sensitive cells are not being inhibited because the drug concentration is below the inhibition threshold. However, in the H2 model, the compartment average cannot capture this effect, resulting in a significantly slower predicted time to rebound.

(
We also noted that at high drug concentration, the R1 cells demonstrate a much longer time to rebound under H1 than H2 conditions. This is due to the observation that the R1 net growth rate is higher under H2 than H1 conditions. Even though the O2 and glucose levels are higher in H1, the drug concentration is also higher under H1 conditions, leading to a response via reduction in birth rates (see Supplementary Fig. 2B) by R1 cells, which then contributes to a slower time to rebound.
We then investigated the percentage of resistant cells at the time of rebound in each model (mixed, H1, H2) in order to demonstrate the effects of the microenvironment on tumor composition (Fig. 5B). The mixed environment and H2 conditions demonstrated a lower fraction of resistant cells at the time of rebound than H1 conditions. This is due to the contribution of environments with lower oxygen, drug, and glucose, where the difference between sensitive cell and resistant cell fitness may vary greatly between the various environmental scenarios. In particular, under high drug concentration, the relative selective advantage of resistant cells is very large in H1 homogeneous conditions since the sensitive cells exhibit a large response to erlotinib. However, the mixed and H2 conditions both reflect in some way the significant presence of parts of the tumor with low oxygen, drug, and glucose, where the selective advantage of resistant cells is much smaller. This results in a larger composition of resistant cells predicted at the time of tumor rebound in the H1 environment. The same phenomenon is noted under moderate drug concentration, but less pronounced since the sensitive cells are less inhibited by lower concentrations of drug. Figures 5C and D illustrate the change in tumor population size over time for each model (heterogeneous microenvironment, H1, H2) starting with high or medium drug conditions, respectively.
Demonstration of tumor evolutionary dynamics under pulsed erlotinib treatment schedule
Using the model, we next investigated how the microenvironment impacts the evolutionary dynamics of resistance under a pulsed erlotinib treatment schedule. For demonstration purposes, we studied a pulsed schedule of 3.5 HCC827 doublings at 10 μM followed by 3.5 HCC827 doublings at 1 μM. Note that the HCC827 doubling time in the absence of drug is 22 hours, and this is set as an appropriate time scale for studying dosing strategies. Figure 6 demonstrates the evolutionary dynamics under this schedule for the homogeneous environment using lab conditions (H1) as well as for the heterogeneous microenvironmental model and averaged homogeneous conditions (H2), for varying drug decay rates and preexisting resistance status. We observed that the overall tumor response can be greatly impacted by the microenvironmental profile. Figure 6C demonstrates that, while tumor response is observed under homogeneous lab and averaged conditions, under a heterogeneous microenvironment we expect no reduction in tumor burden at all. Figures 6A and B show that, even when the overall tumor response is similar between the homogeneous lab and heterogeneous microenvironments, a larger fraction of the tumor is sensitive under the heterogeneous microenvironment setting. Here, the H2 condition yields the slowest initial tumor response to therapy out of the three conditions but also the lowest resistant cell fraction, leading to the least aggressive recurrent tumor. Note that the overall differences between the microenvironmental model and homogeneous settings are modest in Figures 6A and B, while they are very dramatic in Figures 6C and D. This is due in large part to the high decay rate of the drug in Figures 6C and D. In this situation, for the microenvironmental model the compartments with the highest weight (lowest oxygen, glucose, drug) have a drug concentration that is below the IC50 for the sensitive cells; in contrast, for the low decay rate scenario, all compartments in the microenvironmental model have drug concentrations above the IC50. For the high decay rate scenario, this results in a large growth rate for the sensitive cells in the compartment with the largest weight, which prevents the total tumor population from exhibiting a reduction in response to therapy.
Demonstration of evolutionary dynamics under model incorporating heterogeneous microenvironment (red line) vs homogeneous laboratory environment (H1, blue line; H2, green line) conditions under pulsed high-low schedule: 3.5 HCC827 doublings at 10 μM followed by 3.5 HCC827 doublings on 1 μM (22 hour doubling time in absence of drug). (
Using our evolutionary model, we can explore a range of possible dosing schedules, constrained by toxicity limitations, to determine the “optimal” strategy that maximally delays tumor rebound due to drug resistance or prevents the emergence of drug resistance. We next studied how the optimal pulsed dosing strategy is impacted by considering the heterogeneous microenvironment of a tumor (Fig. 7). Figure 7A shows an estimated toxicity constraint (reproduced from Ref. 63 ); this constraint, estimated from clinical trial data on patient adverse effects, specifies the maximum tolerated length of a high-dose pulse at each erlotinib concentration. Using this toxicity constraint, we searched the space of schedules (incorporating a high-dose pulse followed by low dose 1 μM for the remainder of the week) to determine the optimal schedule under both microenvironmental assumptions. Figures 7B and 7C demonstrate that the optimal schedule to minimize total tumor size or the fraction of the tumor that is resistant at time of 15 doublings is quite different between the two microenvironmental settings. For example, to minimize the resistant fraction, the optimal strategy is approximately 5 μM high-dose pulse for 14 time units in the homogeneous laboratory environment model, but the shortest, highest pulse (10 μM for approximately 5 time units) for the heterogeneous microenvironment setting. These investigations demonstrate the importance of profiling and considering the heterogeneous tumor microenvironment when determining treatment scheduling to overcome resistance.

(
Discussion
Cancer is an evolutionary process during which selective forces act on tumor cells and results in the propagation of tumor clones with a relative fitness advantage that drives the clonal progression of the tumor. Drug resistance remains a major barrier toward improving patient outcomes. To date, studies on the evolutionary dynamics of drug resistance using traditional culturing methods have failed to account for the effects of the microenvironment on cell behavior within a tumor, including cell growth and response to therapy. Here, we used an integrated experimental and computational approach to highlight the importance of gradients of oxygen, glucose, and drug concentrations on overall tumor growth dynamics and the implications this may have on designing optimal treatment strategies.
The tumor microenvironmental landscape is continually in flux, requiring cells to adopt specific adaptive strategies to survive. Under hypoxia, which commonly occurs in solid tumors as a result of limited blood supply, cells assume different metabolic strategies (eg, glycolysis, glutamine metabolism) to maximize their survival potential.64, 65 For instance, Guillaumond et al recently demonstrated a metabolic switch among hypoxic pancreatic tumor cells, which acts as a selection process for more aggressive and invasive cells. In addition, these authors provided evidence for the existence of a feedback mechanism between tumor cells undergoing hypoxia-driven glycolysis and the survival of normoxic cells, 66 illustrating the dynamic interplay of cell-cell and cell-environment interactions. Here, we determined that the resistant cell lines’ responses to glucose variation is slightly stronger than that of the parental line. We observed that the magnitude of the impact of decreasing oxygen concentration on cell growth kinetics is dependent on the glucose level; when glucose levels are high, variation of the oxygen concentration has the largest impact on cell growth kinetics. These observations support Guillaumond's suggestion that the R1 and R2 resistant cell types have adapted metabolic strategies that are more robust to oxygen changes, but slightly more sensitive to glucose changes, than the parental cells.
Our characterization of the differential growth rate responses as a function of O2, glucose, and drug concentrations leads us to believe that there exists an inherent metabolic difference between erlotinib-sensitive and -resistant cells, and that this metabolic difference preferentially favors the resistant cells to survive in nutrient-extreme environments. We have shown that the resistant cells are less sensitive to a reduction in O2 as compared to the sensitive cells, yet appear to be more sensitive to changes in glucose levels. One possible explanation for this result is that the resistant cells are more efficient at glycolysis by increasing glucose uptake in low O2 conditions, whereas the sensitive cells might be better at switching to glutamine breakdown for survival in limited-glucose environments. Further investigation will be conducted to confirm this hypothesis.
Although recent studies have begun to characterize the differential impact of the microenvironment on tumor cells, to our knowledge, little is known about how these microenvironmental variations impact different tumor cell types, such as drug-sensitive and -resistant cells. The results described herein provide one of the first detailed examinations of the microenvironmental impact on growth rates of NSCLC lines that are either sensitive or resistant to the EGFR TKI erlotinib. These results demonstrate that 1) utilizing laboratory environmental conditions to inform tumor dynamics and clinical progression can lead to incomplete conclusions, and 2) due to the ubiquity of threshold phenomena in biology, incorporation of detailed microenvironment heterogeneity is crucial – even homogeneous models constructed using averaged microenvironmental data can still yield a very inaccurate picture of tumor dynamics.
We used an evolutionary model of the sensitive and resistant cell population within a heterogeneous mixture of environmental conditions to determine the impact of the microenvironment on tumor dynamics and the outgrowth of resistance. We demonstrated that microenvironmental heterogeneity greatly impacts model predictions of tumor rebound time and tumor composition at the time of rebound. In particular, predictions of these clinically relevant features of tumor progression deviated significantly from predictions utilizing a ‘perfect mixing’ assumption, even when the microenvironmental conditions of the perfect mixing model were tuned to match the average conditions of the heterogeneous model. The microenvironmental model was able to account for the presence of hypoxic, low-glucose regions of the tumor with low drug concentrations. In these regions, the growth kinetics of sensitive and resistant cell populations may deviate significantly from their counterparts under “averaged” environmental conditions; thus the evolutionary dynamics of resistance are significantly influenced by the heterogeneous environmental distribution within a tumor. Moreover, we demonstrated that the manner in which the tumor microenvironment impacts tumor dynamics changes depending on the drug resistance mechanism. Another interesting finding is that, while the percent resistant fraction is the highest in the H1 model for all conditions, the time to rebound in the H1 model is not the shortest under any of these conditions (Fig. 5). This finding suggests that it is not necessarily the amount of resistant cells present but rather the differential selective pressure effects on tumor cell subpopulations. Knowledge of the selective advantage/disadvantage of different cell populations within different regions of the tumor will better guide model predictions, influence overall tumor dynamics, and impact future treatment strategies.
Conclusion
Our investigations strongly suggest that, in order to correctly predict the evolutionary dynamics of tumors, detailed consideration of the tumor microenvironment is required and more detailed experimental characterization of cellular response to environmental conditions is necessary. A full model of how a tumor cell population evolves within the complex microenvironment of a tumor would require, among other things, careful consideration of physical processes of nutrients into tumors, compounded by variable cell density, differential forces acting upon cells, effect of these forces on growth rates, and consumption of nutrients by cells, which further impacts nutrient and drug profiles. Such a complex model will be the topic of future investigation.
Although the work presented here was carried out using an NSCLC model system, the microenvironment should be considered across all tumor types even if the significance of individual factors may vary. Given that the microenvironment varies significantly throughout a tumor, uncovering a microenvironmentally driven growth signature would better inform the evolutionary dynamics of the entire tumor and greatly improve the clinical benefit from treatment regimens. The microenvironment has become an attractive target in cancer therapy with the design of drugs that modify its current state, such as angiogenesis inhibitors, hypoxia-activated prodrugs,67, 68 and bone-targeted therapeutics.69, 70 Other strategies including inhalation of hyperoxic gas (2% CO2 and 98% O2) have been shown to increase tumor oxygenation and resensitize tumors to radiation therapy.71, 72 It is known that tumor hypoxia leads to the failure of chemotherapy and radiotherapy treatment. 73 Therefore, disrupting or perturbing the microenvironment can have a dramatic impact on tumor outcome. The studies presented here highlight the importance of treating cancer as a system with many moving parts if we intend to truly understand and eventually control it. Future cancer therapeutic strategies need to be developed to further modulate the microenvironment to optimize therapeutic effect and clinical benefit.
Author Contributions
Conceived and designed the experiments: SMM, JF, FM, PM. Analyzed the data: SMM, JF. Wrote the first draft of the manuscript: SMM, JF, NCC, NH. Contributed to the writing of the manuscript: SMM, JF, FM, PM, DBA, WP, KL. Agree with manuscript results and conclusions: SMM, JF, NCC, NH, KL, DBA, WP, FM, PM. Jointly developed the structure and arguments for the paper: SMM, JF, FM, PM. Made critical revisions and approved final version: SMM, JF. All authors reviewed and approved of the final manuscript.
Footnotes
Supplementary Materials
Acknowledgments
Cellomics ArrayScan measurements were performed at the USC Broad CIRM Center and the Norris Comprehensive Cancer Center Flow Cytometry Core Facility that is supported in part by the National Cancer Institute Cancer Center Shared Grant award P30CA014089 and the USC Provost Office, Dean's Development Funds, Keck School of Medicine. The content is solely the responsibility of the authors and does not necessarily represent the official views of the National Cancer Institute or the National Institutes of Health. The authors would also like to thank Michelle Hori for her contributions to the TME schematic illustration.