
Abstract
Genome-wide association studies (GWASs) have identified thousands of single nucleotide polymorphisms (SNPs) robustly associated with hundreds of complex human diseases including cancers. However, the large number of G WAS-identified genetic loci only explains a small proportion of the disease heritability. This “missing heritability” problem has been partly attributed to the yet-to-be-identified gene-gene (G × G) and gene-environment (G × E) interactions. In spite of the important roles of G × G and G × E interactions in understanding disease mechanisms and filling in the missing heritability, straightforward GWAS scanning for such interactions has very limited statistical power, leading to few successes. Here we propose a two-step statistical approach to test G × G/G × E interactions: the first step is to perform principal component analysis (PCA) on the multiple SNPs within a gene region, and the second step is to perform Tukey's one degree-of-freedom (1-df) test on the leading PCs. We derive a score test that is computationally fast and numerically stable for the proposed Tukey's 1-df interaction test. Using extensive simulations we show that the proposed approach, which combines the two parsimonious models, namely, the PCA and Tukey's 1-df form of interaction, outperforms other state-of-the-art methods. We also demonstrate the utility and efficiency gains of the proposed method with applications to testing G × G interactions for Crohn's disease using the Wellcome Trust Case Control Consortium (WTCCC) GWAS data and testing G × E interaction using data from a case-control study of pancreatic cancer.
Introduction
Thanks to the rapidly decreasing cost of high-throughput genotyping technologies, genome-wide association studies (GWASs) have identified thousands of single nucleotide polymorphisms (SNPs) robustly associated with hundreds of complex human diseases and traits, 1 providing novel insights into the disease mechanisms 2 and offering new therapeutic targets. 3 However, the large number of GWAS-identified genetic loci only explains a small proportion of the disease heritability, commonly estimated from twin and family-based studies. For example, a recent large-scale meta-analysis of GWAS has identified 67 SNPs associated with the risk of breast cancer, which, however, only explains 14% of the heritability of breast cancer. 4 This so-called missing heritability problem has been attributed to the yet-to-be-identified susceptibility loci of even smaller effect sizes, 5 rare genetic variants (minor allele frequency (MAF) <1%),6,7 as well as gene-gene (G × G) and gene-environment (G × E) interactions. 8
In spite of the important roles of G × G and G × E interactions in understanding disease mechanisms and filling in the missing heritability, there have been very few successes in identifying such interactions.9,10 Lack of statistical power is one of the main reasons for such limited success. Standard G × G analysis based on GWAS data entails interaction test between each possible pair of SNPs, while standard G × E analysis tests the interaction between the environmental exposure of interest and each of the GWAS SNPs. As G × G and G × E interactions are second-order effects, they are more difficult to detect than genetic main effects. A rule of thumb is that, given the same significance level and comparable magnitude of effect size, detecting a G × E interaction would require a sample size at least 4 times larger than that for detecting a genetic main effect. 11 The lack of power is further exacerbated in the analysis of G × G interactions due to the curse of dimensionality: one million tests of SNP main effects would correspond to 5 × 10¹¹ tests of pairwise SNP interactions. As a result, while a typical GWAS that genotypes around one million SNPs is designed to ensure enough power for detecting genetic main effects, straightforward genome-wide scanning of G × G and G × E interactions can be severely underpowered. In response to this pressing challenge, many new statistical methods have been proposed to improve the power of G × G and G × E interaction tests. Many new methods are aimed at reducing the burden of multiple testing. For example, Kooperberg and Leblanc 12 proposed to perform formal G × G tests only for those SNPs with some marginal/main effects. Other authors proposed some alternative or hybrid strategies to filter SNPs for formal G × E testing.13–16 Another line of research is to group SNPs into genes or biological pathways to aggregate multiple weak/moderate signals and reduce the total number of interaction tests. He et al. 17 proposed a gene-based G × G test by first performing principal component analysis (PCA) on multiple SNPs in linkage disequilibrium (LD) in a gene region, and then testing interactions between each pair of PCs in the two genes. In addition to several new gene-based G × E tests, 18–20 Tang et al.21,22 proposed biological pathway-based G × E tests and demonstrated their applications to pancreatic cancer.
In this paper, we propose a parsimonious and powerful gene-based interaction test that can be applicable to both G × G and G × E testing. Our proposed method is motivated by Tukey's one degree-of-freedom (1-df) test for interaction, 23 which was first introduced to statistical genetics by Chatterjee et al. 24 in the context of testing genetic main effects while adjusting for possible G × E effects. The test of Chatterjee et al. 24 is useful in de novo GWAS scanning, aimed at discovering SNPs with any effect, ie, both genetic main and G × E effects or either effect alone. However, in the post-GWAS era, it is often of primary interest to test and discover G × G or G × E interaction effect itself. Here we propose a two-step approach to test G × G/G × E interactions: the first step is to perform PCA on the multiple SNPs within a gene region, along the line of He et al. 17 , and the second step is to perform Tukey's 1-df test specifically for the interaction effect. We derive the score test for the latter, which is fast and numerically stable to compute. Using extensive simulations, we show that the proposed approach, which combines the two parsimonious models, namely, the PCA and Tukey's 1-df form of interaction, outperforms other state-of-the-art methods. We also demonstrate the utility and efficiency gains of the proposed method with applications to testing G × G interactions for Crohn's disease using the Wellcome Trust Case Control Consortium (WTCCC) GWAS data and testing G × E (SNP-set by smoking) interaction using data from a case-control study of pancreatic cancer.
Methods
Existing Methods: SNP-Based and Gene-Based G × G and G × E Tests
We consider a case-control study with a total sample size n including n0 controls and n1 cases (n = n0 + n1). Let Yi denote the binary disease status of individual i: 0 for controls and 1 for cases (i = 1,…, n). Let Z denote the covariate vector, including, eg, sex, age, and leading principal components capturing population substructure. Given two SNPs to be tested for G × G interaction, let X1i. and X2i denote the genotypes of the two SNPs in subject i, each equal to 0, 1, and 2 for major allele homozygotes, heterozygotes, and minor allele homozygotes, respectively. In this paper, we exclusively focus on multiplicative G × G/G × E interactions in the logistic regression framework; see Ref. 25 for tests of additive interactions. A commonly used SNP-based G × G test is based on the following logistic regression model:


Gene-based G × G and G × E tests have also been proposed to reduce the burden of multiple testing and aggregate weak/moderate signals in genes and biological pathways. Assume two sets of SNPs mapped to two genes of interest, denoted as

The null hypothesis to be tested is

Multivariate score test and SSU test for H0: βE1 = … = βEL1 = 0 can be similarly derived. Of note, the SSU test may still suffer from numerical instability, as the genetic main effects need to be estimated under H0.
To overcome the multicollinearity problem, researchers have proposed to first perform PCA on the multiple SNPs in a gene region and then test for interactions based on the leading PCs.17,21,22,27 Specifically, the PCA is used to summarize SNPs in each gene as uncorrelated (orthogonal) linear combinations of the original SNPs accounting for, eg, 90% of the total genetic variation. The number of the resulting PCs, denoted as PC1,…, PCK is usually much smaller than the number of the original genotyped SNPs. He et al.
17
proposed the following gene-based G × G model based on the leading K1 and K2 PCs of the two genes of interest:

To test the null hypothesis

New Method: Tukey's 1-df Interaction Test
Although there are typically fewer interaction terms in Model (5) than in Model (3) (K1 × K2 versus L1 × L2), the former can still be large for interactions involving large genes and may lead to loss of power. Here we propose to employ the parsimonious Tukey's 1-df form of interaction
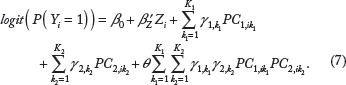
Note that the above interaction model assumes that the interaction effect is proportional to the sum of the product of genetic main effects. A single parameter θ is used to capture the interactions between the PCs of the two genes, leading to the parsimonious Tukey's 1-df form of interaction. For numerical stability and computational efficiency, we propose a score test for H0: θ = 0. We derive the score test statistic as follows:
Let

The log likelihood function for Model (7) is

The score function for testing H0: θ = 0 is

Obtain the inverse of the asymptotic variance for


The score test statistic for H0: θ = 0 is thus

Model (7) can be easily extended to gene-based testing of G × E:

Of note, our proposed Models (7) and (8) are conceptually similar to those proposed by Chatterjee et al.
24
; however, there are two main distinctions. First, while Chatterjee et al directly modeled the genotyped SNPs, we propose to utilize the PCA technique to reduce the dimension and model the uncorrected PCs, which enjoys numerical stability and improved statistical power (as will be shown in the Results section). Second, and more important, the null hypothesis to be tested in Chatterjee et al.
24
was on the genetic main effects of one gene, ie,
Results
A simulation study is often used to evaluate and compare different statistical methods’ Type I error rates and powers based on a large number of simulated datasets from some known models, eg, those with or without G × G interactions. We performed extensive simulations to evaluate the proposed gene-based Tukey's 1-df G × G interaction test and compared it with the state-of-the-art methods of He et al. 17 and Pan et al. 18 We also demonstrated the utility of the proposed method with applications to testing G × G interactions for Crohn's disease (CD) using the WTCCC GWAS data and testing G × E (SNP-set by smoking) interaction using data from a case-control study of pancreatic cancer.
Simulation Setup
We performed simulations based on the HapMap SNP data of two genes IL12B (interleukin 12B; 5q31 1–q33.1) and IL12RB2 (interleukin 12 receptor, beta 2; Ip31.3–p31.2), which were found to interact with each other influencing the risk of CD in our analysis of the WTCCC GWAS data (results to be shown later). In addition, proteins IL12B and IL12RB2 have been reported to physically interact with each other.
32
We obtained the genotype and phased haplotype data for 60 HapMap CEU individuals (release 22) for IL12B and IL12RB2. For each gene, we selected common SNPs to be the genotyped/observed SNPs in the simulated datasets if they had MAFs of at least 5%, and were either genotyped in the WTCCC GWAS or picked up as tagSNPs with pairwise tagging r
2
≥ 0.8 by the program Tagger.
33
We ended up with 16 and 21 genotyped SNPs for IL12B and IL12RB2, respectively. We largely followed the simulation setup in He et al.
17
to simulate a case-control study of 2,000 cases and 2,000 controls in each of the 1,000 simulation replications. We designated either one or two causal SNPs with main/interaction effects in each of the two genes. For the scenario of one causal SNP that was randomly selected in each gene, the case-control status was simulated based on the following logistic regression model:

For the scenario of two causal SNPs that were randomly selected in each gene, we simulated the case–control status based on the following logistic regression model:

Empirical Type I error rate based on 1,000 simulation replications (2,000 cases and 2,000 controls in each replication).

All interaction terms were 0 to evaluate the Type I error rate. Significance level α = 0.05.
We included the following gene-based G × G tests in the simulation study: (1) the score test for the proposed PC-based Tukey's 1-df interaction Model (7), (2) the generic LRT for PC-based pairwise interaction Model (5) of He et al. 17 , and (3) the SSU test for SNP-based pairwise interaction Model (3) of Pan et al. 18 as a representative of variance-component score tests for high-dimensional hypothesis testing. For PC-based tests, we first applied the PCA to the genotype data of each gene region to derive the top PCs that explained at least 90% of the total genetic variation.
Simulation Results
As shown in Table 1, all three methods controlled the Type I error rate at the nominal level α = 0.05 satisfactorily across the six simulation configurations. We also performed simulations when there was one or two covariates, and the proposed score test for Tukey's 1-df interaction controlled the Type I error rate satisfactorily as well (results not shown).
Figures 1–6 show the power comparison of the three tests across different simulation configurations. Overall, the proposed Tukey's 1-df score test was the most powerful one among the three methods under comparison, and the SNP-based SSU test was the least powerful one, suggesting that the proposed strategy combining the two parsimonious statistical models, namely the PCA and Tukey's 1-df form of interaction, was effective in improving the power of gene-based interaction test. The power difference was larger when there was only one disease locus/causal SNP in each gene (Figs. 1–3) than when there were two disease loci/causal SNPs in each gene (Figs. 4–6) whether or not there was main effect. In particular, there was only a slight power difference between the generic LRT and the SSU in the latter scenario. This suggested that the SSU and its closely related variance-component score tests, such as the kernel machine-based methods, might have more improved power when the interaction signals were less sparse (four true interaction pairs versus one in the simulations here). It is noticeable that the power curve for the SSU test in Figure 3 was not monotonically increasing as the interaction signal increased. This may be explained by numerical problems in estimating the genetic main effects of multiple SNPs in high LD in Model (3). On the other hand, we did not observe this abnormal phenomenon for the PC-based Tukey's 1-df score test and generic LRT, supporting that using PCs can not only reduce the dimension but also ensure numerical stability. In addition, although the proposed Tukey's 1-df form of interaction is a function of the genetic main effects, it remained more powerful than the other two competing methods even when there was no genetic main effect (Figs. 3 and 6) or only one gene had genetic main effects (Figs. 2 and 5). The reason for this interesting phenomenon is that, even when there was only interaction effect and no main effect in the simulation/true model, the expectation of the marginal genetic effect, ie, the main effect in the fitted null model, was not zero due to the absorption of the true interaction effect into the marginal effect. Therefore, Tukey's test could still retain the statistical power to detect the interaction effect in the absence of main effects. Finally, the ratio of runtime for Tukey's 1-df score test, generic LRT, and SSU test was nearly in the ratio 1:2:3, with the proposed Tukey's test being the fastest.

Power curve as a function of the interaction parameter

Power curve as a function of the interaction parameter

Power curve as a function of the interaction parameter

Power curve as a function of the interaction parameter

Power curve as a function of the interaction parameter

Power curve as a function of the interaction parameter
Application to Testing G × G for Crohn's Disease
CD is a type of inflammatory bowel disease and is also considered as an autoimmune disease with a strong genetic component. 34 Although large-scale meta-analyses of GWASs have identified a large number of susceptibility loci for CD, about 78.5% of the estimated heritability is still missing and it has been shown that 80% of the missing heritability could be due to G × G interactions. 8 As a proof of concept, we applied the proposed Tukey's 1-df gene-based G × G test and the generic LRT to the WTCCC case-control GWAS of CD. 35 The GWAS dataset contains 2,000 CD cases and 3,000 controls with a total of 500,568 SNPs. We followed the WTCCC quality control criteria to remove unqualified subjects and SNPs, resulting in 469,612 SNPs in 1,748 cases and 2,938 controls.
To explore the G × G interactions among known CD susceptibility genes, we retrieved the 31 genes reviewed in Ref. 34. We followed Ref. 27 to assign SNPs to genes: an SNP is assigned to a gene if it is located within 20 kb of the gene's transcription start and end sites. A total of 653 SNPs were assigned to the 31 genes. Since these genes were identified by large-scale meta-analysis of GWASs and candidate pathway studies, not all of them may be associated with CD in the WTCCC GWAS. To test for genetic marginal associations, we applied PCA to the SNPs in each of the 31 genes, retrieved the leading PCs that explained at least 90% of the genetic variation, and performed PC-based multilocus association test of the genetic main effects. Twelve nominally significant genes that had P-values <0.1 were tested for pairwise G × G interactions, as in Ref. 12. Table 2 lists all pairs of G × G interactions with interaction P-values <0.1 by either Tukey's 1-df score test or the generic LRT. As a comparison, we also listed the SSU test P-values, which were very similar to those of the generic LRT. As expected with this moderate sample size, none of the tests identified any G × G interaction with a P-value less than 0.01. On the other hand, previous research showed that G × G interactions tend to be enriched among neighboring genes on protein-protein interaction (PPI) networks. 36 While none of the five nominally significant G × G interactions by the generic LRT (PLRT < 0.1) was found to coincide with PPIs in the STRING database, 32 three of the nine nominally significant interactions by Tukey's 1-df test (PTukey < 0.1) appeared to be supported by PPIs: the proteins of three pairs of genes, including IL12B-IL12RB2, IL12B-IL23A, and IL12B-IL12RB1, were found to physically interact with each other. Due to the small counts, this enrichment was not statistically significant. Nevertheless, these biologically plausible G × G interactions would be worth following up in independent and larger samples.
Top G × G interactions for Crohn's disease (P-values <0.1 by either Tukey's 1-df score test or generic LRT) ordered by Tukey's 1-df test P-values.

Application to Testing G × E in a Case-Control Study of Pancreatic Cancer
Pancreatic cancer is the fourth leading cause of cancer-related deaths for both men and women in the US with a 5-year survival rate of 6%. 37 Known risk factors for pancreatic cancer include cigarette smoking, long-term Type 2 diabetes, obesity, heavy alcohol consumption, and family history, with smoking conferring the highest risk. It is of interest to investigate whether there exist genes that interact with environmental exposures, such as smoking, influencing the risk of pancreatic cancer. Here we tested the pancreatic cancer susceptibility SNP-set by smoking interaction (G × E) using data from a case-control study conducted at The University of Texas MD Anderson Cancer Center during 2004–2009.38,39 Cases were patients with pathologically confirmed pancreatic adenocarcinoma, and controls were healthy individuals frequency matched to cases by age, race, and sex. These individuals were genotyped for a total of 19 SNPs in 10 susceptibility genes identified in previous GWAS of pancreatic cancer,40,41 including ABO, NR5A2, and CLTPM1L-TERT, as well as candidate genes FTO, ACDC, PPARG, PRKAA2, PRKAB2, PRKAB1, and LOC730242. Genotyping was performed on genomic DNA from peripheral blood samples using the TaqMan method. 42
To test the interaction between smoking and the pancreatic cancer susceptibility SNP-set defined by the 19 SNPs in the 10 genes, we applied the proposed Tukey's 1-df score test (Model 8), the generic LRT [Model (6)] and the SSU test [Model (4)] to the above-described UT MD Anderson study of pancreatic cancer with 534 cases and 552 controls. For the former two PC-based tests, we included the leading 11 PCs that explained 87% of the total genetic variation in the interaction model with smoking status (never/ever). Tukey's 1-df test and the generic LRT test gave similarly significant results: the P-values were 0.019 and 0.018, respectively. On the other hand, the SSU test result was not significant, with a P-value = 0.148. When applied to the 11 PCs, the SSU test had a significant P-value of 0.024. Of note, one of the 19 SNPs was the top hit in the GWAS of pancreatic cancer 40 (rs505922 in gene ABO), and its interaction with smoking on the risk of pancreatic cancer was highly significant (P-value = 0.002 by SNP × smoking test based on Model (2) and P-value = 0.038 after the Bonferroni correction). This significant interaction identified by the SNP-set-based G × E tests warrants further replication in independent samples.
Discussion
In this paper we proposed a powerful gene-based test for detecting G × G or G × E interactions by combining two parsimonious statistical models, namely, the PCA and Tukey's 1-df form of interaction. We derived a score test that is computationally fast and numerically stable for the proposed Tukey's 1-df interaction model. Using extensive simulations based on the HapMap phased haplotype data, we showed that the proposed score test for Tukey's 1-df interaction model controlled the Type I error rate at the nominal level satisfactorily and was more powerful than the PC-based generic LRT that tests pairwise interactions and the multiple-SNP-based SSU test as a representative of variance-component score tests. We demonstrated the utility and efficiency gains of the proposed test with applications to detecting G × G interactions for CD using the WTCCC GWAS data and to detecting SNP-set by smoking (G × E) interaction using a case-control study of pancreatic cancer. As demonstrated in the latter application, we recommend first using gene-based interaction tests to identify significant genes, and then performing SNP-based interaction tests within the genes to identify which SNPs significantly interact.
We have focused on gene-based G × G/G × E tests for common SNPs (MAF >5%) based on GWAS data. It would be of interest to extend the Tukey's 1-df test to testing G × G/G × E interactions for rare variants (MAF <5% or 1%) based on the next-generation sequencing (NGS) data. Although PCA is an effective approach to summarize a large number of common SNPs into a few uncorrected PCs to be used in subsequent testing of genetic main effects or G × G/G × E interactions, it may not work well in capturing the genetic variation dominated by rare variants. A possible alternative is via functional principal component analysis (FPCA), which has been shown to be a powerful method for reducing the dimension of a large number of rare variants.43,44 Further research is warranted.
The proposed method has some potential limitations. First, the PCA step is solely based on the SNP data and does not take the disease-SNP correlations into account. As a result, it is possible that the leading PCs may not capture the information of the most relevant SNP(s) in association with the disease. Alternative dimension reduction techniques, eg, the partial least squares (PLS) method, 45 could be employed to find linear combinations of the SNPs that are most correlated with the disease status. However, because of the use of the disease status in the first-stage PLS, the test statistic in the second-stage interaction model will no longer follow a χ 2 -distribution under the null hypothesis of no interactions, and computationally intensive permutation or parametric bootstrap procedure is needed to obtain the null distribution of the test statistic. 7 Second, the parsimonious Tukey's 1-df form of interaction model assumes that the interaction effect is approximately proportional to the genetic main effects. Although it appeared to be powerful and robust across different simulation scenarios in our study, even in the absence of genetic main effects, it might lose power under some scenarios as investigated in Ref. 45. As the true interaction model is hardly known a priori in real data analysis and likely varies across genes, the proposed method is a competitive and complementary approach to existing gene-based interaction tests.
The current paper focuses on case-control analyses. It is well known that for SNP-based G × E analysis, the case-only test is more powerful than the standard case-control interaction test [Model (2)] if the assumption of gene-environment independence holds in the general population. 46 Specifically, the case-only analysis tests the association between the environmental exposure and the SNP of interest in the cases. It would be interesting to extend the SNP-based case-only test to a gene-based test by testing the association between the environmental exposure and the leading PCs for the multiple SNPs in a gene. Another possible direction of future research is to extend the existing SNP-based tests for nonremovable interactions 47 to gene-based tests. Finally, as the Tukey's 1-df interaction model is in the regression framework, it is not limited to binary disease phenotypes and can be easily extended to G × G/G × E tests for quantitative traits. R programs implementing the proposed Tukey's 1-df score test will be posted on our website at: https://sites.google.com/site/utpengwei/.
Author Contributions
Conceived and designed the experiment: PW. Analyzed the data: YW, PW. Wrote the first draft of the manuscript: PW YW Contributed to the writing of the manuscript: PW, YW, DL. Agree with manuscript results and conclusions: PW, YW, DL. All authors reviewed and approved of the final manuscript.
Footnotes
Acknowledgments
The authors thank the anonymous reviewers for their constructive comments. The authors acknowledge the Texas Advanced Computing Center (TACC) at The University of Texas at Austin for providing HPC resources that have contributed to the research results reported within this paper. This study makes use of data generated by the Wellcome Trust Case Control Consortium. A full list of the investigators who contributed to the generation of the data is available from ![]() . Funding for the project was provided by the Wellcome Trust under award 076113.
. Funding for the project was provided by the Wellcome Trust under award 076113.