
Abstract
Hypothesis tests of equivalence are typically known for their application in bioequivalence studies and acceptance sampling. Their application to gene expression data, in particular high-dimensional gene expression data, has only recently been studied. In this paper, we examine how two multigroup equivalence tests, the F-test and the range test, perform when applied to microarray expression data. We adapted these tests to a well-known equivalence criterion, the difference ratio. Our simulation results showed that both tests can achieve moderate power while controlling the type I error at nominal level for typical expression microarray studies with the benefit of easy-to-interpret equivalence limits. For the range of parameters simulated in this paper, the F-test is more powerful than the range test. However, for comparing three groups, their powers are similar. Finally, the two multigroup tests were applied to a prostate cancer microarray dataset to identify genes whose expression follows a prespecified trajectory across five prostate cancer stages.
Introduction
Thousands of methodology and application studies have been published since the arrival of high-throughput technology, such as microarray; however, only a handful of these articles involved equivalence tests.1–5 Examples of situations where equivalence tests would be valuable include identifying housekeeping genes, identifying common molecular mechanics between diseases, and identifying genes with a specified expression trajectory across time or conditions. In a low-dimensional setting, equivalence tests have been successfully applied to RT-PCR data for identifying constantly expressed genes. 6 In high-dimensional settings, equivalence tests have been applied to microarray data for identifying common genes underlining different diseases 2 or genes whose expressions followed a specific pattern across time points. 3 For methodology development, Qiu and Cui evaluated the performance of two one-sided t-tests (TOST) in identifying equivalently expressed genes from microarray data. 4 They showed that with a reasonable equivalence limit, TOST has relative high power while keeping the false discovery rate (FDR) low.
Although two-group equivalence tests have been applied to microarray data with promising results, there are no published studies involving tests of equivalence with more than two groups in high-dimensional data. One reason for the relatively small amount of literature on multigroup equivalence tests in general is that two-group equivalence tests can be extended to k groups (k > 2) using the intersection-union principle.7–9 This principle establishes that testing all possible pairs using a two-group equivalence test such as TOST at level alpha will result in a level alpha test for multiple groups. However, applying the intersection-union principle to construct an overall k group equivalence test usually results in an overly conservative test because the actual size for individual pairwise test is at most alpha unless one of the individual tests is exactly level alpha.8,9 In addition, this test is based on TOST, which has been shown to have low power because of the boundary definition for alpha. 10 Perhaps a better test for k group equivalence is the F-test for equivalence proposed by Wellek. 9 The F-test for equivalence is the noncentral version of the classical one-way ANOVA F-test. It utilizes the squared Euclidean distance as a summary of the overall distance between k group means. The noncentral F-test for equivalence is the uniformly most powerful invariant test of its kind. Additionally, as a modification of the F-test, it shares the same desirable properties such as being an unbiased and level alpha test. Another multigroup equivalence test is the range test for equivalence, which is similar to the studentized range test for differences. It uses the maximum mean difference between group means as the measure of similarity between groups. Therefore, rejecting the null hypothesis of equivalence guarantees all the group means significantly equivalent. This will result in a more stringent test in the equivalence testing scenario than in the usual one-way ANOVA scenario. In this paper, we evaluate the range test and the F-test for their performance on microarray data in comparison with TOST using simulations and a cancer dataset analyses.
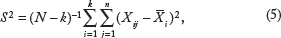
Methods
To illustrate the methods used, we consider a general situation for a gene expression microarray study comparing k groups with an equal number of samples per group. Suppose we have G genes and the observations, X
ijg
, are from a normal distribution,
The F Test
We denote the overall mean of the k groups as
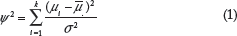
Equation (1) is a measure of the overall deviation of the group means from

With equal number of samples per group, our estimate of the parameter ψ
2
is given by
The Range Test
Unlike the F-test that summarizes the magnitude of the difference among group means using an overall Euclidean distance, the range test summarizes the magnitude of the pairwise differences using the maximum difference among all the paired group means. 9 If we wish for all paired differences among μ1,…,μk be within some limit δ, we just need to ensure that the maximum paired difference is less than δ.
The hypothesis for the range test is

Two one-sided t-tests
In the multigroup setting, the hypothesis for TOST is H
O
:|μ
i
−μ
m
| ≥ η vs H
A
: |μ
i
−μ
m
| <η. The null hypothesis is rejected, and equivalence is concluded if
Definition of Equivalence Limit – The F Test
Both F-test and the range test are considered tests for “scaled equivalence.” This is because the hypotheses are formulated for a standardized effect size. Hence, we use a moment-based criterion called difference ratio (DR)
12
for our definition of the equivalence limit. Under the assumption of equal variance, the population DR is given by


Since there are k choose 2 pairs of group means for μ
i
and μ
m
, we can extend (6) to

The FDA suggests a DR of 1.25 for clinical equivalence testing; however, we use a range of DR values in our simulation study to determine what values of DR are the most practical and meaningful for gene expression analysis.
Definition of Equivalence Limit – the Range Test
As we did with the F-test, we use the same DR to establish our equivalence criteria for the range test. Hence, the range test statistic can be related to the DR as

Definition of Equivalence Limit – TOST
As TOST is used to test for equivalence between each pair of group means, k = 2, the equivalence limit for TOST was set as
Simulation Studies
Simulation Design
Simulation studies were carried out to evaluate the tests in terms of type I error and power. Although the F-test and range test hypotheses that differ in their measures of distance between group means cannot be compared directly, they can still be evaluated for their individual performances. To put them on a more comparable footing, we used the same simulated data to evaluate both tests and to compare them with TOST.
Data were simulated for two different scenarios. In the first scenario (single-gene simulations – Scheme 1), the data for each treatment group were generated independently from a normal distribution. This simulation can be associated with data from just a single gene. In the second scenario (high-dimensional simulations – Scheme 2), high-dimensional data were generated based on residuals from a real dataset. 15 More details of the simulations are provided in Appendix A.
Simulation Settings
Single-Gene Simulation Parameter Settings
A total of 10,000 simulations were conducted for each unique parameter setting. For sample size n, we chose values that would typically be found in a microarray dataset, n = (3, 6, 8, 10, 15, 20). For the group size, k, we used the settings of k = (3, 4, 5). The DR was varied using the settings of DR = (1.25, 1.4, 1.55, 1.7, 1.85). The variance settings, σ 2 (0.04, 0.12, 0.24), were set based on representative values from a real microarray dataset. They represent the first, second, and third variance quartiles of the real microarray dataset used for the high-dimensional simulations. Means for each treatment group were simulated with values of a = (0.45, 0.35, 0.25, 0.20, 0.15, 0.10, 0.05, 0). The effect size of the F-test is summarized by the square root of ψ 2 in Equation (1), while the effect size of the range test is the square root of the maximum mean difference in Equation (4) between any two group means.
Group means were simulated as following for comparison purpose:
For k = 3 groups, data were simulated so that n observations were from normal distribution N(a/2, σ 2 ) for groups 1 and 2 and n observations were from normal distribution N(–a, σ 2 ) for group 3.
For k = 4 groups, n observations were from normal distribution N(a, σ 2 ) for groups 1 and 2 and n observations were from normal distribution N(–a, σ 2 ) for groups 3 and 4.
For k = 5 groups, n observations were from normal distribution N(a, σ 2 ) for group 1, n observations from normal distribution N(a/2, σ 2 ) for groups 2 and 3, and n observations from normal distribution N(–a, σ 2 ) for groups 4 and 5.
Thus, the square root of the noncentrality parameter for the F-test is
High-Dimensional Simulation Parameter Settings
The same DR and group mean values were used as the single-gene simulations. The number of samples in each group was set as the same as the replicates in the microarray dataset, n = 5. Variance σ 2 was estimated from the random subset of genes. The simulations were conducted for 1000 genes and 500 simulations. For more details of how high-dimensional data were simulated, please refer to “Scheme 2 simulation” in Appendix A.
Prostate Cancer Dataset Analysis
A published prostate cancer dataset (GSE6099) was generated from laser capture microdissection samples hybridizing to Chinnaiyan Human 20K Hs6 array (GPL2013). It has 104 samples from various stages of prostate cancer cells and putative progenitors as well as some controls. The goal of the project was to study the expression profiling of prostate cancer progression from benign to metastasis. 16
We downloaded the normalized data from Gene Expression Omnibus (GSE6099) and only focused on samples from benign, prostatic intraepithelial neoplasia (PIN), low grade, high grade, and hormone-refractory (HR) stages. We filtered out 2832 genes with >30% of samples at background hybridization level in all stages. For the remaining genes, we conducted an example analysis using a combination of equivalence and differential expression tests. We picked one pattern of expression, lower in benign stage, higher but equal in PIN, low-grade prostate cancer (PCA), and high-grade PCA stages, and lower in the metastatic PCA HR stage, to illustrate the application of multigroup equivalence testing. A one-sided t-test was used for differential expression testing, lower in benign stage and lower in the metastatic PCA HR stage. Both the range test and the F-test were tried for the equivalence testing, equal expression among PIN, low-grade PCA, and high-grade PCA stages. The equivalent limit DR was set as 1.55 for intermediate stringency. The significant genes were analyzed for Gene Ontology (bioprocess) terms and KEGG pathway using DAVID (http://david.abcc.ncifcrf.gov/).
Results
To evaluate the F-test and range test for their performance on microarray data, we conducted two types of simulations. One is for a single gene under the assumption of normality. The other one has 1000 genes and is based on a real microarray data set. We also applied the tests to a prostate cancer microarray dataset.
For Normally Distributed Data, the F Test Achieves Good Power While Controlling the Type I Error
The noncentral F-test is a well-known statistic and provides a fairly intuitive method for detecting equivalence among multiple groups, namely, group size >2. To evaluate the potential utility of the noncentral F-test in the equivalence analysis of microarray data, we first conducted some single-gene simulations based on normal distributions for simplicity.
The Power of the F-test Increases with Sample Size
As expected, when the group sample size increases, the power of the F-test increases in all settings (Fig. 1). For example, in panel (e) when sample size is 3 (red line), the maximum power that can be achieved is 0.38 for the variance of 0.12 and group size of 4. However, the power increases to 0.79 for sample size of 6 (orange line) with the same settings of the other parameters. It goes up to 0.92 and 0.98 when sample sizes are 8 and 10 (green and purple lines), respectively. The power gain diminishes when sample size further increases from 15 to 20, which is represented by the close black and blue lines in Figure 1.

Power curves for the F-test from single-gene simulations. The columns represent the different group sizes (k = 3, 4, 5), and the rows represent different variances (σ 2 = 0.04, 0.12, 0.24). The sample sizes (N values) are indicated by the legend in the first panel. The simulated mean value represents the group mean values denoted as “a” throughout the text. The DR is set as 1.55.
The Power of the F-test Increases as the Variance Increases
As the F-test is a scaled hypothesis test, intuitively, increasing the variance reduces the effect size; therefore, it is easier to reject the null hypothesis. This is confirmed by the differences in the speed of power decreases in different rows of panels in Figure 1. For example, all the power lines approach to 0 around mean value of 0.35 in Figure 1E while they approach to 0 around mean value of 0.5 in Figure 1F.
The Power of the F-test Increases along the Increase of DR
For the simulations, we tried different equivalence criteria that depend on DR. The results showed that the choice of DR has a major impact on the F-test power (Table 1). For a mean value of 0.10, increasing the DR from 1.25 to 1.55 elevates the power from 0.15 to 0.54 for a fixed representative variance of 0.12, group size of 4, and sample size of 6. Further, increasing the DR to 1.85 increases the power to 0.86. The results for the other mean values are similar.
Power of the noncentral F-test.

The Type I Error of the F-test is on Target
The type I error of the F-test was evaluated using simulations with effect size set on the boundary of the null hypothesis. Table 2 shows the results for DR of 1.55. It is clear that the rejection rate is fluctuating around the target alpha value of 0.05. The fluctuation in the range of values for type I error seems independent of variance, sample or group size, and more likely because of variability within the simulation itself. Similar results were obtained for other DR settings (data not shown).
Type I error for the noncentral F-test and range tests from single-gene simulations.

The Power of the F-test is Affected by Increasing the Number of Groups
To investigate how group number affects the power of the F-test, we simulated data with mean values that would give the same effect size across groups. To compare power for different group numbers, we used the square root of the noncentrality parameter in Equation (8) as our measure of effect size. Figure 2 shows the power of the F-test for a DR of 1.55, variance of 0.12, and sample size of 6. The power curves for each of the group numbers (3, 4, and 5) show that increasing the number of groups increases the power of this test. For example, for an effect size of 0, the power is 0.61 when group size is 3, 0.78 when group size is 4, and 0.88 when group size is 5.

The power of the F-test is affected by a number of groups. In this figure, the power is given for a DR of 1.55, variance of 0.12, and sample size of 6. k, group numbers. Adjusted effect size is calculated as the square root of the noncentrality parameter as given in the methods on simulations.
The Range Test Also Achieves Moderate Power but with Conservative Type I Error for Single-Gene Simulations
Unlike the F-test that controls the difference among group means through the noncentrality parameter, the range test controls the mean difference using the standardized maximum differences among groups. The rejection region of the range test is more intuitive than that of the F-test. To compare the range and F-test on as equal a footing as possible, we used the same simulated dataset to evaluate both tests.
In Table 2, we observed the type I errors for both tests when the DR is set at 1.55 and alpha at 0.05. The type I error for the range test is overly conservative for group sizes >3. In fact, regardless of variance or sample size, the type I error decreases as group size increases.
The Power of the Range Test Increases with Sample Size
Similar to the F-test, increasing sample size increases the power of the range test (Fig. 3). For example, the power increases from 0.15 to 0.36 when sample size is increased from 3 to 6 for a DR of 1.55, variance of 0.12, group size of 4, and simulated mean value of 0.10 (Fig. 3E). The power further increases to 0.58 when sample size is increased to 10.
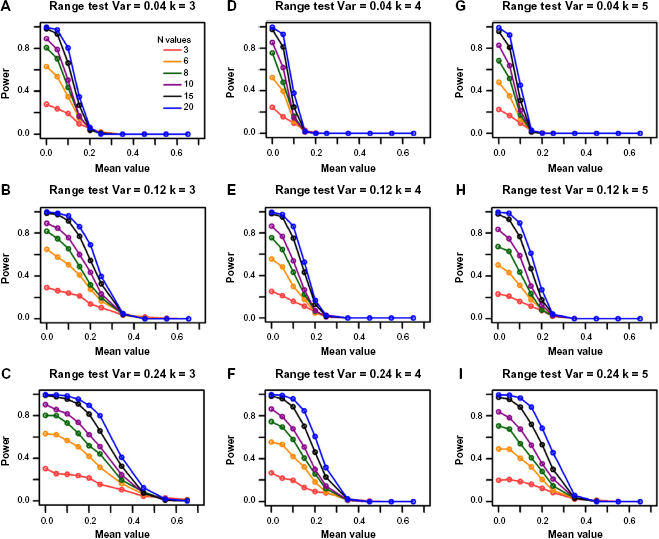
Power for the range test from the single-gene simulations. The columns represent the different group sizes, k = 3, 4, 5, and the rows represent different variances, σ 2 = 0.04, 0.12, 0.24. The sample sizes (N values) are indicated by the legend in the first panel. The simulated mean value represents the group mean values denoted as “a” throughout the text. The DR is set as 1.55.
The Power of the Range Test Increases along with Variance
Like the F-test, the range test for equivalence is a scaled hypothesis test. As such, a larger variance yields an overall smaller effect size, which increases the power to reject the null hypothesis. Figure 3 shows that the decrease of power along the increase of mean values lessens as the variance increases in general. For illustration, consider the orange lines in Figure 3D and E; the power of the range test increases from 0.12 to 0.36 when the variance is increased from 0.04 to 0.12 for a DR of 1.55, group size of 4, and simulated mean value of 0.10. The power further increases to 0.43 when variance is increased to 0.24 (Fig. 3F) for the same parameter settings.
Increasing DR Increases the Power of the Range Test
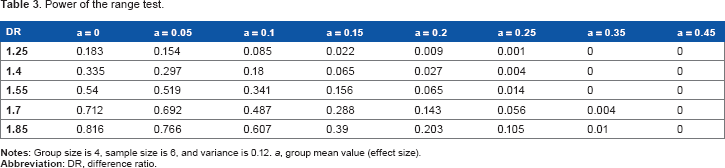
The DR greatly affects the power of the range test (Table 3). For example, for a simulated mean value of 0.15, the power increases from 0.02 to 0.16 when DR is increased from 1.25 to 1.55 and increases to 0.39 when the DR is increased to 1.85 for a representative sample size of 6, variance of 0.12, and group size 4. The same trend is obtained under other parameter setting combinations.
Power of the range test.
Power of the Range Test Decreases with Increasing Group Numbers
The power of the range test behaves in a similar fashion to that of the F-test for most of the parameter settings. However, one of the main differences is that the power of the range test diminishes when the number of groups increases. The decrease in power for each increase in group number is more acute when the change is between the lower group numbers. For example, power declines from 0.51 to 0.37 when the number of groups increases from 3 to 4 and the decline is more moderate (to 0.33) when the number of groups is 5 for a DR of 1.55, variance of 0.12, and sample size of 6. These results and similar ones can be seen in Table 4.
Power of the range test depends on group numbers.

The Range Test is Less Powerful than the F-test for Larger Group Sizes
The power of the range test is within 0.15 of the F-test regardless of the other parameter settings when group size is 3. Figures 1 and 3 illustrate this result. However, the power of the F-test is sometimes twice that of the range test for the same parameter settings when the group number is larger than 3. For example, the power of the F-test is 0.7, which is more than twice the power of the range test (0.33) for a group size of 5, variance of 0.12, sample size of 6, DR of 1.55, and a simulated mean value of 0.10.
F-test and Range Tests are More Powerful at Smaller Sample Sizes but Less Powerful at Higher Mean Values than TOST
The simulation results from TOST are shown in Figure 4. Compared with Figures 1 and 3, it has lower power than F-test and range test at smaller sample sizes, such as 3, especially when the variance is relatively high. It has no power when sample size is 3 and variance is 0.12 or larger. However, TOST retains power much better against the increase of mean values than the F-test and range test, especially when the variance is small (top two rows in Fig. 4). These results are consistent with the fact that TOST is an average equivalence test. It has higher power when variances are smaller, which is opposite to the F-test and range test.

Power for the TOST from the single-gene simulations. The columns represent the different group sizes, k = 3, 4, 5, and the rows represent different variances, σ 2 = 0.04, 0.12, 0.24. The sample sizes (N values) are indicated by the legend in the first panel. The simulated mean values represent the group mean values denoted as “a” throughout the text. The DR is set as 1.55.
High-Dimensional Simulation Results
In order to study the power of these tests in a more realistic microarray data setting, we used a sample of 1000 genes (more details are given in the “Scheme 2 simulation” in Appendix A) from the Caloric Restriction Mimetic dataset 15 and explored how the power behaved for different values of the means and DRs. The sample and group sizes are set the same as the original data, 5 and 3, respectively. The variance of each gene is estimated from the real data sample. Thus, in this scenario, the power analysis is viewed as more of an “average” power across the genes.
The results show that F-test and range test have similar power curves (Fig. 5), which are consistent with the results from single-gene simulations in that their powers are most similar for group size of 3. The only obvious difference is at very low DR setting, DR = 1.25, where the range test has lower power. On the other hand, these two tests have very different power curves from TOST. Their powers are much higher at low mean values but lower at higher mean values, which indicate that F-test and range test tend to identify genes with smaller fold changes but larger variances compared to TOST.
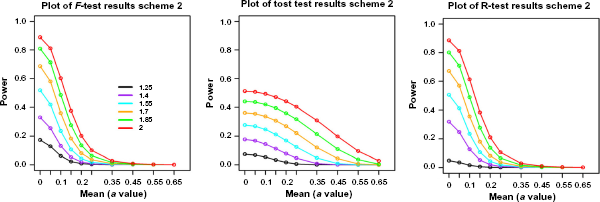
Power comparison among range test, F-test, and TOST tests from the high-dimensional simulations. Colored lines represent different values of the DR. The “a” values are the simulated group mean values. Sample size is 3.
Prostate Cancer Data Analysis
Prostate cancer has many progressing stages, such as the benign stage, putative precursor PIN, localize PCA at various grades, and metastatic HR prostate cancer stage. To understand the altered molecular processes during prostate cancer progression, Tomlins et al profiled the gene expression in 101 microdissected samples. 16 They integrated the gene expression analysis with the molecular concepts to identify a set of biological processes, including protein biosynthesis, E26 transformation-specific (ETS) transcriptional targets, androgen signaling, and cell proliferation, that distinguish the different stages of prostate cancer. They used pairwise differential expression to select signature genes that are differentially expressed between stages without formal analysis for equal expression for drawing profile trajectories associated with each group of signatures.
As an example of the application of our equivalence tests, we used a combination of differential testing and equivalence testing to formally identify genes that follow a specific trajectory among the prostate cancer progression stages. The trajectory we picked is similar to the protein synthesis trajectory (low in benign stage, higher but equal across the PIN and two localized PCA stages, and lower again in the metastatic HR stage; Fig. 7 in the study by Tomlins et al. 16 ) At FDR of 0.05, we identified 639 and 652 significant genes using range test and. F-test, respectively. These two lists largely overlap with 636 genes in common. The heatmap of these genes (Supplementary Fig. 1) shows a similar pattern to that of protein biosynthesis and ETS targets in Figure 7 in the study by Tomlins et al. 16 Gene Ontology and KEGG pathway analysis using DAVID (http://david.abcc.ncifcrf.gov/) show that these genes are highly enriched for protein biosynthesis as expected. In addition, they are also highly enriched for protein phosphorylation and protein catabolism (Supplementary Table 1), which are consistent with protein biosynthesis and ETS targets. This analysis demonstrates the application of multigroup equivalence in identifying additional genes that follow the specified trajectory based on a small group of genes.
Discussion
We have taken two most promising approaches for multigroup equivalence testing, the noncentral F-test and the range test, for equivalence and have evaluated them against TOST using simulation study and applied them to a real microarray dataset. 16 The simulation data were generated using two scenarios: single-gene simulation and high-dimensional simulation. The noncentral F-test and range test 9 were evaluated in terms of type I error and power. We compared the power of these tests with the two-group test, TOST. Our simulation results indicate that, for the range of parameter settings investigated, the noncentral F-test performs better than the range test in detecting equivalently expressed genes in microarray data. Additionally, while TOST performs better than the F-test and range test for low variance and high sample size, both the noncentral F-test and the range test perform better for settings that are more typical of real microarray data (small sample size and medium variance settings). The noncentral F-test and range test were applied to a prostate cancer dataset 16 to identify genes that show differential expression between some stages but equivalent expression among others. Our results provided consistent results with the signatures defined by the original publication but added hundreds of additional genes that have similar expression patterns to the signatures. These additional genes can help investigators to thoroughly examine the processes that follow this specific expression trajectory. Given that our method is well defined, equivalence limits and significance levels can be easily adjusted by investigators to refine the trajectory to be investigated. In a traditional differential-based analysis, identifying equal expression often rely on ad hoc criteria and clustering for similarity, which can fall apart when looking for constant expression across groups or stages. The equivalence noncentral F-test and range test can be especially helpful when similar molecular mechanisms are sought between different diseases. Instead of comparing the significant gene lists or gene set enrichment results, expression data can be compared directly to identify genes that have same expression profiles among different diseases, which should increase power.
In our single-gene simulations, we observed that the type I error for the F-test is on target throughout all the parameter settings, while the range test becomes overly conservative along with the increase of group number. This behavior is a function of the rejection region of the range test; the number of pairwise comparisons increases substantially for every increase in group number. While the hypotheses of the range test and F-test require a different equivalence criterion, we used the same simulated data and mean values to compare the performance of these tests on as equal a footing as possible. Both the single-gene and high-dimensional simulation results indicate that for microarray data, the range test performs equally well as the F-test for comparing three groups. Since the range test has a more interpretable effect size, it might be preferable over the F-test in this scenario. For comparing more than three groups, the range test tends to be more conservative and has less power than the F-test (Figs. 1 and 2), which makes it less useful for a large number of groups.
Both the F-test and range test are scaled tests, which controls the ratio of group difference to within-group standard deviation. One concern of using these tests might be that equivalence detections are solely because of the high variability. One simple strategy to overcome this concern is to simply filter out genes with variance higher than a certain percentile. A more sophisticated strategy is to apply variance shrinkage, which is not so different from handling the very small variances using shrinkage for detecting differentially expressed genes. We expect that variance shrinkage can have the same benefit in the F-test and range test as shown in TOST 5
For controlling the multiple testing problem, we used FDR based on the BH procedure of Hochberg and Benjamini. 17 Benjamini et al. 18 showed that this procedure controls the FDR at a level lower than the chosen alpha when the distribution of the composite null hypothesis is stochastically smaller than the null distribution of each P-value, which is the case for equivalence testing. Thus, the BH procedure can effectively control the false discovery although it is conservative.
Author Contributions
Conducted the analyses and wrote the manuscript: CY. Assisted with the project and provided critical comments: AAB. Conceived the project, guided the study, and participated in the manuscript writing: XC. All authors reviewed and approved of the final manuscript.
Footnotes
Acknowledgments
The authors thank Jing Qiu, PhD (University of Missouri - Columbia), for valuable suggestions; Immaculada Aban, PhD, Degui Zhi, PhD, Lisa Schwiebert, PhD, and Victor Darley-Usmar, PhD (University of Alabama at Birmingham), for comments.