
Abstract
Numerous statistical methods have been published for designing and analyzing microarray projects. Traditional genome-wide microarray platforms (such as Affymetrix, Illumina, and DASL) measure the expression level of tens of thousands genes. Since the sets of genes included in these array chips are selected by the manufacturers, the number of genes associated with a specific disease outcome is limited and a large portion of the genes are not associated. nCounter is a new technology by NanoString to measure the expression of a selected number (up to 800) of genes. The list of genes for nCounter chips can be selected by customers. Due to the limited number of genes and the price increase in the number of selected genes, the genes for nCounter chips are carefully selected among those discovered from previous studies, usually using traditional high-throughput platforms, and only a small number of definitely unassociated genes, called control genes, are included to standardize the overall expression level across different chips. Furthermore, nCounter chips measure the expression level of each gene using a counting observation while the traditional high-throughput platforms produce continuous observations. Due to these differences, some statistical methods developed for the design and analysis of high-throughput projects may need modification or may be inappropriate for nCounter projects. In this paper, we discuss statistical methods that can be used for designing and analyzing nCounter projects.
Introduction
Genome-wide microarray is a technology to measure the expression level of a large number (20,000–50,000) of genes and to discover those that are differentially expressed and associated with clinical outcomes. From an analysis of microarray data, we may identify a specific set of gene signatures whose expression levels are associated with a particular clinical outcome of interest. These signatures can comprise tens to hundreds of genes, a range that is appropriate for technical validation using NanoString nCounter Gene Expression Assay.
nCounter Gene Expression Assay (Nanostring Technologies, Seattle, WA, USA) is a robust and highly reproducible method for detecting the expression of up to 800 genes in a single reaction with high sensitivity and linearity across a broad range of expression levels. The nCounter assay is based on direct digital detection of mRNA molecules of interest using target-specific, color-coded probe pairs, so that the expression level of each gene is measured by counts. Due to its high reproducibility, nCounter assay is chosen as a good technical validation platform for the findings made from genome-wide microarray assays.
Numerous statistical methods have been proposed for genome-wide microarray projects. These methods, mostly developed for microarray data comprising many thousands of genes, may be specific to the platform or the number of genes so that they may not be appropriate for the analysis of nCounter data. The important analysis processes for microarray data are (i) data preprocess, (ii) discovery of the genes that are associated with different types of clinical outcomes, and (iii) prediction model fitting and validation. One important aspect in the analysis of microarray data is to adjust the false positivity for multiplicity of the genes. Furthermore, some of these methods utilize the fact that a large portion of the genes are not associated with the clinical outcome under investigation.
In this article, we review these statistical methods developed for high-throughput microarray projects and discuss the issues that can be raised when applying them to nCounter projects. We take a real nCounter data set to demonstrate these issues. The clinical outcome can be any type of variable, such as binary (eg, benign versus malignant and response versus nonresponse), continuous (eg, blood pressure), and time to event (eg, time to progression and overall survival) variables. Different types of outcome variables require different statistical methods. In this article, we focus on time-to-event endpoint, which is popular in cancer research.
an Example Ncounter Data
Lee et al. 1 designed an nCounter probe set (Nanostring Technologies) consisting of 800 candidate prognostic genes and 48 internal reference genes identified from a WG-DASL microarray study, as well as some known cancer genes, kinase genes, and G protein-coupled receptor genes, and profiled 428 patients with stage II gastric cancer. This study was undertaken to identify high-risk gastric cancer patients for tumor recurrence after surgery. The primary endpoint was disease-free survival (DFS), defined as time from surgery to the date of documented tumor recurrence or death.
Study Design
Usually, microarray experiments are conducted by multiple batches, and the expression data of genes are different across different batches. There are various publications on statistical methods to remove the batch effect, but most of them just try to make the distribution of gene expression data equal or similar among different batches, eg, Lee et al. 2 and the references therein. The batch effects have so complicated impact among different genes in the chips, so that these attempts are not very successful in removing batch effects. Furthermore, the effort to make the gene expression profile similar among different batches just removes the real difference between patient groups we want to detect, so that we often fail to discover prognostic or predictive genes with a batch effect adjustment. Owzar et al. 3 showed that known data normalization methods do not appropriately remove batch effect either.
If we cannot avoid batch effect and it cannot be removed in data analysis, it is critical that the batch allocation do not compound with any known predictors or the clinical outcome under investigation. Suppose that we want to discover the genes that are differentially expressed between two disease types. In this case, if the two disease types are assigned to different batches, then the main effect (the difference between two disease types) and batch effect are completely compounded and any effort to remove the batch effect will remove the main effect. To avoid this issue, we propose to randomly assign the patients among different batches while stratifying for the predictors (and clinical outcome also if possible). In the example study, we stratified the batch allocation with respect to tumor size and year of surgery.
Due to various reasons, the overall gene expression level among different chips may vary even within each batch. So, we need some control genes to normalize the overall expression levels across different chips. Some control genes are provided by the manufacturer, but we can also add some more together with candidate prognostic genes. In our example project, NanoString provided 26 prognostic genes and the project team identified 48 control genes from a DASL study conducted prior to the nCounter project. The criteria used when selecting the 48 genes from the DASL study were (i) the variance of the expression level is small, (ii) the mean expression level is similar to those of the 26 prognostic genes selected for this NanoString project, and (iii) the expression level is not associated with the clinical outcome, DFS. Microarray data from genome-wide platforms are normalized using the whole data set. This is one of the reasons why these high-throughput platforms are not appropriate for clinical use. However, nCounter chips are very reproducible, so that control genes within each chip provide very good normalization.
Data Analysis
Data preprocessing
In the example project, we excluded six samples with positive control normalization factor outside a range of 0.3–3. Positive control normalization factor was calculated as a ratio of the sum of expression levels of six positive controls in each sample to the average of sum of the six positive controls across all samples. We considered a sample having low quality if too many endogenous genes were expressed lower than the eight negative control genes. More specifically, we excluded 20 samples because, for each of them, the number of genes with expression levels larger than the maximum of the eight negative controls was smaller than 360 (= 0.45 x 800 endogenous genes). Consequently, 402 samples, of the 428, were used for further statistical analysis.
By most high-throughput microarray platforms, gene expression level is measured as a positive continuous variable, so that the logarithm transformation has been popularly used to convert the distribution of data into a normal distribution. For nCounter chips, however, it is measured as counts, so that a Poisson distribution may be more appropriate. It is well known that the square root transformation converts data with a Poisson distribution to those with a normal distribution. Supplementary Figure 1 reports histograms of raw data, log-transformed (with base 2) data, and square root-transformed data for the 48 control genes. We also checked the distribution of endogenous genes, but decided not to report the results from them because their expression levels might depend on the clinical outcome of the patients and violate the independent and identically distributed assumption. From the histograms, we do not observe that square root transformation works better than the log transformation but that the latter seems even to outperform, slightly, the former. So, we decided to use the log transformation for further analysis of this data set. Definitely, the raw data have skewed distributions.
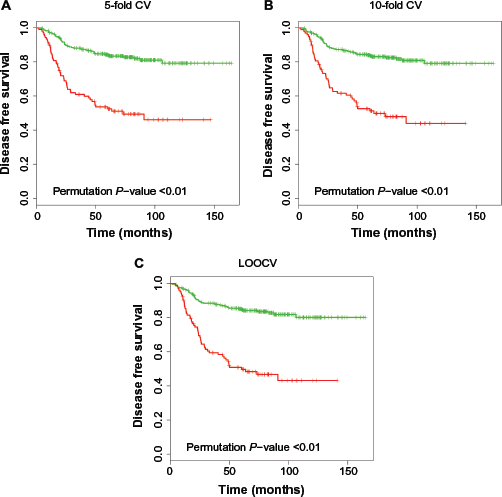
Kaplan–Meier plot for high-risk (red) and low-risk (green) groups classified by different CV methods. The
Variations in the technology and experimental conditions, rather than from biological differences between subjects, result in different amount of expression among different chips. Normalization is to adjust microarray data for these spurious effects. One of most popular normalization methods for genome-wide microarray data is the quantile normalization,
4
which makes the quantiles of the gene expression data among
Gene discovery
We want to identify the genes whose expression levels are associated with a survival outcome under investigation. With
In order to test the association between the expression level of gene 
Since it is impossible to analytically derive the null distribution of the
For a

It can be shown that an SSP, controlling the FWER weakly as in Equation (1), also controls the FWER strongly under the condition of subset pivotality (see p. 42 in Westfall and Young 11 ).
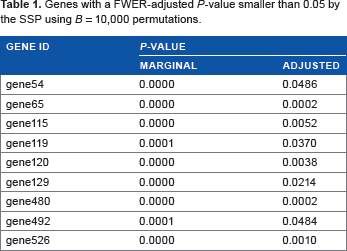
The SSP and step-down procedure can be useful for gene discovery using nCounter data while controlling the FWER accurately. Jung et al. 12 proposed an FWER control procedure to associate a survival outcome with gene expression data using a rank test statistic. We apply this procedure to the example study. Table 1 lists the genes that are selected by the SSP. We just use serial numbers for gene ID to limit the scope of this paper to statistical issues. We use a slightly different data set from that of Lee et al. 1 so that we decided not to give the real gene names here. Readers may refer to Lee et al. 1 for the biological findings from this project. We obtained a very similar result from step-down procedure.
Genes with a FWER-adjusted
Jung et al. 13 and Jung and Young 14 proposed sample size formulas to discover genes that are differentially expressed between two patient groups and Jung 15 proposed one to discover genes that are associated with a survival endpoint. These methods can be used to estimate the number of patients required for nCounter projects for gene discovery while controlling the FWER.
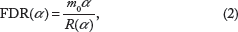
False discovery rate
Let 
This expression is undefined if Pr(
Benjamini and Hochberg
16
propose a multi-step procedure to control the FDR at a specified level. However, this is known to be conservative, and the conservativeness increases in
Suppose that, in the 
Ignoring the error term, we have
For the estimation of 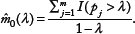
By combining this 
For an observed 
This formula is reduced to

The independence assumption among
It is questionable if we can use this FDR procedure for gene discovery using nCounter data. This procedure is valid only when the number of genes is very large and a large portion of them are null genes. This is not the case for most nCounter data, so that the FDR control methods by Storey and his colleagues do not seem be appropriate for nCounter data analysis.
Jung 22 proposes a sample size calculation method for microarray projects to discover genes by controlling the FDR. Jung and Jang 23 evaluate the performance of the FDR control methods by Benjamini and Hochberg 16 and Storey and Tibshirani 21 for gene discovery using microarray data and show that neither maintains the FDR accurately.
Prediction and Validation
In this section, we discuss how to develop a statistical model to predict the survival time using gene expression data and validate the developed prediction model. Suppose that we have
The goal in survival prediction is to build a model with input from 
Prediction
A prediction model is fitted from the training set. Before applying a prediction method to microarray data, we standardize the expression data of each gene by subtracting the sample mean and dividing by sample standard deviation. The prediction methods discussed above select a covariate for prediction model by the size of its regression coefficient (β
In order to lower the computational burden of prediction in genome-wide microarray data case, we decrease the number of candidate genes by selecting a feasible number (usually between hundreds to a few thousands) of genes using univariate Cox regression method with λ(
For genome-wide microarray data with a large
Suppose that a multivariate Cox regression model is fitted from the training data using the chosen
Validation
The first step of validation is to standardize the gene expression data of the test set (also called validation set) using the sample means and sample standard deviations calculated from the training set. Using the risk score fitted from the training set and its median as a cutoff value, we partition the subjects in the test set into a high-risk group and a low-risk group. We may choose a different cutoff value depending on how large the high-risk patient group we want. We may not even dichotomize the risk score. If we want to use the continuous risk score for clinical applications, then we may validate the prediction model by regressing the survival time on the raw (continuous) risk score as a single covariate using the test set.
Assessing the accuracy of a fitted prediction model based on the same data set that was used to develop the model can result in an overly optimistic performance assessment of the model for future samples, which is called overfitting bias. 29 To remove this bias, validation combined with a resampling method, such as bootstrapping, CV, and permutation, can be employed. We describe below some resampling techniques that are popularly used for validation.
Hold-out or split sample method
The hold-out method or split sample method is the simplest of all the resampling methods considered in this paper. It randomly partitions the whole data set into a training set of proportion
The
Leave-one-out-cross-validation
Leave-one-out-cross-validation (LOOCV) is a special case of
As mentioned above, we partition the subjects in the test set into high- and low-risk groups using the median risk score estimated from the training set as a cutoff value for their risk scores. Since the gene expression data are standardized, we expect about 50–50 allocation between the two risk groups. In order to validate the fitted prediction model (or the risk score) from the training set, we compare the survival distributions of the training set subjects between the two risk groups using the log-rank test. 30 With a two-sided type I error rate α, we conclude the validation of the fitted prediction model by the hold-out resampling method if the absolute value of the standardized log-rank test statistic is larger than the 100(1 - α/2)-th percentile of the standard normal distribution.
Overfitting bias can be an issue when the data points used for prediction are reused for validation. So, among the above resampling methods to split the whole data of size
From a resampling of the original data {(
Generate the
At the
Repeat the permutations 
For a prespecified type I error rate α, we conclude a positive validation of the prediction if
With survival data as clinical outcomes, we may not be able to develop a prediction model if there are too few events in the training set and the log-rank test to compare the survival distributions between high- and low-risk groups of test set may not have enough power if there are too few events in the test set. So, it is critical that the whole data set have enough number of events for a reasonable prediction-validation procedure. In order to increase the power of a chosen prediction-validation procedure, we propose to randomly allocate the subjects with events evenly among different partitions in resampling.
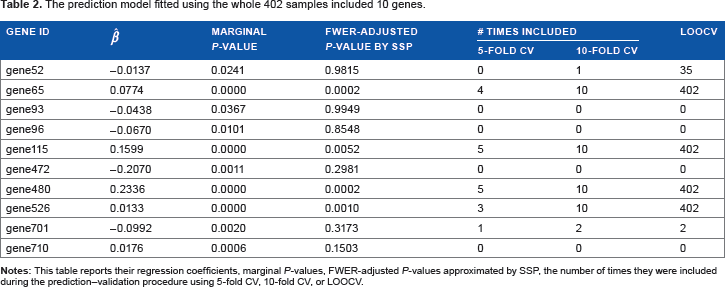
We applied the 5-fold CV, 10-fold CV, and LOOCV methods to the example data. Figure 1 depicts the Kaplan-Meier curves of the high- and low-risk groups by these CV methods. The two Kaplan–Meier curves of DFS split more in the order of 5-fold CV, 10-fold CV, and LOOCV. But this does not imply more significant validation of the fitted prediction models as the amount of overfitting bias increases in this order too. For each CV procedure, an unbiased
Since the data set was shown to be valid to predict the DFS of future patients, we fitted a prediction model using the whole data set of
The prediction model fitted using the whole 402 samples included 10 genes.
Discussion
We have reviewed some useful design and analysis methods developed for high-throughput microarray projects. Unlike the most high throughput microarray platforms, nCounter chips include relatively small number of genes, most of which are potentially prognostic, and the expression level of each gene is a count variable, rather than a continuous variable. We have discussed some issues raised when applying the methods developed for high-throughput microarray projects to nCounter projects and proposed modifications required to address the issues. We also have introduced sample size calculation methods that can be used when designing nCounter projects for gene discovery and prediction of clinical outcomes. Some modifications we may need to make when analyzing nCounter data using the existing analysis methods developed for genome-wide microarray data are:
We have to check the distribution of expression of the control genes to determine if we need another transformation than logarithm, such as square root transformation which is known to be appropriate counting data. For gene discovery, the existing FDR methods are not appropriate for nCounter data and use the FWER method with permutations. We do not need a gene screening before prediction model fitting.
We illustrated these procedures using an example nCounter study. These methods can be used for studies with pathway panel arrays which are provided by NanoString and usually containing a few hundred genes too.
Author Contributions
Conceived and designed the experiments: S-HJ. Analyzed the data: IS. Wrote the first draft of the manuscript: S-HJ. Contributed to the writing of the manuscript: S-HJ, IS. Agree with manuscript results and conclusions: S-HJ, IS. Jointly developed the structure and arguments for the paper: S-HJ, IS. Made critical revisions and approved final version: S-HJ, IS. Both authors reviewed and approved of the final manuscript.
Supplementary Material
Supplementary Figure 1
This figure reports histograms of raw data, log-transformed (with base 2) data, and square root-transformed data for the 48 control genes.