
Abstract
Background
As accessible diagnostic approaches fail to differentiate between ulcerative colitis (UC) and Crohn's colitis (CC) in one-third of patients with predominantly colonic inflammatory bowel disease (IBD), leading to inappropriate therapy, we aim to investigate the serum cytokine levels in these patients in search of molecular biometric markers delineating UC from CC.
Methods
We measured 38 cytokines, chemokines, and growth factors using magnetic-bead-based multiplex immunoassay in 25 UC patients, 28 CC patients, and 30 controls. Our results are compared with those from a review of current literature regarding advances in serum cytokine profiles and associated challenges preventing their use for diagnostic/prognostic purposes.
Results
Univariate analysis showed statistically significant increases of eotaxin, GRO, and TNF-α in UC patients compared to controls (Ctrl); interferon γ, interleukin (IL)-6, and IL-7 in CC group compared to Ctrl; and IL-8 in both UC and CC versus Ctrl. No cytokines were found to be different between UC and CC. A generalized linear model identified combinations of cytokines, allowing the identification of UC and CC patients, with area under the curve (AUC) = 0.936, as determined with receiver operating characteristic (ROC) analysis.
Conclusions
The current knowledge available about circulating cytokines in IBD is often contradictory. The development of an evidence-based tool using cytokines for diagnostic accuracy is still preliminary.
Introduction
Inflammatory bowel disease (IBD) comprises ulcerative colitis (UC) and Crohn's disease (CD). CD located in the colon is termed Crohn's colitis (CC) or, when a definitive evaluation cannot be made, indeterminate colitis (IC). The colitides are a chronic, relapsing, and remitting intestinal inflammatory disease that arises through multifactorial reasons, including genetic susceptibility, environmental agents, bacterial origins, and damage of the epithelial barrier.1–3 As a result of an inappropriate activation, the mucosal immune system becomes compromised and inflammatory reactions are initiated, involving many cells and mediators of immunity. It is believed that UC and CC are distinct pathologies that have different causes and mechanisms of tissue damage. They are presumed to have distinct molecular biometric signatures that are specific to the phenotype.
4
Cytokines, chemokines, and growth factors (which are soluble signaling molecules of the immune system) play important roles in the pathophysiology of IBD.5,6 They mediate inflammation, cell differentiation, and chemotaxis and the migration of lymphocytes, neutrophils, and other immune cells to the injured tissues. Some cytokines have local effects and can be detected mostly in tissues. Others may be detected at the systemic level, which has led many research groups to hypothesize that cytokine levels in circulation may differentiate IBD from non-IBD patients, or have predictive, diagnostic, or prognostic values in evaluating the activity of disease.7–11 To contribute to the hypothesis that cytokines may be the mediators of disease-associated changes, we analyzed serum concentrations of cytokines, chemokines, and growth factors in UC and CC patients and in a group of controls. The comparison of our data with what is described in the available literature allows us to improve upon advances and challenges in circulating cytokines evaluation in IBD. Identification of cytokines that are subnormally/abnormally expressed could allow the determination of the key pathways/targets that uniquely cause or support the various forms of colitis. Since the natural disease course, response to treatment, and complications differ significantly between UC and CC patients, an accurate diagnosis is critical for appropriate care. Distinguishing between CC and UC is critical to therapy.
12
Clinical experience suggests that identifying patients with CC and positive outcomes after pouch surgery is arduous. Thus, restorative proctocolectomy (pouch surgery) should be contraindicated for CC patients, whereas ileal pouch-anal anastomosis is standard acceptable care for patients with UC and IC who are predicted likely to develop UC. Inevitably, pouch complications are significantly higher in patients with CC (±64%) and IC (±43%) versus patients having UC (±22%) (
Materials and Methods
Clinical samples
Prospective collection of clinical/medical information regarding age, sex, disease diagnosis and activity, and medical care history of individual patients was obtained from the final surgical pathology record/report protocols. The cohort of patients and controls included in the study were as follows: 25 cases (18 men and 7 women) with UC (median age 50 years; range 20-68), 28 cases (13 men and 15 women) with CC (median age 35.5 years; range 19-73); and 30 (3 men and 27 women) controls (Ctrls) (median age 35.5 years; range 25-67). All patients with UC and CC had a moderate to severe active disease at the time of blood sampling. Any patient with ambiguous diagnosis and/or in remission/quiescent condition was excluded. Patients taken into the survey neither had been on chemo/radiotherapy nor had taken immunosuppressive drugs for at least 1 month prior to blood sampling. It is known that after 1 month without taking any immunosuppressive drugs, since plasma clearance is rapid with a half-life of 66 minutes at normal hormone levels, 18 patients should be cleared in the system. The Ctrl group consisted of patients seeking medical attention for reasons other than intestine inflammation or cancer. These patients were indicated for elective prophylactic surgery because of pancreatic benign tumors and/or cysts, or gastric binding for obesities, and, in some patients, due to family history of cancers (breast, ovarian etc). The clinical diagnosis of patients was confirmed by three blinded gastrointestinal pathologists specialized in gastroenterology according to widely accepted criteria.19,20 The disease and area of the gut affected was predominantly colonic, and there were no patients included in the study with Crohn's ileitis (involvement of small bowel). The gold standard for defining UC and CC relied on a compilation of clinical, radiologic, endoscopic, and histopathologic interpretations. 19 The Montreal classification 21 and the Paris modification 22 have brought consistency to the definitions of subtypes of CC and colitides.
The disease activity score data was obtained by the attending physician based on standard clinical and pathologic features23–25 and represented a consensus among treating physicians. Serum was delivered frozen from the Cooperative Human Tissue Network (Western Division at the Vanderbilt University Medical Center and Eastern Division at the University of Pennsylvania). After shipping, the serum was stored at -80°C until the subsequent analysis.
Protein measurement
Immediately before performing the multiplex cytokines detection assay, serum was thawed on wet ice and protein concentration quantitation was performed to ensure that equal amounts of protein were added to each well of the multiplex assay. Protein levels were determined using the BCA assay kit (Thermo Scientific, Pierce). The assay was performed in accordance with manufacturer's protocol in a 96-well plate. The absorbance was measured at 562 nm on a plate reader. The standard curve was generated based on the values of wells containing dilutions of bovine serum albumin (BSA) from 250 to 2000 μg/mL, after which the regression equation was used to calculate the protein concentration of the unknown samples.
Serum cytokines detection
Millipore's 38-plex MIL-LIPLEX MAP human cytokine/chemokine kit was used to simultaneously quantitate the following panel of cytokines and chemokines: EGF, eotaxin, FGF-2, Flt-3 ligand, fractalkine, G-CSF, GM-CSF, GRO, IFN-α2, IFN-γ, IL-1α, IL-1β, IL-1ra, IL-2, IL-3, IL-4, IL-5, IL-6, IL-7, IL-8, IL-9, IL-10, IL-12 (p40), IL-12 (p70), IL-13, IL-15, IL-17, IP-10, MCP-1, MCP-3, MDC, MIP-1-α, MIP-1β, sCD40L, TGF-α, TNF-α, TNF-β, and VEGF. The immunoassay procedure was performed according to the manufacturer's instructions. For each well, the serum amount used corresponded to 250 μg of protein; samples were run in duplicates. The Milliplex immunoassay technology utilizes “color-coded” microspheres, each set of which is distinctly colored with two fluorescent dyes and coated with a specific antibody. The premixed 38-plex magnetic beads were added to each well, and the plate was incubated in a shaker-incubator overnight at 4°C. On the next day, after certain cytokine from a test serum is captured by the bead, the wells were washed and biotinylated detection antibodies were added, after which the reaction was completed by incubation with streptavidin PE conjugate, which is a reporter molecule and allows measurement of a specific cytokine later in the laser detection step. After subsequent washing, the plate was run on a MAGPIX multiplex reader, where, based on fluorescent signals, individual microspheres can be identified. The data was quantified with xPONENT software automatically after the plate map was defined by the user. Cytokine/chemokine concentrations in the samples were calculated through the five-parameter logistic curve-fitting method using the MFI (median fluorescence intensity) data. Concentrations are given in pictograms per milliliter (pg/mL).
Statistical analysis
Because the sample sizes of patients and controls in this study were less than 50 cases in each group, the Shapiro–Wilk test was used for the assessment of the normality of data. The data for most cytokines were not found to be distributed normally (with very rare exceptions), so they are further described as medians with interquartile ranges for continuous variables and percentage (frequency) for categorical variables. For comparisons between the three groups, the Kruskal–Wallis test analysis of variance was performed, with a posteriori Mann–Whitney tests. The significance level was set to be 0.05. We used Benjamin Hochberg method to control the false discovery rate, which is the expected proportion of false discoveries amongst the rejected hypotheses. The strength of marginal relationships between predictors and the disease status was assessed with the square of Spearman's rho rank correlation. To identify disease types between CC and UC, we fit a generalized linear model via penalized maximum likelihood with lasso regularization to examine all qualified cytokines in addition to age and gender. The model was chosen by maximizing the appropriate penalized log-likelihood via lasso regularization path. When the number of variables is large compared to the number of observations, this regularization method is used to reduce the number of predictors and identify important predictors so that the model becomes better at predicting. Lasso constructed a model by fitting a least-squares solution with an added constraint that was determined by cross-validation by the GLMNET package in R. Analyses were performed using the statistical software SPSS version 22 and R version 2.15.2 (www.r-project.org).
PubMed literature search
To compare our data with studies using similar approaches, we screened the PubMed database for papers in which the quantitation of circulating cytokines and chemokines in IBD patients was performed. The search was conducted using the following inquiry: (cytokine OR chemokine OR EGF OR Eotaxin OR FGF-2OR Flt-3 ligand OR Fractalkine OR G-CSF OR GM-CSF OR GRO OR IFN-alpha2 OR IFN-gamma OR IL-1alpha OR IL-1beta OR IL-1ra OR IL-2 OR IL-3 OR IL-4 OR IL-5 OR IL-6 OR IL-7 OR IL-8 OR IL-9 OR IL-10 OR IL-12 OR (p40) OR IL-12 OR (p70) OR IL-13 OR IL-15 OR IL-17 OR IP-10 OR MCP-1 OR MCP-3 OR MDC OR MIP-1alpha OR MIP-1beta OR sCD40L OR TGF-alpha OR TNF-alpha OR TNF-beta OR VEGF) AND serum AND human AND (IBD OR UC OR Crohn's). Only those research papers that had relevant information to this study were selected for review, ie, in which we could find the quantitation of at least one cytokine/chemokine from the list of the bioplex panel used in this research (listed in the “Serum cytokines detection” section). The following data was extracted from selected papers (where it was possible to find): sample sizes of the patients’ and control cohorts; age of patients and Ctrls taken into the study; disease activity status (if mentioned); the method of cytokine measurement; the serum storage conditions (if any); and whether the cytokines/chemokines under study were found to be upregulated, downregulated, or unchanged compared to control group and/or group with inactive disease. Further, if the cytokines were mentioned to be up- or downregulated in the abstract while the full-text publication was not available, this study was also taken into our review.
Ethical Considerations
The study was approved by the Meharry Medical College Institutional Review Board Committee (protocol number 100916AM206) and Vanderbilt University Institutional Review Board Committee (protocol numbers 100581 and 080898) and conducted in accordance with the Second International Helsinki Declaration. 27 Informed consent was given, and participation in the study was voluntary.
Results
Missing patterns for UC and CC
Among the 38 cytokines measured, a large proportion returned zeros, meaning they could not be measured either because their concentrations were below the detection limit or because they were truly not present (Fig. 1B). We were unable to differentiate between these two situations. Therefore, if a cytokine had a zero value in more than 75% of the cases, that cytokine was excluded from further analysis (those cytokines are marked gray in Fig. 1B) to minimize potential bias. 28 The sCD40L level was, on the contrary, above the detection range in most of the samples, making it an ineffectual predictor and therefore also excluded from the analysis. The univariate analyses were performed in the remaining 23 cytokines.

(
Comparison of cytokines in sera of IBD patients and controls
The univariate analyses were performed in the remaining 23 cytokines. We tested whether it was possible to use a relatively small cohort of patients (a total of 82 samples) to confidently arrive at a conclusion on serum cytokines content, and whether this could build a discriminatory model between the two diseases. Further, the results from this observational cohort were compared with those of other studies available in the literature that profiled serum cytokines levels in IBD.
First, we compared individual serum cytokines, chemokines, and growth factors (hereafter designated as “cytokines”) between three independent groups (UC, CC, and Ctrl). The medians, interquartile ranges, and adjusted
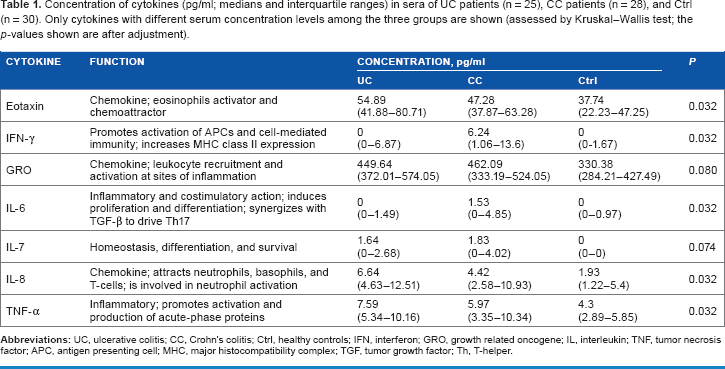
Concentration of cytokines (pg/ml; medians and interquartile ranges) in sera of UC patients (n = 25), CC patients (n = 28), and Ctrl (n = 30). Only cytokines with different serum concentration levels among the three groups are shown (assessed by Kruskal–Wallis test; the

Box plots of the serum cytokines measured by multiplex assay in UC (n=25), CC (n=28) and control (n-30) groups (horizontal line, median; box, interquartile range; whiskers, minimum and maximum; outliers are displayed as circles, and extreme values are displayed as stars); data is transformed as lg(x+1), where x is cytokine concentration.
After determining cytokines with altered serum levels, we established which groups were attributed to those differences. The results of differences observed are displayed in Table 2. No cytokines differ between UC and CC. Cytokines with concentrations significantly higher in UC patients compared to Ctrl, were eotaxin [54.9(41.9-80.7) vs 37.7(22.2-47.3),
Difference between medians and the 95% bootstrap confidence interval between UC, CC and Ctrl groups. The values marked with bold type are considered significant as adjusted

Generalized linear model for outcome prediction
In an attempt to discriminate between two groups of patients, we built the generalized linear model based on the variables for age, sex, and cytokines that had less than 75% missing values. The best model would be closest in agreement with outcomes, which were set as 0 for UC and 1 for CC. The coefficients for the resulting model are given in Table 3. A dash means that the parameter was excluded from the model; thus, as a result of lasso regularization, out of 25 parameters, only 17 remained in the model. Using these parameters, the predicted probability was then calculated for each patient (Fig. 2). An area under the curve (AUC) value of 0.936 means that accuracy of the model is excellent.
Generalized linear model for ulcerative colitis and Crohn's colitis, established via penalized maximum likelihood with lasso regularization. Variables with coefficient estimates displayed were retained in the model.

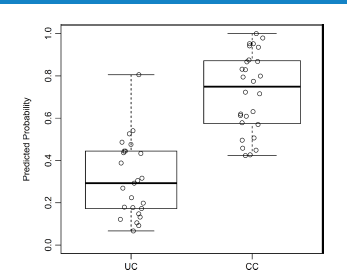
Predicted probability for disease types, based on the generalized linear model.
Summary of literature overview
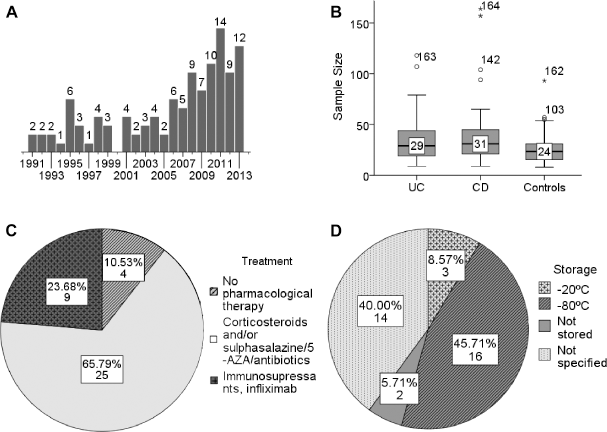
The summary of literature overview is displayed in Table 5. On July 22, 2014, 368 papers in the PubMed database fulfilled the search inquiry described in the “Materials and methods” section. After manual inspection of each of these references, 279 of them have been excluded from the review for one of the following reasons: 1) the paper is a review; 2) the study describes a different disease or different parameters, not cytokines; 3) subjects of research are not humans (mice, rats, etc.); 4) full text is not available and the abstract contains not enough data (ie, describes “IBD” without a specification for CD or UC); 5) cytokines under study are not in our list; or 6) the paper describes cytokine levels before/after certain treatment and contains no control group. The ultimate data contained 236 contributions on cytokines, chemokines, and growth factors derived from 89 research papers7–11,29–112 published during the years 1991 to 2013 (distribution of papers according to the year of publishing is shown at Fig. 3A). Sample sizes of patient and control cohorts in these studies varied from 8 to 80 per group, with median values of 29 for UC, 31 for CD, and 24 for Ctrl (Fig. 3B). The age of patients ranged from 15 to 79 years, with median age of 31.6 years for UC stored it at -80°C after the blood sampling and optional shipping before further manipulations were performed (Fig. 3D). In some cases, serum was stored at -20°C, or the analysis had been done immediately after blood sampling. A large percentage of the publications did not specify the conditions of serum storage at all. Among 58 papers where the method of cytokines measurement was mentioned, 50 studies used enzyme-linked immunosorbent assay (ELISA), 6 studies used bioplex/multiplex/microarray assay, 1 study detected cytokine production by peripheral lymphocytes by flow cytometry, and 1 study quantitated cytokine mRNAs in peripheral blood mononuclear cells (PBMCs) by real-time polymerase chain reaction (RT-PCR).
(
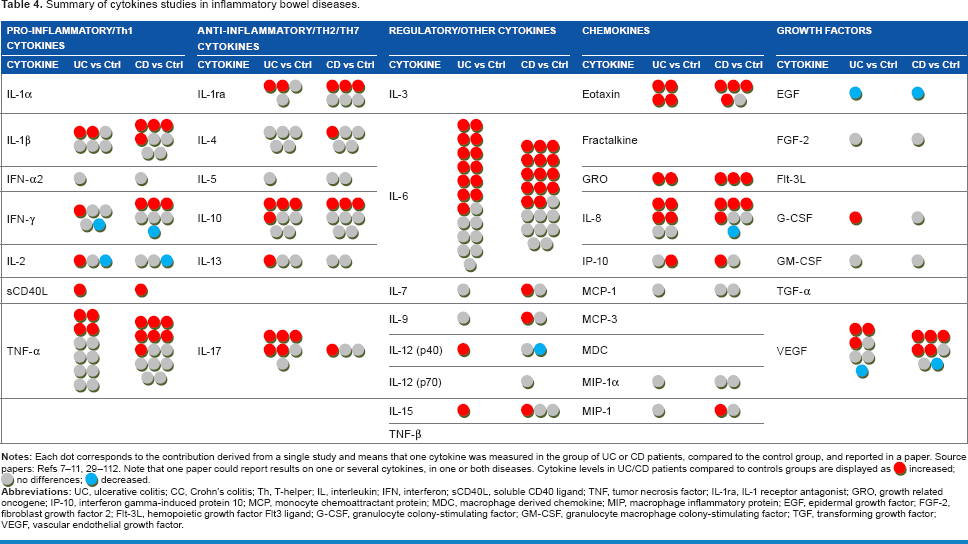
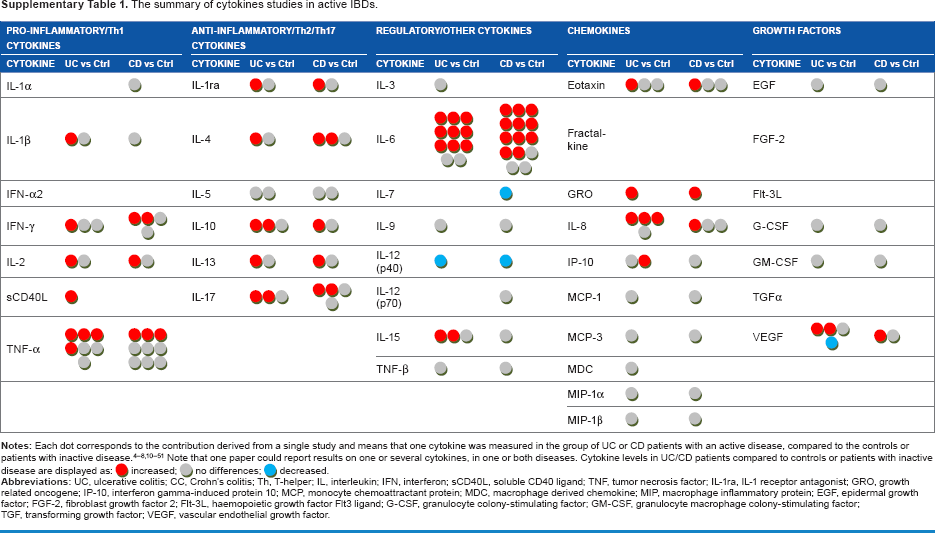
Each dot in Table 4 corresponds to one cytokine in the UC/CC patient groups compared to the Ctrl group in one paper. It can be seen that some circulating cytokines have been studied very extensively in IBD (TNF-α, IL-6, IL-8, IL-10), while others have not been studied at all (IL-1α, IL-3, fractalkine, etc). A red dot in this table means that serum cytokine level was found to be increased in serum of IBD patients compared to Ctrl, a gray dot means no difference, and a blue dot means that cytokine level was decreased. As shown in Table 4, there are often diverse results for the same cytokine. We propose that the heterogeneity of patient cohorts may explain this fact, so we then focused on the activity status of IBD. We selected studies where active disease was compared to controls or inactive disease. Still, the use of this criterion did not change the overall view (Supplementary Table 1). The levels of the same cytokine in IBD compared to Ctrl could be found elevated in some studies and normal in others. Such observations suggest that the activity state of IBD does not explain the revealed heterogeneity of cytokine levels in circulation, and selecting only patients with active IBD does not lead to agreement between different studies, making it difficult to prove the real predictive, diagnostic, or prognostic value attributed to certain cytokines.
Summary of cytokines studies in inflammatory bowel diseases.
The summary of cytokines studies in active IBDs.
Discussion
The existing problem of an IC diagnosis is the inability to discriminate UC from CC. In the search for molecular biometric markers, we compared concentrations of 23 cytokines in the serum of patients with UC and CC but failed to find strong differences between the two diseases. Unfortunately, not many studies have conducted comparisons of the cytokine levels between UC and CC; most often, investigators concentrated at comparing one or both diseases with control groups. Cytokines that were found to be elevated in UC compared to CD include IL-1β, 38 TNF-α, 38 GRO, 47 and IL-8. 55 In CD, IL-1ra, 32 IL-6, 48 EGF, 57 and VEGF 65 levels were significantly increased compared to UC.
The studies of the cytokine levels in IBD at the actual sites of inflammation in the intestine led to a paradigm in which UC is a Th2-associated disease, whereas in CD the Th1/Th17 cytokines play a major role driving the inflammatory response. 5 In accordance with our research and oth-ers’, 113 this dichotomy only partly reveals itself at the systemic level, and many of the classic cytokines of innate and adaptive immunity cannot be detected in serum of IBD patients (nor in controls). 113 It may be that these cytokines are restricted to the tissue sites of inflammation, have relatively short half-lives, and show themselves in circulation only in advanced conditions.
When we compared the cohorts of UC and CC patients to the group of controls, we found that the levels of eotaxin, GRO, and TNF-α were increased in UC, and IFN-γ, IL-6, and IL-7 in CC. Serum IL-8 was equally elevated in UC and CC versus Ctrl. No cytokines were found different between UC and CC.
Interestingly, the cytokines with altered concentrations in IBD patients belonged to the subsets of inflammatory (IFN-γ and TNF-α) and regulatory (IL-6 and IL-7) cytokines and chemokines (eotaxin, GRO, IL-8). In regard to eotaxin, our findings concur with those of four other studies showing increased levels in the serum of UC patients.31,58–60 Interestingly, three out of four studies where eotaxin levels were explored in patients with CC or CD indicate an upregulation of this chemokine.31,58–60 Our study did not reveal an increase of eotaxin in CC. This may indicate that it is not reliable for differentiating between the two diagnoses, but eosinophil recruitment and activation seem to play a certain role in UC and probably in CD/CC. 59 Moreover, granulocyte (including neutrophil) chemotaxis and activation are largely mediated by IL-8 and GRO, 114 the levels of which we found elevated in UC (GRO), or both UC and CC (IL-8), supporting the role of these cells in the pathogenesis of IBD. Actually, serum IL-6 and IL-8 concentrations are often considered to be reliable markers for CD or UC and correlate with inflammatory activity.9,37,67 We found the level of IL-6 unchanged in the serum of UC patients, but the increase in IL-6 and IFN-γ levels in the serum of CC patients is consistent with Th1-like course of CD in the literature, 5 as both these cytokines are important mediators of acute phase responses and contribute significantly to the recruitment and activation of macrophages in tissues. Activated macrophages produce large amounts of inflammatory cytokines and thus establish a pro-inflammatory environment for other immune cells in the gut.6,40
Based on differences we found in the cytokine profiles of IBD patients, we built a discriminating model that allowed differentiation between the cohorts of UC and CC. Although the generalized linear model (Table 3) could correctly identify 82.1% UC patients and 88% CC patients (Fig. 2), the number of parameters this model uses is 17, which makes the analysis complicated and cost-ineffective for potential diagnostic use. Earlier, several studies have attempted to use existing differences between UC and CD/CC to create discriminating models based on proteins present in serum with the use of multifactor statistical tools. Kader et al 30 quantified the serum levels of 78 different cytokines and growth factors with an antibody microarray, and used linear discriminant analysis to identify 10 predictive and/or prognostic biomarkers that differentiated active versus remission/quiescent patients in pediatric CD: BDNF, I-309, IL-17, MCP-1, MPIF-1, PLGF, TARC, TRAIL, sCD23, and UPAR. Further, Rodríguez-Perlvárez et al 37 analyzed nine serum cytokine concentrations with a multiplex system and demonstrated that UC patients were characterized by higher concentrations of IL-8 and IL-10, and with a lower concentration of IFN-γ. Finally, Knutson et al 31 targeted 35 serum markers (Cl-Tyr, Nitro-Tyr, cytokines, and acute-phase proteins) and found that IL-8, Cl-Tyr, SAA, CRP, procalcitonin, G-CSF, and tissue plasminogen activator were the best predictors for UC patients, whereas procalcitonin, SAA, Nitro-Tyr, Cl-Tyr, and IP-10 were best for CD patients. The UC samples demonstrated better separation than CD samples from the controls.
It is evident that the levels of circulating cytokines in patients suffering from IBD have been studied rather intensely during the last decade. Therefore, we screened the available PubMed data, summarized in Table 4, showing the observed changes in cytokines levels in UC and in CC compared to controls. The table depicts findings from different research groups, which are often not in agreement: practically every cytokine mentioned in the table more than once was found to be upregulated in some studies, downregulated in others, or unchanged compared to controls. Even narrowing the selection criteria by comparing studies where cohorts with active IBD have been studied did not lead to better agreement of data. Fairly uniform results are shown only for eotaxin in UC and GRO in both UC and CD, although GRO has been studied only twice, preventing its definitive relationship to IBD.
The following factors may contribute to the heterogeneity of circulating cytokines data in IBD:
Conditions of serum storage. Surprisingly, serum storage conditions prior to cytokine measurement were not described for all full-text publications. Forty percent of authors did not mention the conditions of serum storage at all. Storage condition is critical and may influence cytokine concentration. It is known, for example, that the concentration tends to decrease over time and after repetitive freeze/thaw cycles. 115 Also, a recent study showed that storage of the serum samples at -80°C and <-130°C for up to 90 days does not lead to substantial changes, while storage at 4°C and -20°C induces substantial decreases in cytokine concentrations. 116 Thus, the information on storage conditions should be included when describing results; otherwise comparison between cytokine concentrations performed immediately after blood sampling and after freezing and thawing might be useless.
Localization of inflammation. It is unknown if inflammation localized in different segments of the bowel (eg, Crohn's disease affecting colon, ileum, duodenum, esophagus, or buccal cavity) may influence cytokine levels in circulation. It needs to be clarified whether the choice of patients with certain IBD localization influences the results. Few publications reviewed in this study divided IBD patients into subgroups based on this feature, and the amount of available information is not enough for any conclusions.
Treatment received at time of blood sampling. Some of studies reported the use of immunosuppressive drugs or chemotherapy in at least part of their patients’ cohorts. It could be advised that patients receiving these medications should not be mixed or compared with patients without any medications at all, as the immunosuppressive drugs may influence the cytokines level greatly. 117
Manufacturer and assay used. When analyzing the literature, introducing the limitations on manufacturer or assay type markedly reduced the number of observations for each cytokine, which obstructed any comparisons. Still, we chose ELISA by R&D Systems, as this assay has been used frequently in studies taken into review, and compared results for IL-6 and TNF-α, two well-studied cytokines in IBD. We assumed that cytokine change in IBD would not depend on the assay used. Interestingly, it appears that IL-6 levels measured by R&D Systems ELISA were entirely uniform throughout seven studies taken into the review (Table 5), with both UC and CD/CC showing increase in IL-6 levels, while other assays showed heterogeneous results. However, the increase in TNF-α levels was revealed or not revealed in different studies without any specificity toward a particular assay. It is unclear whether the IL-6 data presented in the table is a coincidence or not, or whether the choice of assay can impact the results.
Changes in IL-6 and TNF-α levels in CD and UC identified with the use of R&D Systems ELISA assay and other assays/manufacturers.

Our study has a number of limitations, one of which is the small sample size in all groups. Usually, only descriptive statistics can be reported for a small-sample-size study, without doing any complicated models. The model that we developed needs to be validated in another dataset before application. Another limitation is the difference in age between UC patients (50 years) and CC and controls (35.5 years). In healthy persons, greater age inversely correlated with IL-1β levels, and positively correlated with TNF-α levels, while no relationship was found for age and IL-6. 118 There is a study contradicting these observations, showing that IL-6 level also positively correlates with age. 119 At the same time, there is an evidence that there is no correlation between age and cytokine concentration in UC patients, regardless of disease activity. 37 However, no significant age difference was observed between groups of patients with UC, CC, and the group of controls, as determined with the Mann–Whitney U test (data not shown). Taking into account these facts, we believe that age difference between groups did not necessarily influence cytokine concentrations in our research. One more limitation of this study is that the proportion of women and men in disease and control groups is not the same. It has been shown that women had higher concentrations of IL-8 than men, and also higher level of IFN-γ. 37 Male sex was associated with greater IL-6 and TNF-α levels. 118 However, all the cytokines levels that we found different between UC, CC, and Ctrl groups did not differ between men and women in our study (this data is also not shown), although, of course, sex can be a possible confounding factor in IBD, which should be studied in future more thoroughly and on bigger sample sizes. Another limitation of the study is the unavailability of the full text of some references; the analysis would be more full and thorough if the input data was complete.
In summary, at the present time it appears difficult to achieve consistency in cytokine measurement in IBD. Heterogeneous results do not seem to have a simple or single explanation. Even though a strong discriminating difference in cytokine concentrations is found between UC, CC, and controls, such data will require thorough validation and assay tuning before it is possible for use in IBD laboratories for predictive, diagnostic, or prognostic purposes. Another methodology that may allow precise distinction between UC and CC has now been started by us. We are looking for a single protein or small cluster of proteins that have the necessary 1) specificity, 2) sensitivity, 3) discrimination, and 4) predictive capacity to differentiate the heterogeneity of IBD.16,17 This requires a technology that can accommodate sampling large patient cohorts while accounting for patient variability. We are using matrix-assisted laser desorption/ionization mass spectrometry (MALDI MS) technology for mining, profiling, and identification of proteomic patterns that delineate UC and CC, and, most importantly, predict IC into UC or CC. Our approach, histology-directed MALDI MS is the first attempt ever used to analyze and compare mined proteins of the colonic mucosal and submucosal tissue layers individually, in order to differentiate between UC and CC.16,17 Specialized MALDI MS offers the possibility of direct proteomic assessment of the tissue itself. The histologic layers of colectomy samples from patients with histologically and clinically confirmed UC and CC, with no ambiguity, are analyzed individually using MALDI MS for proteomic profiling. The results have successfully identified highly significant MALDI MS mass-to-charge ratio (
Conclusion
Rising incidence and prevalence of IBD worldwide is accompanied by an increase in cases of IC. This increases the need to find a unique molecular biomarker (or a panel of biomarkers) that would allow proper diagnosis of undetermined/uncategorized cases as UC or CC. Resolving this issue requires increased use of cutting-edge technologies in basic and translational research. During our own investigations, we tried to reveal differences in the serum cytokine levels between UC and CC patients, which, if successful, could lead to a diagnostic assay that is easier, accurate, affordable, noninvasive, and faster. Although certain cytokines were found to differ between pathologies and controls, no cytokine could clearly distinguish UC from CC. The analysis of literature has shown that, although several attempts have been made to define the serum cytokine profile in IBD patients, contradictory results from these studies indicate the infeasibility of finding the biomarker(s) among serum cytokines at this time.
A speculative comment
The authors would like to speculate that the etiology of IBD seems likely to be the same in UC and CC. What determines development of a UC or CC phenotype is the patient's own immunity (its “strength”). A good example of this theory is from the history of leprosy. Leprosy was present in ancient civilizations, and the first known written document mentioning this disease (according to WHO records) is dated 600 BC. 120 There are three types of leprosy: tuberculoid (TL), lepromatous (LL), and tuberculoid-lepromatous (TLL). All three phenotypes are caused by the same bacteria. Speculatively speaking, TL is like UC, LL is like CC/CD, and TLL is like IC, possibly all triggered by the same etiology
Author Contributions
Study concept and design, acquisition of data, analysis and interpretation of data, statistical analysis, critical writing and drafting of manuscript: OYK. Material and technical support: JNM. Experimental work and analysis of data: STP. Biostatistical analysis and interpretation of data and writing the “Statistical methods” section of the manuscript: LW. Study concept and design, analysis and interpretation of data, critical writing and revision of manuscript, statistical analysis, and supervision of all study activity: AEM. All authors reviewed and approved the final manuscript.
Footnotes
Acknowledgments
The authors thank Anil Shanker for critical comments and suggestions. They also thank Jared Elzey, CRA, from the Meharry Research Concierge Services (supported by NIH grants U54MD007593 and UL1TR000445) for comments, suggestions, and language editing.