
Abstract
This paper analyzes the survival of breast cancer patients, exploring the role of a metastasis variable in combination with clinical and gene expression variables. We use the hypertabastic model in a detailed analysis of 295 breast cancer patients from the Netherlands Cancer Institute given in. 1 In comparison to Cox regression the increase in accuracy is complemented by the ability to analyze the time course of the disease progression using the explicitly described hazard and survival curves. We also demonstrate the ability to compute deciles for survival and probability of survival to a given time. Our primary concern in this article is the introduction of a variable representing the existence of metastasis and the effects on the other clinical and gene expression variables. In addition to making a quantitative assessment of the impact of metastasis on the prospects for survival, we are able to look at its interactions with the other prognostic variables. The estrogen receptor status increase in importance, while the significance of the gene expression variables used in the combined model diminishes. When considering only the subgroup of patients who experienced metastasis, the covariates in the model are only the clinical variables for estrogen receptor status and tumor grade.
Keywords
Introduction
The search for biomarkers or gene expression variables to improve the accuracy in prognosis is motivated by the difficulty in predicting patient outcome. Breast cancer patients with a similar clinical profile can experience drastic differences in the course of the disease and in outcome. Doctors are intrigued by the potential for increased accuracy in prognosis through gene expression variables, and researchers expect these tools to reveal aspects of the underlying biology. Breast cancer is understood to be a highly heterogeneous pathology, with the differing courses of the disease arising from the multiplicity of molecular subtypes of the tumors and the distinct genetic profiles. Gene expression profiling has already shown progress in the classification in molecular subtype given in,2–4 although some of these subtypes were known independently. Note there is a corresponding classification in terms of clinical variables, namely the hormone receptor status of the tumor (estrogen and progesterone) and whether or not the tumor is over-expressing in ErbB2/Her2/neu. 2
In the last decade there has been an intensive study of many aspects of breast cancer biology through use of microarrays to understand variations in gene expression. In many cases these have been used as biomarkers to assist in prediction of overall survival 5 or response to therapies or specific drugs. 6 Gene expression has furthermore been used in classification of tumors into molecular subtype.2–4 In addition gene expression has been used to better understand the cancer biology in relation to the clinical variables. 7 These gene expression variables have shown a high degree of prognostic power, and they are currently being developed for clinical use. 8 In this paper we are concerned primarily with the seventy gene signature of, 9 the wound response gene expression variables of,10,11 and the molecular subtype correlations of.3,4
Metastasis in cancers forms the most fundamental challenge to the survival of cancer patients, particularly in cases such as breast cancer where no vital physiological functions are disturbed by the breast tumors. The seventy gene signature was formed based on gene expression in relation to distant early metastasis and has been shown to be a strong predictor of good or poor outcome. A number of other prognostic gene signatures have been produced, and Yu et al 12 made a comparative analysis determining all are effective and share a significant percentage of pathways. Ramaswamy et al 13 applied gene expression to understand the difference between metastases and primary tumors and discovered a seventy gene signature associated with metastasis. Based on similar profiles found among primary tumors, these researchers proposed that metastatic potential is encoded in the primary tumor. Other researchers have similarly challenged the widely held model that metastasis arises from rare subpopulations of cells containing heightened levels of genetic alteration. 14 Another research group 15 developed a common metastatic signature, using gene expression datasets across several types of cancer in order to identify gene expression representative of metastatic risk. Their goals of elucidating metastatic pathways, providing strong predictors for metastasis, and uncovering further avenues of study in the biology of cancer and metastasis are shared by many researchers in this area. Our own motivation to better understand the relation of metastasis to the other clinical and gene expression variables is also closely allied.
The development of breast cancer is directly linked to the role of estrogen in controlling cell proliferation and differentiation, which signals the cell through the estrogen receptors. The action of the estrogen receptors is highly complex, including ligand activation and having the potential for cross-talk with other signaling pathways. 16 Among breast cancer cells, some maintain estrogen receptors and responsiveness to these signals, while others, which are termed estrogen receptor negative, no longer receive these messages. The ER negative tumors are thought to either arise from mutation in the ER positive tumors or to originate from a different type of epithelial cell in the mammary gland. ER status is an important prognostic variable, with ER negative tumors showing more invasiveness and higher resistance to treatment. It is known that the small percentage of breast tumors of the most aggressive category, sometimes called invasive breast cancer (IBC) fall into the category of ER and PgR negative, but Her2 positive. Desmedt et al demonstrated 17 that in the case of ER positive/Her2 negative tumors proliferation is the main factor determining survival, while in the ER negative subclass it is immune response and tumor invasion. Gruvberger et al used gene expression to explore the differences in the underlying biology between the ER positive and ER negative tumors, 18 finding that remarkably different gene expression phenotypes going well beyond responsiveness to estrogen. The study of Yu et al among the many prognostic signatures for metastasis 13 also revealed that the underlying biology leading to invasiveness and metastasis is very different in the ER positive and ER negative cases.
The current paper analyzes the survival of breast cancer patients from a data set given in, 1 with attention to the role of metastasis as a variable and its interactions with the other clinical and gene expression variables. From this investigation we learn more about the relation of the gene expression variables, in particular the seventy-gene signature of 9 and the CSR correlation of 10,11 to the metastasis of breast cancer. The clinical variable of estrogen receptor (ER) status also figures prominently into the model, forming interesting interactions with both the gene expression variables and the metastasis variable. In quantifying the influence of metastasis on hazard and survival in this model, we also quantify aspects of its relations to and interactions with other variables. For purposes of comparison, we include the model based on the same sets of covariates but without the inclusion of metastasis. In addition we formulate another model considering only the patients whose tumors had become metastatic during the course of the study. This model further emphasizes the importance of ER status in metastatic cancers, and in this case the clinical variables completely eclipse the gene expression variables. The conclusions we reach regarding the relationship of metastasis with these gene expression and clinical variables lead us to interesting issues in the underlying biology.
Methods and Models
Here we present the proportional hazard form of the hypertabastic model, which will be used to analyze the survival time of the breast cancer patients. The hypertabastic distribution function is defined as follows
The hypertabastic probability density function is given by
The hypertabastic proportional hazard model has a hazard function of the form


For this paper we will use
S(t | x, Θ) for the proportional hazards model has the form

See19,20 for other cases such as the accelerated failure survival model. We also note that this model displays robustness with respect to departure from distribution, as demonstrated in.19–21 Furthermore, the results of this paper demonstrate this model works effectively with this breast cancer survival data. This model is compared with other parametric survival models such as Weibull and log-logistic, displaying a lower AIC than these other models. The Akaike Information Criterion (AIC) is a useful statistical measure 22 for comparing different models.
This model is applied to the 295 patient study from the Netherlands Cancer Institute which is presented in 1 as a validation set for the seventy gene signature. All of these patients had stage I or II breast cancer but had no previous history of cancer, save non-melanoma skin cancer. The study combined both lymph node positive and lymph node negative patients. All of these patients had been treated by modified radical mastectomy or breast-conserving surgery. Of the patients with lymph node positive disease, 120 were treated with adjuvant chemotherapy and/or hormonal therapy. For more information regarding this study, please see. 1
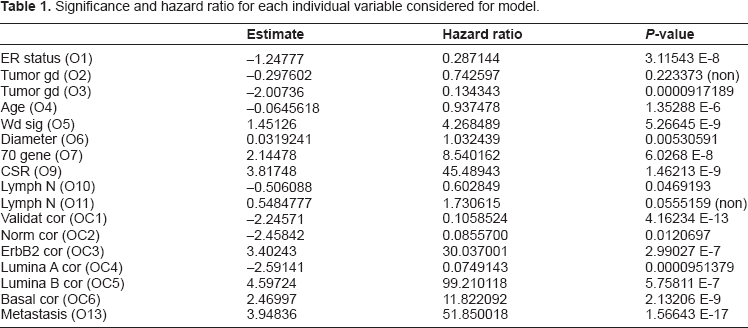
Here we discuss further the different variables that were included as potential covariates in the model. The first class of variables was the clinical variables, including the following: estrogen receptor (ER) status (O1), tumor grade (O2 and O3), age (O4), diameter (O6), and lymph node status (O11 and O12). The primary gene expression variable we tested was the seventy gene signature (O7) of 9 which selected genes for prediction of early distant metastasis. In addition we used two wound response gene signature of Chang et al,10,11 the wound response signature (O5) and the core serum response (CSR) correlation (O9). Finally, in the area of gene expression for classification of molecular subtype, we considered correlation used for validation in 1 (OC1), and with centroids for normal (OC2), ErbB2+ (OC3), Lumina A (OC4), Lumina B (OC5), and Basal (OC6) from. 4 However, these classification variables were only included at the last step, after the clinical and other gene expression variables were selected. At that point only the classification variables whose correlations to the variables already selected are low enough were considered. Our most important variable, metastasis (O13), is not measurable at the outset of the study, but rather over the entire course of the study. This variable represents whether or not the tumor metastasizes over the course of the study. We are most interested to measure its quantitative effect on survival and to investigate its relations with and effects on the other variables.
In implementation of the hypertabastic survival model to this set of data, we considered the clinical, gene expression, and classification variables described above. We applied a standard forward selection of variables procedure. In addition, since some of the variables are highly correlated, we used a procedure that would ensure no two of the variables considered would have a pairwise correlation of 0.5 or higher. The parameters were estimated using a SAS program, and these results were checked against the results using Mathematica. The SAS programs can be found in the Appendix.
Once the parameters had been estimated, these values were used in the survival function (3) and hazard function (2). Then Mathematica was utilized to sketch graphs of the hazard and survival functions for the desired cases. Further analysis of the time course of these curves and of their derivatives was also made using Mathematica.
Use of the hypertabastic model for survival analysis provides additional tools and methods beyond those available through Cox regression. Beyond the increased accuracy provided by the hypertabastic model, it is also possible to give explicit functions describing the time course of both hazard (2) and survival (3). The explicit survival functions can be used to compute probabilities of survival to a given time for a patient with any profile from the relevant covariates.
Results
In order to help describe and quantify the role of metastasis in determining survival, as compared to other covariates, we begin with a comparison of models. The primary model includes metastasis as a covariate, together with all potential covariates described above. This model is compared with the model with metastasis removed. These models will be compared on the basis of standard statistical measures of accuracy, such as Log Likelihood and Akaike Information Criterion (AIC). We are also concerned with the relationships between metastasis and the other variables. We begin with a measurement of the significance (P-value) and hazard ratio of each variable, when considered individually, as presented in Table 1. It is then possible to assess the impact of the inclusion of metastasis on each individual variable.
Significance and hazard ratio for each individual variable considered for model.
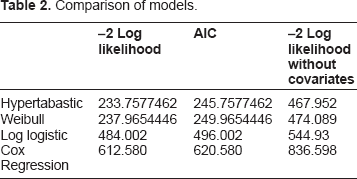
For the overall model we make a comparison of the hypertabastic model with several other parametric models, including Weibull and log-logistic. In Table 2, we give –2 Log Likelihood and AIC for each of these models. In order to see the role of the covariates, we also include –2 Log Likelihood without covariates included, as a baseline for each model. Hypertabastic is the most accurate of these models, although we see that Weibull also fits the data well. The values for Cox regression are also included in this table. When comparing with the model without metastasis, the hypertabastic also has the least error, and we give the AIC for this case as 399.755, as compared to 245.758 when metastasis is included. Although the value of 399.755 is significantly lower than the baseline, the inclusion of metastasis achieves another level of accuracy. Although this is not unexpected due to the nature of the metastasis variable, it does give a quantitative measurement of the significance of this variable for survival.
Comparison of models.
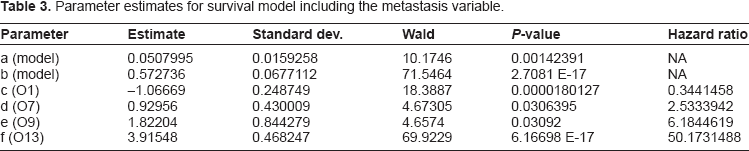
In models with multiple covariates, the P-values tend to decrease, and the hazard ratios also tend to diminish (move closer to 1), as compared to when each variable is considered alone. In effect, such combined models assess relative importance of each covariate in determining hazard and survival. This is observed for both the primary model with metastasis included, and for the model with metastasis removed. In Table 3 we present the parameter estimates, together with the corresponding P-values and hazard ratios, for the primary model. Here the variables included are ER status (O1), seventy-gene signature (O7), CSR correlation (O9), and metastasis (O13). Although there is some overlap, the model without metastasis has a different set of covariates. The gene expression variables O7 and O9 are common to both models, however the model without metastasis also includes correlation to the ErbB2+ centroid (OC3) and the variable Age (O4). The hazard ratios for these variables O4, O7, O9, and OC3 are 0.929139, 3.316102, 14.305299, and 4.765631, respectively. The P-values are 6.89083 E-7, 0.001962, 0.00015235, and 0.0320818, respectively. Note that the ER status (O1) is not included in the overall model without metastasis, although it does have considerable significance when considered individually. This change is the most dramatic difference between the two models. Also noteworthy are the dramatic differences in the significance of the gene expression variables O7 and O9. We treat these issues further in the Discussion section, below. We note that the model without metastasis is also very interesting, one reason being its inclusion of three separate gene expression variables in its assessment of hazard and survival. We will treat this model in a separate paper, in which we analyze the role of each of these variables, and their relative importance in directing the time course of hazard and survival.
Parameter estimates for survival model including the metastasis variable.
The other dramatic difference that can be observed from the above data is the difference, both qualitatively and quantitatively, of the metastasis variable from the other covariates. Both the significance and impact of the metastasis will be practically unaffected by the inclusion of other covariates, marking a dramatic difference with the other variables. Also, if we look closely at the data, we observe a curious relationship between ER status and metastasis as covariates. These covariates have a synergistic relationship in which both variables increase in both significance and impact when considered together. In Table 4 we investigate the role of metastasis on each individual variable considered for the model and how its inclusion changes hazard ratios and P-values, as compared to the values of each variable considered alone, as given in Table 1. Note, in particular the dramatic increase in the P-value of ER status, increasing by a factor of 73.731, whereas most other significant variables have a decrease in significance. The Discussion will treat the relation of metastasis with other variables, and in particular ER status, in greater detail.
Effects of inclusion of metastasis on other variables.
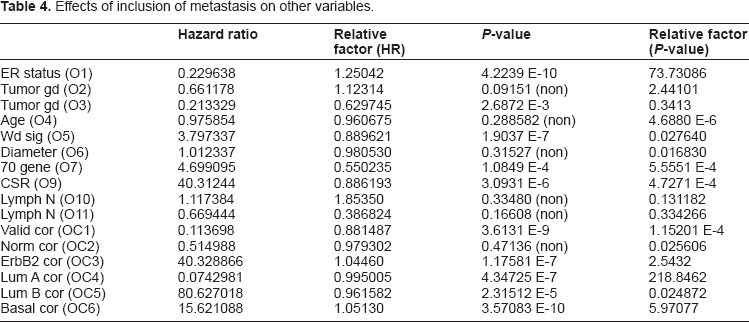
From the above results we note the essential difference between the interaction of ER status with metastasis, as compared to the interaction of all the other variables. ER status (O1) was among the select group of molecular subtype variables, which were the only significant variables to increase in significance (lower P-value) with inclusion of metastasis. This increase by a factor of approximately seventy-four is highly significant. The other variables which increase are the correlations to the ErbB2+, Lumina A, and Basal centroids, used for classification into molecular subtype. Recall ER status can also be used in determining molecular subtype, as described above and in,2,17,18 thus these variables are closely allied. Note also that these variables are highly correlated to ER status (O1) so that they could not be used together in the model. The ER status variable was used in the model because it is the most significant. All the other significant variables decrease in significance, from one in three to approximately one in two hundred thousand. The gene expression variables O7 and O9 decrease in significance by a factor of approximately one in two thousand. Furthermore ER status is one of the few significant variables for which the hazard is magnified rather than diminished. The hazard ratio is magnified by a factor of 1.2504 for ER status, and metastasis also experiences a similar magnification in significance, by a factor of 5.595 when included with ER status (O1). This symbiotic relationship between the ER status and metastasis variables indicates a strong relationship between these variables with a significant impact on survival. We note that there is a similar relationship for these other variables (OC3, OC5, and OC6), all of which are variables for correlation with molecular subtype of the cancer, thus with a certain similarity with ER status. Something very interesting is happening in the relation between the ER status variable and the variable for metastasis, and it appears to relate to the differences in invasiveness and response to treatment for cancers of different molecular subtype.
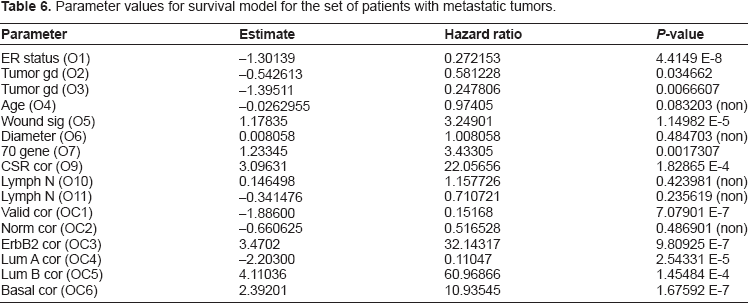
For our next result we present the survival model yielded by restricting our attention to only the metastatic group of patients. This model extends the trends observed above, where the gene expression variables decline in significance. In fact, in this model the ER status has completely eclipsed the gene expression variables, and the model is based solely on clinical variables, in particular ER status and tumor grade. The information in Table 5 gives the parameter estimates for this model, as well as the hazard ratios and P-values for all the covariates. See Table 6, particularly in comparison to the values in Tables 1 and 4 of the models described above, to see the changes in P-value and hazard for each potential covariate. Note that while the seventy-gene signature and wound healing based gene expression variables decline enough in significance so their P-values are on the level of standard clinical variables in the original model, the other set of gene expression variables based on correlation to molecular subtype have not declined as much, and the ErbB2+ correlation has increased slightly.
Parameter values for survival model for the set of patients with metastatic tumors.
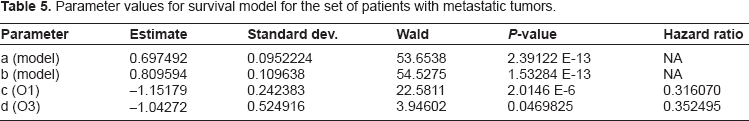
Parameter values for survival model for the set of patients with metastatic tumors.
The main themes we have observed in this section are the dominant significance of metastasis on prediction of survival and the corresponding effects on both clinical and gene expression variables. These themes will be continued below in the Discussion. In particular we work out the time course of the progression of hazard and decline in survival, and the influence of the covariates, especially metastasis. In addition we explore the surprising synergistic interaction between ER status and metastasis.
Discussion
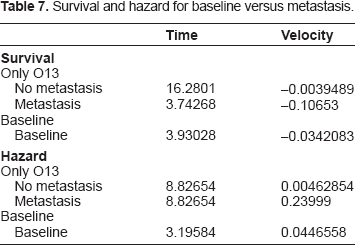
We begin with discussion of the importance of metastasis as a variable in determination of the outcome in the survival analysis. The magnitude of the impact of metastasis is clearly visible in the following graphs in Figures 1 through 5 in this section. We begin with Figure 1 comparing the baseline survival and hazard graphs with the curves representing presence and absence of metastasis. Table 7 contains the location of the relative extrema for these curves.
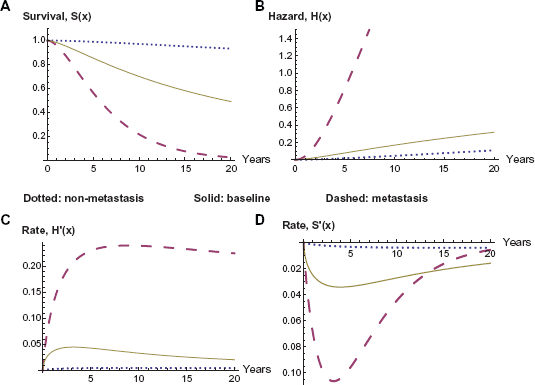
Survival and hazard: metastasis versus baseline.
Survival and hazard for baseline versus metastasis.
As discussed above, metastasis maintains both its significance and its impact even when combined with other variables. In contrast, the gene expression variables lose a significant amount of their impact on hazard and survival when combined with metastasis, as we will be able to observe in the following graphs. Furthermore ER status increases in both significance and impact on hazard and survival when combined with metastasis. This interaction between ER status and metastasis may be the most significant change when including metastasis as a variable. Its P-value changes P-value from (3.11543 E-8) to (4.22393 E-10). More significantly, this change is enough to put this variable on the same level as the gene expression variables and including it as a variable in the model. Furthermore its coefficient increases in absolute magnitude, rather than decreasing as with almost all of the other variables, adjusting hazard ratio from Exp(–1.24777) to Exp(–1.47125) and yielding a larger impact on both the survival and hazard curves. In the analysis of the variables given in the current model, ER status proves to have a larger impact on the hazard and survival functions, as compared to the seventy-gene signature, as we illustrate in the graphs in Figure 2 below. Also observable is the overwhelming impact of the metastasis variable, clearly dividing the eight curves into two groups. Note also the dramatic difference in the times and magnitudes of the maximum rate of decline in survival between the metastatic and non-metastatic groups, as recorded in Table 8.
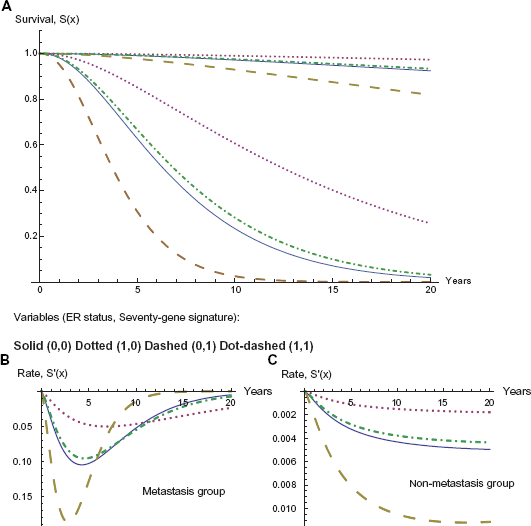
Effect of ER status and seventy gene signature; metastasis and nonmetastasis.
Effect of ER status and 70 gene signature on maximum decline in survival.
In Figure 2 we note the larger impact of ER status. Beginning with the solid curve representing a good prognosis in the seventy gene signature and a negative ER status, if we downgrade the seventy gene signature to a poor prognosis but change the ER status to positive, the net effect is a slight improvement in survival percentage, in the dot-dashed curve.
Although the CSR correlation has a diminished hazard ratio and a much lower P-value in this model, its hazard ratio (6.1845) is still large enough to display some impact on survival. Note however that these graphs vary over a wide range of CSR correlations, while the majority of the data varies within a somewhat smaller range, yielding, in the majority of cases, a smaller range of impact than demonstrated in the above graphs. We observe this impact in the graphs of Figure 3, which is much more dramatic in the case of metastasis in the graph on the left. The relative extrema for the rates of change are given in Table 9.
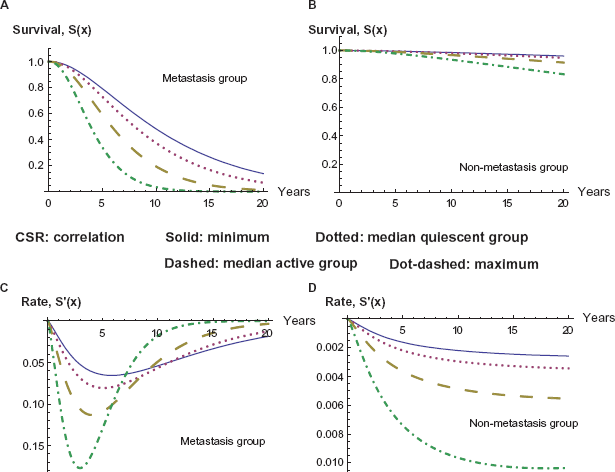
Survival curves for varying CSR correlation with and without metastasis.
Maximum decline in survival at several levels of CSR correlation.
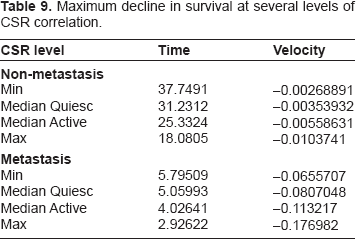
Note that in Figure 3 and Table 9 compared to Figure 2 and Table 8 we can see that ER status (O1) and seventy-gene signature (O7) combine to form an impact on survival slightly larger than CSR correlation (O9), even for wide variations in this correlation. This is further evidence of the increase in impact of ER status (O1) and decrease of the gene expression variables.
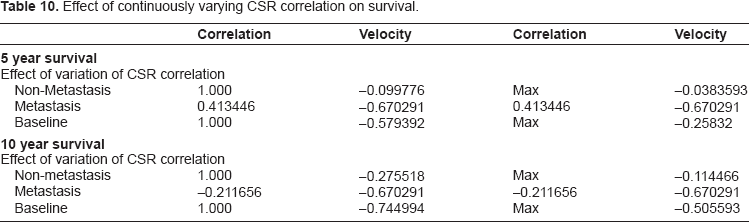
We also explore the effect of CSR correlation as a continuous variable and its impact on survival to a given time. We allow the CSR correlation to vary, staying within the range of values observed in the data set, and investigate the effects on survival and hazard. In Figure 4 we compare the impact of varying CSR correlation on survival to 5 years and 10 years, respectively. In both cases we observe a significantly larger impact of CSR correlation when the tumor metastasizes. The baseline case in the middle refers to the model without metastasis as a covariate, as described above. The derivatives are also given, and their extrema can be found in Table 10 following the graphs.
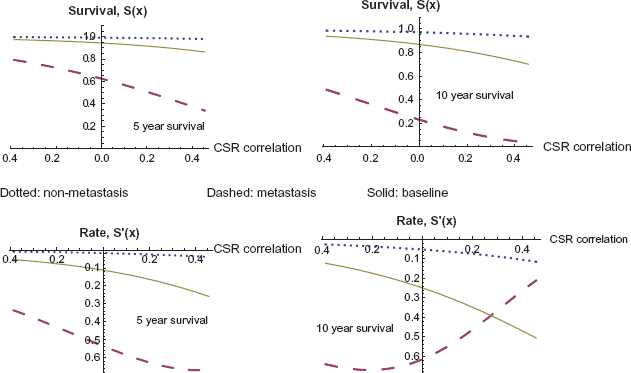
Five and ten year survival as a function of CSR correlation, with and without metastasis.
Effect of continuously varying CSR correlation on survival.
We finally consider survival as a function of both time and CSR correlation, and we observe the graphs of these survival functions in Figure 5. The two surfaces on the graph represent the cases of non-metastasis and of metastasis, and the metastasis case has a dramatically lower survival, as before.
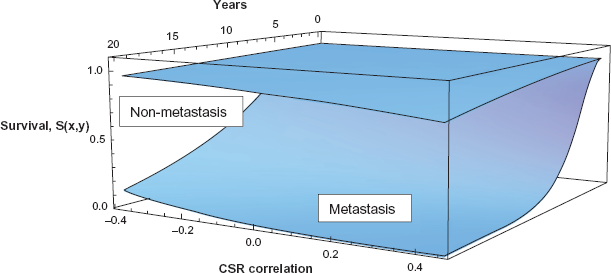
Survival as a function of time and CSR correlation, with and without metastasis.
The above graphs have clearly demonstrated the predominance of the metastasis variable in determining survival. Together with inclusion of this variable there was a marked decline in both the significance of the gene expression variables and in their impact on the hazard and survival functions. Although the graphical analysis is needed to work out the time course of these effects, the impact of metastasis on the gene expression variables is clearly visible from the change in hazard ratios and P-values. While metastasis remains virtually unchanged throughout, the seventy gene signature (O7) changes from a hazard ratio of 8.5402 and P-value of 6.0268 E-8 when considered alone to a hazard ratio of 2.5334 and P-value of 0.03064 in the combined model including metastasis, approaching the marginal level of significance. In a combined model without metastasis (O7) is clearly more significant, with hazard ratio of 3.316102 and P-value of 0.001962. The variable CSR correlation (O9) experiences a similar effect. Its original values are a hazard ratio of 45.4894 and P-value of 1.4621 E-9 when considered alone, diminishing to a hazard ratio of 6.1845 and P-value of 0.03092 when included in the combined model with metastasis. Again the variable recovers some significance in a combined model without significance, with a hazard ratio of 14.305299 and P-value of 0.00015235. Our forthcoming paper explores the relative importance of these gene expression variables in the absence of the metastasis variable and the time course of their effects on hazard and survival. However, it is clear from the above that these gene expression variables are entirely unlike the metastasis variable which maintains both its hazard ratio and P-value with inclusion of any other variables.
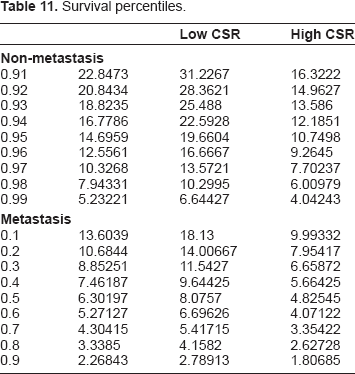
The explicit survival and hazard functions determined from the hypertabastic model allowed the above analysis of the time course of both of these functions and their graphical representation. This is a large improvement over semi-parametric models, such as Cox regression. Furthermore the explicit survival functions allows for explicit computation of survival to any given time for a patient with any given profile in the covariates of the model. We apply such computation of survival probabilities to produce a table of survival percentiles below in Table 11. In this table we first compare the cases of non-metastasis versus metastasis and notice a dramatic difference in the percentiles. Then we further refine our patient profiles to look at the effects of low CSR versus high CSR in order to view the effects of this variable in combination with metastasis.
Survival percentiles.
The important relationship between ER status and metastasis that we observed above is a new discovery worthy of further investigation. Recall a similar relationship also held between metastasis and certain other variables (ErbB2+, Lumina A, and Basal) representing classification of the cancer into molecular subtype. Molecular subtype, as well as ER status, relate to both the invasiveness of the tumor and its resistance to treatment. As these aspects of the tumor biology play an increasingly critical role when the tumor metastasizes, we expect the increase in significance of these variables relates to the underlying biology of metastasis and molecular subtype. We also observed a particularly marked decrease in significance, on the order of one in two thousand, for the other gene expression variables, namely the seventy gene signature (O7) and the wound response variables (O5, O9). These variables form the basis of the model when metastasis is not included as a variable, and we conclude their primary impact on survival is through inclusion of numerous pathways directly related to the biology of metastasis.
These important themes are extended in the rest of the study and borne out by the data. The model produced to describe the survival for the patients with metastatic tumors emphasizes this point. In this case the model is strictly based on clinical variables, and the ER status has become the most important variable. Many of the other variables are still significant when considered individually, and we present the hazard ratio and P-value for each in Table 6. This information can be used to identify the significant covariates in determining survival for a metastatic tumor. Furthermore, comparison with Tables 1 and 4 above can be used to observe the effect of metastasis on the given variable. We observe again how ER status increases in significance, while the gene expression variables decrease considerably in significance. This tells us that a significant part of the power of these gene expression variables lies in assessing whether or not the cancer will metastasize. Note also that while the gene expression variables relating to classification into molecular subtype (OC2 to OC6) do decrease somewhat, they still maintain a higher level of significance. Although molecular subtype has considerable importance in determining survival for a metastatic tumor, the model tells us that ER status is more significant. It is likely a more effective means of measuring a number of overlapping properties in the tumor biology. Note however that the overall model has only two clinical variables: ER status (O1) and tumor grade (O3).
Furthermore in Figure 6 we show a graph of the survival function for each of the four cases: ER status positive or negative and tumor grade of poorly differentiated or not poorly differentiated. Apparently, if either of the higher risk categories, poorly differentiated or ER negative, is in evidence, then survival is low, with a six year survival rate in the neighborhood to fifty percent. Furthermore, if both risk factors are present, even survival to three years is near fifty percent. However if neither of these risk factors are present, then survival rates are considerably heightened, though still not nearly as good as the non-metastatic cases.
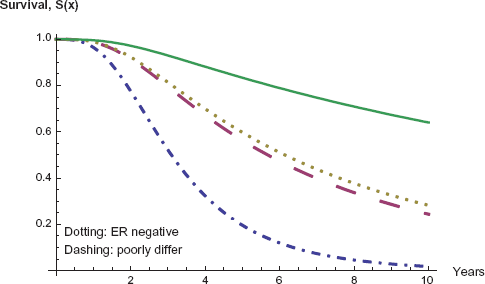
Survival for metastatic patients: variables of ER status and tumor grade.
It is interesting that when considering only the metastatic patients, the model reduces to only clinical variables. Although the gene expression variables still have some significance if considered individually, their effects have now been masked by the ER status. This presents more evidence that the gene expression signatures (O5, O7, and O9) have their largest impact on survival through prediction of whether or not the tumor will metastasize. For this population of patients with metastatic tumors the standard clinical variables of ER status and tumor grade are shown in this model to be most significant in predicting survival. This also further highlights the interesting relation between the ER status and existence of metastasis in the tumor. The underlying biology of both metastasis and the role of ER status in breast cancers are still being considered, and we believe future researchers may find some interesting relations between these two.
Conclusions
It is highly significant that in our quest to understand metastasis and to find a good model for prognosis of survival we have come full circle to a model with only clinical variables as covariates, in particular ER status (O1) and tumor grade (O3). Note these both relate to tumor subtype and the related issue of invasiveness. Although the gene expression signatures are still significant individually, they have been surpassed by ER status and do not appear in the final model. For this group of patients with metastatic tumors, the ability of the gene signatures to identify metastasis no longer plays a role, and the issue of survival is now more closely tied to other issues, such as the degree of invasiveness and how well the primary tumor and metastases respond to therapy.
Note, however, that the combined model with metastasis included as a covariate occupies an intermediate position. It is somewhere between the above model for metastatic patients in which all covariates are clinical variables and the model without metastasis as a covariate, which is dominated by three gene expression signatures. In the combined model the gene expression signatures retain a certain amount of their significance. Nevertheless the ER status has surpassed them in significance through its interaction with the metastasis variable. Of these two gene expression variables, the seventy gene signature (O7) and the CSR correlation (O9), their differential response to the inclusion of metastasis also has interesting implications for their predictive capacities regarding survival for patients with metastatic tumors. As CSR correlation (O9) maintains a significant hazard ratio in the presence of the variable for metastasis (O13), we project that this core serum response signature includes some genes related to progression of the metastasis and invasiveness, beyond simply the potential for the tumor to metastasize. We also see in the graphs of Figures 3 and 4 that CSR still has some role beyond metastasis variable it still has significance in determining survival. We note, however, that in the combined model with the metastasis variable, both O7 and O9 had comparable P-values, (0.0306395) and (0.03092), respectively, and that ER status much greater significance, with a P-value of (0.0000180127).
In addition to a quantitative measurement of metastasis as a variable in the survival model, we also notice its strong influence on the other variables in the model. Although the metastasis variable is essentially unchanged, its influence on the other clinical and gene expression variables is strong. As observed above, the gene expression variables decrease in significance, and we have used this quantitative information to explore the extent to which these signatures measure other relevant information beyond the potential of the tumor to undergo metastasis. Perhaps the most interesting discovery was the increase in significance for the clinical variable ER status (O1). All of these points raise important and intriguing issues in the underlying biology, both in relation to the gene expression signatures and metastasis of the cancer and also in relations between the ER status and metastasis. These biological relations are partially understood, but there remains more to be discovered.
There also remain a number of important points to investigate in survival modeling of breast cancer patients. Using these same variables, it would be useful to model both time to metastasis and time of survival beyond metastasis. Furthermore it would be good to consider using different sets of parameters, or even variables corresponding to different subtypes of tumors that are known to exhibit distinct behaviors, for instance grouping into ER positive and ER negative, or grouping according to the molecular subtypes of.4,5
In the model of metastasis cases the clinical variables surpass the importance of the gene expression variables. This model points to the importance of these variables, as compared to gene expression variables for prediction in cases when metastasis is known to have occurred. In a future work we hope to explore further this direction of study, forming a best model for the metastasis cases and possibly comparing the behavior across different cancer types. Note that it would also be useful to develop an independent gene expression variable that predicts outcome across the cases of metastatic tumors.
Disclosures
Author(s) have provided signed confirmations to the publisher of their compliance with all applicable legal and ethical obligations in respect to declaration of conflicts of interest, funding, authorship and contributorship, and compliance with ethical requirements in respect to treatment of human and animal test subjects. If this article contains identifiable human subject(s) author(s) were required to supply signed patient consent prior to publication. Author(s) have confirmed that the published article is unique and not under consideration nor published by any other publication and that they have consent to reproduce any copyrighted material. The peer reviewers declared no conflicts of interest.