
Abstract
In vitro-expanded intervertebral disc (IVD) cells could be a source for disc repair. However, IVD cell characterization still remains challenging and is demanded to detect phenotypical shifts. Therefore, the aim of the present study was to determine IVD cell expression profile during two- and three-dimensional culturing in direct comparison to in situ conditions.
Human IVD tissue was analyzed immunohistologically and
Introduction
Intervertebral disc (IVD) degeneration leads to discogenic neck or low-back pain and limits life quality and increases health costs.1,2 The IVD is a hypocellular tissue (only 1% of tissue volume is represented by cells).
3
Mature IVD lacks blood supply and has only limited self-healing capacity.3,4 It is characterized by a complex histological structure consisting of the
Therefore, in this study, an initial characterization of both IVD cell populations during expansion in culture was undertaken. Then, a hydrogel-based IVD tissue engineering approach was developed to characterize them under 3D in vitro conditions and to compare them directly with native IVD tissue.
Materials and Methods
IVD cell isolation
IVD tissue fragments were discarded during anterior lumbar interbody fusion surgeries. Tissue was obtained from patients after giving informed consent, and data were kept pseudonymous. Fibrocartilage chips of IVDs were cut into 1- to 2-mm-diameter slices. They were derived from nine individuals in an age range of 11-73 years (mean age: 43.91 ± 25.12 years). Chondrocytes were isolated enzymatically by means of incubation with 2% pronase (Serva Electrophoresis GmbH, Heidelberg, Germany) for 1 hour and afterwards with 0.1% collagenase (Serva) for 16 hours. Isolated fibrochondrocytes (passage 0) were cultivated in T25 or T75 cell culture flasks depending on isolated cell number (Sarstedt AG, NÜmbrecht, Germany) at 37°C and 5% CO2. The culture medium consisted of 85% Ham's F-12/ Dulbecco's modified Eagle Medium (DMEM) (1:1; Biochrom AG, Berlin, Germany), 10% fetal calf serum (Biochrom AG), 1% l-glutamine (Biochrom AG), 1% essential amino acids (Biochrom AG), 1% ascorbic acid (Sigma-Aldrich AG, Munich, Germany), 1% partricin (Biochrom AG), and 1% penicillin/streptomycin (Biochrom AG). For the monolayer experiments, cells were plated at 15,000 cells/cm2 in T75 flasks (Sarstedt AG) for RNA analysis and Petri dishes (3.5 cm diameter) with eight poly-l-Lysin (Biochrom AG)–coated coverslips (VWR, Darmstadt, Germany) per dish for immunolabellings.
3D hydrogel cultures
Cells were embedded at a cell concentration of 2–3.75 × 10 6 cells per mL into 2.5% alginate, and alginate was polymerized using 0.1 M CaCl2 for 30 minutes, rinsed with 150 mM NaCl, and cultivated in growth medium.
A chicken-derived collagen hydrogel was used to embed the IVD cells (chicken atelo-collagen with about 90% type I and 10% type III collagen [3D Collagen Cell Culture System kit; Millipore Corporation, Billerica, USA]). The gel was prepared as described by the manufacturers' protocol; 2–3.75 × 10 6 cells per mL IVD cells were embedded in the gel during its polymerization. The seeded gels were placed in agarose-coated (1%, suitable for cell culture; Sigma-Aldrich) cavities of a multiwell plate and were overlaid with growth medium and cultured for 7 days. Medium changes were executed every 2–3 days.
Cell viability assay
To estimate the cell viability in seeded scaffolds, a fluorescein diacetate (FDA, Sigma-Aldrich)/ethidium bromide (EtBr; Carl Roth GmbH, Karlsruhe, Germany) staining was performed after 7 days of cultivation. A part of the gel was cut for the staining and rinsed in PBS. This slice was incubated for 2 minutes in 9 μg/mL FDA and 10 μg/mL EtBr dissolved in PBS in the dark. The green (living cells, FDA) or red (dead cells, EtBr-stained) fluorescence was monitored by confocal laser scanning microscope (TCS SPE II; Leica Microsystems, Wetzlar, Germany).
Histological staining procedures
For histological staining procedures, either paraffin sections (
For Alcian Blue (AB) staining, the sections or coverslips were incubated for 3 minutes in 1% acetic acid and then stained for 30 minutes in 1% AB (Carl Roth GmbH). Subsequently, they were rinsed in 3% acetic acid. Counterstaining of cell nuclei was performed using nuclear fast red aluminum sulfate solution (Carl Roth GmbH) for 5 minutes.
Finally, all sections were rinsed with aqua dest and subsequently dehydrated in an ascending alcohol series. Then, the sections were embedded with Entellan (Merck, Darmstadt, Germany). All slices were analyzed by light microscopy (Axioskop 40 microscope; Carl Zeiss Jena, Germany). Photos of the sections were taken using an Olympus camera XC30 (Olympus Soft Imaging Solutions GmbH, Muenster, Germany).
Gene expression analysis using real-time detection polymerase chain reaction
Gene expression was determined using real-time detection polymerase chain reaction (RTD-PCR). Total RNA of AF and NP cells was isolated from T75 flasks using the RNeasy-Mini-Kit (Qiagen GmbH, Hilden, Germany) according to the manufacturer's instructions. RNA quantity and quality was evaluated with the Nanodrop ND-1000 spectrophotometer (Peqlab Biotechnologie GmbH, Erlangen, Germany) or RNA 6000 Nano assay (Agilent Technologies, Santa Clara, USA). Equal amounts of total RNA (500 ng in a volume of 20 μL) were reverse transcribed using the QuantiTect reverse transcription Kit (Qiagen) according to the manufacturer's instructions. One microliter of the complementary DNA (cDNA) was amplified by RTD-PCR in a 20-μL reaction mixture using specific primer pairs for type I and type III collagen, decorin, aggrecan, cartilage oligomeric protein (COMP), sox9, and the ligament markers scleraxis as well as the housekeeping gene β-actin (all obtained from Applied Biosystems, Foster City, USA). Assays were performed using the TaqMan Gene Expression Assay (Applied Biosystems) or the Quantitec Gene Expression Assay (Qiagen) in an Opticon 1–Real-Time-Cycler (OpticonTM RTD-PCR; Bio-Rad, Hercules, USA) according to the manufacturer's protocols. For each primer used in this study, an efficiency test by means of a linear regression analysis using IVD cell cDNA was performed. Relative amounts of messenger RNA expression for the gene of interest and the β-actin were calculated using the AACT method. 9
Immunolabeling of IVD cells
IVD cells (derived from AF or NP) were cultured for 96 hours on coverslips. Then, cells were fixed using 4% paraformaldehyde for 15 minutes before being rinsed in Tris-buffered saline (TBS: 0.05 M Tris, 0.015 M NaCl, pH 7.6). Paraffin sections of IVDs, fixed cells on coverslips, or cryosections of hydrogel cultures were subsequently blocked with protease-free donkey serum ([Merck Millipore, Billerica, USA], 5% diluted in TBS) for 30 minutes at RT and rinsed and incubated with the polyclonal rabbit anti–type II or type I collagen antibodies, decorin (all obtained from Acris Antibodies, Herford, Germany), rabbit–anti-human sox9 (Millipore Corporation/Chemicon International, Billerica, USA), scleraxis antibody (Acris Antibodies) or monoclonal mouse tenascin C antibody (GeneTex Inc, Biozol, Eching, Germany) in a humidifier chamber overnight at 4°C. Coverslips were immunolabeled in a similar manner. Sections and coverslips were subsequently washed with TBS before incubation with donkey–anti-rabbit or donkey–anti-mouse Alexa-Fluor® 488 (10 mg/mL; Invitrogen, Carlsbad, CA, USA) and secondary antibodies followed for 30 minutes at RT. Negative controls included omitting the primary antibody or using human IgG as primary antibody during the staining procedure. Cell nuclei were counterstained using 4′,6-diamidino-2-phenylindole (DAPI, 0.1 μg/mL; Roche). To reveal the cytoskeletal architecture of AF and NP cells, coverslips with fixed cells were also stained with phalloidin–CruzFluor555 (Santa Cruz Biotechnology, USA) for 1 hour and then embedded in a similar manner as described below. Labeled sections were rinsed several times with TBS, embedded with Fluoromount G (Southern Biotech, Biozol Diagnostica, Birmingham, USA), and examined using fluorescence microscopy (Axioskop 40; Carl Zeiss). Images were taken using a XC30 camera (Olympus Soft Imaging Solutions GmbH).
Statistical analysis
All values were expressed as mean with standard deviation. Differences between groups (AF and NP cells) were analyzed using Wilcoxon signed rank test and one-sample
Results
Histological analysis of IVDs
AF tissue appeared as hypocellular tissue with lamellar structure consisting of fiber bundles. AF cells possessed in situ–elongated or ovoid cell nuclei partly surrounded by lacunae (Fig. 1). The ECM in the NP tissue was more loosely and irregularly structured with few rounded cells surrounded by lacunae. Particularly the AF and also the NP tissue revealed a high sulfated GAG content discernible by high AB staining intensity. Especially the pericellular ECM surrounding the lacunae was rich in GAGs. Cells were surrounded by a capsule-like pericellular ECM. In some areas, cells within the NP tissue formed clusters consisting of two to three or more cells (Fig. 1). Focal degenerative tissue areas could also be detected.
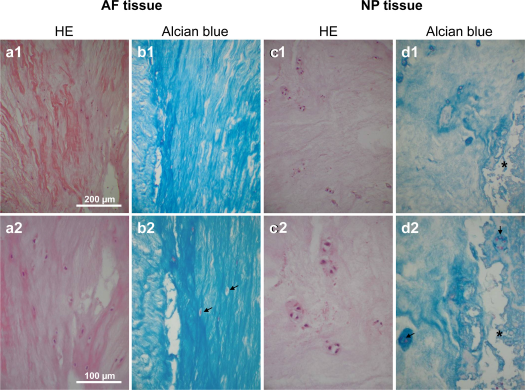
Histological structure of IVD tissue. HE stainings (a, c) and AB (b, d) stainings of AF (a, b) and NP (c, d) tissue are shown at lower and higher magnifications. Scale bar: 200 μm (
Immunohistological analysis of IVDs
Type II and I collagen could be localized in AF tissue. Particularly, the pericellular capsules surrounding the fibrochondrocytes were rich in both collagen types (Fig. 2). Tenascin C could not be detected in situ in the AF tissue. A faint nuclear signal for scleraxis expression was also discernible in AF tissue (Fig. 2).
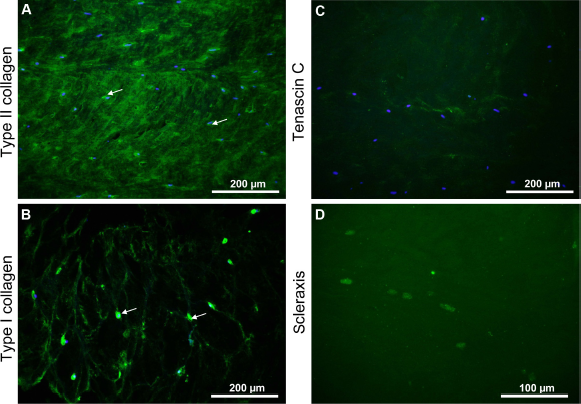
Immunohistological analysis of IVD tissue. Type II (
Morphology of IVD cells in two-dimensional culture
Both AF and NP cells seeded at similar density revealed a fibroblast-like phenotype. They possessed long cytoplasmatic cell extensions communicating with each other (Fig. 3). In contrast to the AF cells, the NP cells formed even longer cytoplasmic and often branched extensions, often had a more slender cell body, and stopped proliferation at lower density. Between passages (P) 2–3 and P6 no major morphological differences became evident between both cell types (Fig. 3).
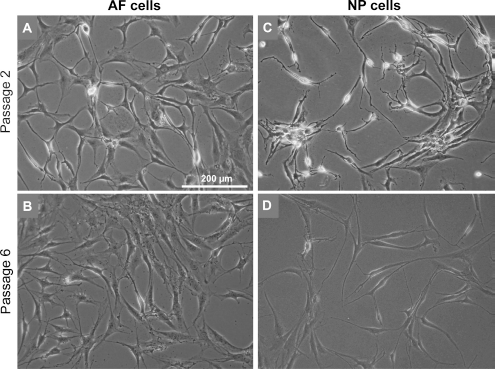
Morphology of IVD cells during expansion in monolayer cultures. Representative micrographs of AF (
IVD cell protein expression in two-dimensional culture
Cells expressed types I (Fig. 4) and II collagen (not shown), decorin, and sox9 (Fig. 4) during monolayer expansion from P2 until P6. Type I collagen immunostaining increased during cell expansion. It was intracellularly detectable in the perinuclear rough endoplasmatic reticulum (rER) region of the cells; also, extracellular fibrils attached to the AF and NP cells could be detected (Fig. 4). Cytoskeletal architecture of AF and NP cells was shown by phalloidin–CruzFluor555 staining, and a higher number of F-actin stress fibers were detectable in both cell types in P6 compared with P2. AF and NP cells of some donors revealed an increase in cell size in P6 compared with P2. Decorin immunoreactivity had a faint cytoplasmic distribution. Sox9 staining was visualized in the cytoplasm and in some cells also in the cell nuclei (Fig. 4, black arrows). The fibroblast marker tenascin C (Fig. 4) was also detectable throughout the whole observation period in NP and AF cell monolayers. Distinct pericellular tenascin C deposits and formed fibrils (Fig. 4, white arrows) could be detected in cultures of both cell types at P2 and P6. A faint cytoplasmic staining for scleraxis could also be detected (not shown).
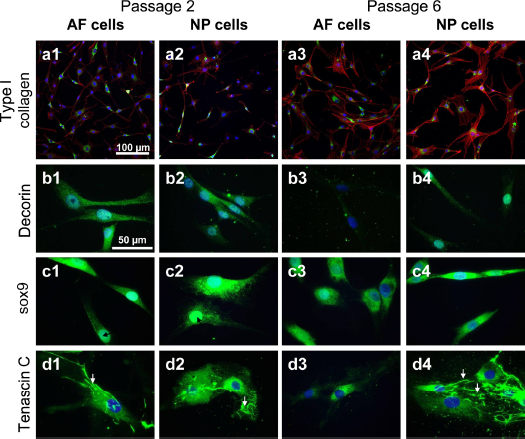
Protein expression of IVD cells (passages 2 and 6) in monolayer culture. Type I collagen (green) and phalloidin-CruzFluor555 (red) (
IVD cell gene expression during expansion in two-dimensional culture
Monolayer-cultured IVD cells expressed the gene coding for the tendon/ligament marker scleraxis. Several differences in the gene expression profiles of AF and NP cells in regard to the investigated markers could be detected, which, however, did not reach a statistical significance level. Scleraxis, for example, was more expressed in P2/3 NP than in AF cells. AF and NP cells in P2/3 revealed differences in the gene expression of type I and III collagens as well as COMP, which were expressed lower in NP compared with AF cells. In contrast, the genes coding for small proteoglycan decorin, the large proteoglycan aggrecan, and the chondrogenic transcription factor sox9 were more expressed in NP cells. In P6, the expression levels of sox9 and scleraxis were nearly similar but not those of the collagens, decorin, and aggrecan (Fig. 5).
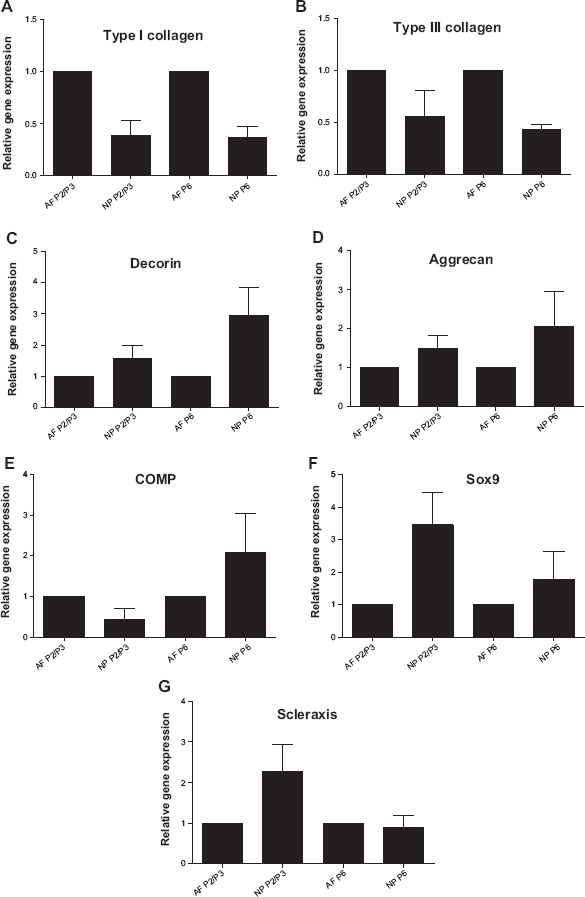
Gene expression of IVD cells during expansion in monolayer culture. Type I (
Characterization of IVD cells in 3D hydrogel culture
Three-dimensional cultures could be a strategy to restore cartilage-specific protein expression. For this reason, 3D hydrogel cultures were tested. IVD cells (NP and AF) were mostly homogenously distributed within both types of hydrogels (Figs. 6 and 7). Already on the first day of culture some elongated NP cells and to a lesser degree elongated AF cells could also be detected in the collagen gels. The number of elongated cells increased at day 3, but less elongated cells could be found on day 7. In the alginate gels, AF and NP cells remained rounded throughout the whole observation period. Some cell clusters of both cell types formed, and proliferating cells could be observed in alginate (Fig. 6, arrows). The majority of NP and AF cells were still viable after 7 days in both types of hydrogels. However, in the alginate a higher number of viable cells could be found in the outer zones (Fig. 7). HE staining of the hydrogel cultures at day 7 did not reveal major differences (Fig. 8). AF cells showed an elongated phenotype at day 7 in collagen but not in alginate gel culture.
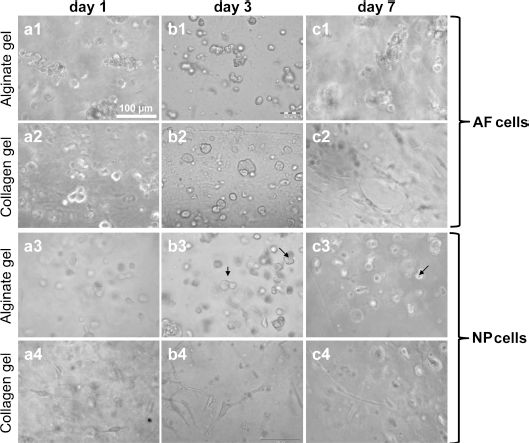
Morphology of IVD cells in hydrogel cultures. Representative light microscopic pictures of AF (
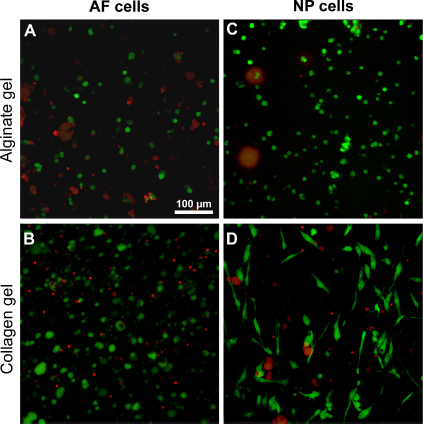
Viability of IVD cells in hydrogel cultures. Cell viability was assessed in AF (
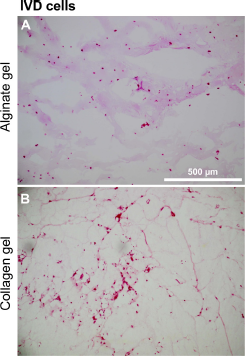
Histology of IVD cells in hydrogel cultures. Histology of the 7-day-old alginate and collagen hydrogel cultures of IVD cells were assessed using HE staining (
Discussion
Some features of IVD degeneration could be detected in the sample material included in the present study characterized by cell cluster formation and tissue areas containing a disintegrated and more fibrous ECM. Unfortunately, there is only a very restricted availability of healthy human IVD tissue for analysis. The use of animal-derived IVD tissues is limited by interspecies diferences.10,11 Tissue alterations due to degeneration or ageing complicate the interpretation of results and explain high standard deviations between independent experiments based on IVD cells of different donors. Nevertheless, there still remains an intriguing need to find reliable markers to characterize NP and AF cell phenotypes and to prove the maintenance of their specific expression profile during expansion in culture. 12
It is well known that a phenotypic shift can be observed during expansion of IVD cells in monolayer culture, 13 which was detectable in the present study by morphological changes and a shift in the protein expression profile. NP cells formed long, thin, and partly branched cellular processes already early in culture (P2). It is also known that such cytoplasmic extensions are present in vivo, detectable in situ by cytoskeletal staining, which could be important for sensing mechanical strain. 3 In this study an increase in type I collagen could be detected in both cell types during two-dimensional (2D) culture. This shift is well known in 2D culture of chondrocytic cells. 14 In situ, NP cells express usually type II collagen, whereas AF cells predominantly produce type I collagen. 15 So far, we have not found a marker that could clearly distinguish between NP and AF cells in this study. However, the small proteoglycan decorin, the chondrogenic transcription factor sox9 and also scleraxis are more typical for NP cells and collagen type I and III for AF cells. Expression of the fibroblast marker tenascin C and scleraxis in IVD cells has not yet been reported. Tenascin C expression in 2D cultures of AF and NP cells could indicate an expression shift due to 2D culturing since it could not be shown in situ. Both NP and AF cells seem to share distinct similarities with ligament cells since they expressed the tendon marker scleraxis. However, the scleraxis immunoreactivity was lower when compared with tendon tissue (not shown). 3D culture could be a strategy to mimic in vivo conditions more closely than 2D culture; particularly, hydrogels share similarities with the NP gel-like ECM, which is rich in reversibly bound water. In the beginning of hydrogel cultures, NP cells exhibit a rounded shape. Cell shape is well known to influence expression profile being associated with a particular cytoskeletal architecture. 16 In hydrogel culture, some cells die during the adaption to 3D conditions, due to the embedding and gel polymerization procedure as well as the burden of a cellular reorganization process. The density of alginate hydrogels depends on the content of alginate. In agreement with other studies based on articular or auricular chondrocytes,14,17 a 2.5% alginate content was selected for IVD cell culturing. Another study revealed that biomechanical characteristics of 2% alginate gels closely resemble that of NP tissue. 8 Moreover, the biosynthetic phenotype of NP cells could be preserved in alginate for 4 weeks. 8 However, this alginate concentration could be too high for NP cells. The resulting gel could be too stiff and might prevent cell elongation, reorganization, and migration and therefore lead to increased cell death at later culture time points. Nevertheless, cells were able to start proliferation in alginate, but the daughter cells did not migrate within the alginate, hence forming cell clusters. A high cell concentration was selected based on other studies with chondrocytes.14,17 This high cell number (2–3.75 × 10 6 /mL hydrogel) differs from the low cellularity observed in native NP and AF tissue in vivo (only 1% cell volume in NP) 3 but accounts for the above-mentioned cell death rate during culturing. In the present study, the collagen gel leads to more promising results with NP cells, eg, by allowing early cell elongation, probably migration and a higher rate of cell survival. Collagen gels supplemented with disc-derived cells or mesenchymal stem cells could be a basis strategy for reconstruction of degenerated IVDs. In human IVD samples, multiple features of degeneration can often be observed.2,3
Conclusions
AF and NP cells express the fibroblast marker tenascin C in vitro and the ligament marker scleraxis in vitro and in situ. Flexible hydrogels such as collagen gels that allow homogenous cell distribution, NP cell migration, and elongation could be a promising ECM substitute for IVD tissue engineering.
Author Contributions
Conceived and designed the experiments: GS-T, SA. Analyzed the data: ML, CM, BK, ZH, MH. Wrote the first draft of the manuscript: GS-T. Contributed to the writing of the manuscript: SA. Agree with manuscript results and conclusions: GS-T, ML, CM, WE, BK, ZH, MM, MM, MH, SA. Jointly developed the structure and arguments for the paper: GS-T, SA. Made critical revisions and approved final version: WE, SA. All authors reviewed and approved of the final manuscript.
Footnotes
Acknowledgements
We thank Ke Wang for his support. Equipment was provided by the Sonnenfeld Foundation, for which we want to express our gratitude at this point.