
Abstract
Epidemiological studies have linked exposure to ambient particulate matter (PM) with increased asthmatic symptoms. Diesel exhaust particles (DEP) are a predominant source of vehicle derived ambient PM, and experimental studies have demonstrated that they may have adjuvant potential when given with an antigen. We previously compared 3 DEP samples: N-DEP, A-DEP, and C-DEP in a murine ovalbumin (OVA) mucosal sensitization model and reported the adjuvant activity to be: C-DEP ≍ A-DEP > N-DEP. The present study analyzed gene expression changes from the lungs of these mice. Transcription profiling demonstrated that all the DEP samples altered cytokine and toll-like receptor pathways regardless of type, with or without antigen sensitization. Further analysis of DEP exposure with OVA showed that all DEP treatments altered networks involved in immune and inflammatory responses. The A- and C-DEP/OVA treatments induced differential expression of apoptosis pathways in association with stronger adjuvant responses, while expression of cell cycle control and DNA damage pathways were also altered in the C-DEP/OVA treatment. This comprehensive approach using gene expression analysis to examine changes at a pathway level provides detailed information on events occurring in the lung after DEP exposure, and confirms that the most bioactive sample induced many more individual genes and changes in immunoregulatory and homeostatic pathways.
Introduction
Epidemiology studies have reported an association between increased ambient particle matter (PM) levels and hospital admission rates due to respiratory illnesses including asthma. 1 Diesel exhaust particles (DEP) are an important contributor to ambient PM and many studies have focused on DEP as a model anthropogenic pollutant. DEP consist of a carbon core surrounded by various amounts of adsorbed organic compounds, including polycyclic aromatic hydrocarbons (PAHs), quinones, and nitro-PAHs. 2 Human and rodent studies have shown that DEP augments the induction of allergic lung disease when given with an antigen.3–6 Although the chemical composition and biologic mechanisms associated with the adjuvant effects of DEP are not well understood, the organic components of DEP and resulting oxidative stress responses are thought to skew the immune system towards a T-helper 2 (TH2) response.7–10
The composition of DEP varies greatly depending on the type of engine, load, and method of collection, which in turn can alter its biological function. Singh et al 8 investigated the chemical characteristics and pulmonary toxicity of two different particles, an automobile derived DEP (A-DEP) and National Institute of Standard Technology standard reference material 2975 (N-DEP) generated from a heavy forklift. The two particle samples exhibited disparate pulmonary toxicity and mutagenic activity, which reflected their dissimilar chemical composition. Recently, we assessed the effects of N-DEP, A-DEP, and a newer particle termed C-DEP (generated from a diesel engine used to power a compressor) in a murine ovalbumin (OVA) mucosal sensitization model. 11 These samples differed in their percentage of dichloromethane (DCM) extractable organic material (EOM) and PAHs with N-DEP, C-DEP, and A-DEP containing 1.5%, 18.9%, and 67% EOM, and 47, 431, and 522 µg of PAHs per gram of DEP, respectively. Immune and inflammatory endpoints demonstrated the degree of allergic adjuvancy as follows: C-DEP/OVA ≍ A-DEP/OVA > > N-DEP/OVA suggesting that the amount of PAHs rather than the total organic content tracked with adjuvant activity. Consistent with this strong degree of adjuvancy post-challenge, the C-DEP exposure at sensitization increased the influx of eosinophils, neutrophils, and lymphocytes, and the production of TH2 cytokines, while reducing levels of the TH 1 cytokine IL-12 in the BALF. 11 In contrast, the elemental carbon rich N-DEP/OVA induced a milder TH2 phenotype post-sensitization while the A-DEP did not alter measured post-sensitization values, but displayed strong adjuvant activities post-challenge. 11 We have previously demonstrated that inhalation exposure to fresh diesel exhaust (DE) from the same engine that produced the C-DEP sample at an occupationally relevant dose, caused mild adjuvant effects compared to air controls. 12 Global gene expression analysis showed that the DE in combination with OVA sensitization altered oxidative stress and metabolism pathways, whereas DE in the absence of immunization modulated cell cycle control, growth and differentiation, G-proteins, and cell adhesion pathways. To understand more precisely which pathways and cellular signaling events were amplified by the three chemically distinct DEP samples during sensitization, we initiated a similar global genomic approach. Microarray analysis of whole-lung RNA was used to elucidate the pathways and networks involved in the effects of N-DEP, A-DEP, and C-DEP with or without allergen sensitization in BALB/C mice. The design of the study permitted direct comparison of early global gene expression changes with the previously reported pulmonary immune and inflammatory effects of DEP alone and in combination with OVA.
Materials and Methods
Animals
Female BALB/C mice (8-10 weeks old) were obtained from Charles River Laboratories (Raleigh, NC) and allowed to acclimate for a minimum of one week prior to dosing. Mice were randomly assigned to treatment groups and housed in an AAALAC-approved animal facility at the US-EPA. All animal procedures were reviewed and approved by the US-EPA's Institutional Animal Care and Use Committee. Housing environment conditions include a 12-h light/dark cycle at an ambient temperature of 22 ± 1 °C and relative humidity of 55 ± 5 °C. Mice were provided water and mouse chow
Particle Samples
Standard Reference Material (SRM) 2975 diesel exhaust particle sample (N-DEP) was purchased from National Institute of Standard Technology (NIST) (Gaithersburg, MD). The reported mean diameter of these particles was 11.2 ± 0.1 µm by area distribution, and the surface area, as determined by nitrogen adsorption, was 91 µm2/g. The certified analysis contains 11 certified concentrations and 28 reference concentrations for selected PAHs found in the DEPs. The DEP was generated by a heavy-duty forklift diesel engine and collected under “hot” conditions without a dilution tunnel.
Automobile DEP (A-DEP; courtesy of T Kobayashi, NIES, Japan) was generated and collected under conditions previously described.13,14 Briefly, the sample was generated by a light-duty (2740 cc), 4-cylinder Isuzu diesel engine. DEP was collected under “cold” (50 °C) conditions onto glass-fiber filters and on steel duct walls in a constant-volume sampling system fitted at the end of a dilution tunnel.
Compressor DEP (C-DEP) was generated in-house as described by Cao et al 15 at the EPA using a 30 kW (40 hp) 4-cylinder Deutz BF4M1008 diesel engine connected to a 22.3 kW Saylor Bell air compressor to provide 20% load. The generated particles were collected under “hot” conditions in a baghouse.
Experimental Design
DEP samples (N-, C-, A-DEP) were suspended at a concentration of 3 mg/ml in saline alone or with 0.4 mg/ml of OVA. Particles were sonicated using a Microson Ultrasonic Cell Disruptor (Micromix) for 10 min. Mice were randomly divided into 8 treatment groups containing 5 mice each, anesthetized with isofluorane, and exposed to saline, 20 µg OVA, 150 µg DEP, or DEP + OVA by intranasal instillation on Days 0 and 13 and necropsied 18 hrs later. Additional groups of animals were held for subsequent phenotypic analysis post-challenge.
Necropsy and RNA Isolation
Mice were euthanized with sodium pentobarbital and bled by cardiac puncture. The chest wall was opened and the left lung lobe was removed, quick frozen in liquid nitrogen, and stored at –80 °C. RNA from frozen lung tissue was isolated using RNeasy (Qiagen, Valencia, CA) following manufacturer's protocol. Quantity and quality of the RNA was measured using a Nanospot and Agilent Bioanalyzer (Agilent Technologies, Palo Alto, CA), respectively. Three mice were randomly selected from each group of five animals for microarray analysis.
Microarray
RNA samples were selected prepared, processed, and hybridized to the Affymetrix Mouse 430 A gene chip at Expression Analysis (Durham, NC), as described in the GeneChip Expression Analysis Manual (Affymetrix; Santa Clara, CA). The hybridized probe array was stained with streptavidin phycoerythrin conjugate and scanned by the GeneChip® Scanner 3000 (Affymetrix; Santa Clara, CA). The amount of light emitted at 570 nm is proportional to the bound target at each location on the probe array.
The Mouse 430 A Genome chip contains over 22,000 probe sets representing over 14,000 well-characterized mouse genes. A detailed description can be found at http://www.affymetrix.com/products/arrays/specific/mouse430.affx. A total of 24 gene chips representing lung samples from 24 individual mice (8 treatments, N = 3) were used in this study. The microarray data have been deposited at Genome Expression Omnibus database (http://www.ncbi.nlm.nih.gov/geo/) and are accessible through GEO series accession number GSE22357.
Overall Data Analysis Strategy
The analysis approach of this data set, consisting of 2 controls and 6 treatment groups, was to use a binary comparison approach of each treatment group compared to its respective control: N-DEP and saline, A-DEP and saline, C-DEP and saline, N-DEP/OVA and OVA, A-DEP/OVA and OVA, and C-DEP/OVA and OVA. The analysis of these data sets consisted of: 1) evaluating the data quality; 2) performing principal components analysis (PCA) for a global inspection of within group sample correspondence and to examine model and dose effects; 3) performing Gene Set Enrichment Analysis (GSEA) to determine differentially expressed gene sets between a treatment group and its control; 4) extracting core genes responsible for a particular gene set identified as significant from the GSEA analysis; 5) determining common differentially expressed genes across treatment groups; 6) mapping core genes to functional pathways using KEGG pathways and MetaCore GENEGO® to identify altered pathways and networks unique or in common among the treatments.
Principal Component Analysis (PCA)
PCA transforms microarray data from all gene chips to a new coordinate system using an orthogonal linear transformation, which identifies a lower dimensional coordinate system that accounts for most of the variance in the data set. This analysis was employed to survey the data for within-group outliers and model and dose effects using Rosetta Resolver (Rosetta Inpharmatics, Agilent Technologies, Palo Alto, CA) following linear weighting normalization (
Gene Set Enrichment Analysis (GSEA)
GSEA is a powerful computational method that utilizes an
Pathway Level Analysis
The gene sets with a false discovery rate (FDR) q-value of <0.01 were used to create a core gene list. The core gene list is comprised of genes responsible for a gene set being considered significant. These genes were exported and then applied to two pathway analysis programs, KEGG Pathway Analysis (http://gather.genome.duke.edu/) and MetaCore GENEGO® (http://ww.genego.com/metacore), which maps genes to pathways and determines pathway significance. All pathways with a
Results
Principal Component Analysis (PCA)
PCA was applied to provide a multidimensional gene expression profile of each gene chip in a 3 dimensional space to reveal clusters in the experimental data. All data from the 24 gene chips were analyzed with each dot representing a gene chip (Fig. 1a). After analysis the gene chips were then highlighted in either blue (OVA treatment) or red (saline control). Good separation of the two groups was observed, illustrating a model effect between antigen and saline. The saline group appeared to be more tightly clustered than OVA indicating lower within group variability. To determine if exposure to chemically different DEP samples induces diverse genetic profiles, the gene chips were highlighted according to diesel sample (purple- A-DEP and A-DEP/OVA, blue- C-DEP and C-DEP/OVA, green- N-DEP and N-DEP/OVA, and yellow- saline and OVA) (Fig. 1b). The plot revealed separation of the saline and OVA treated C-DEP and N-DEP groups, while the saline and OVA A-DEP exposed mice clustered together.
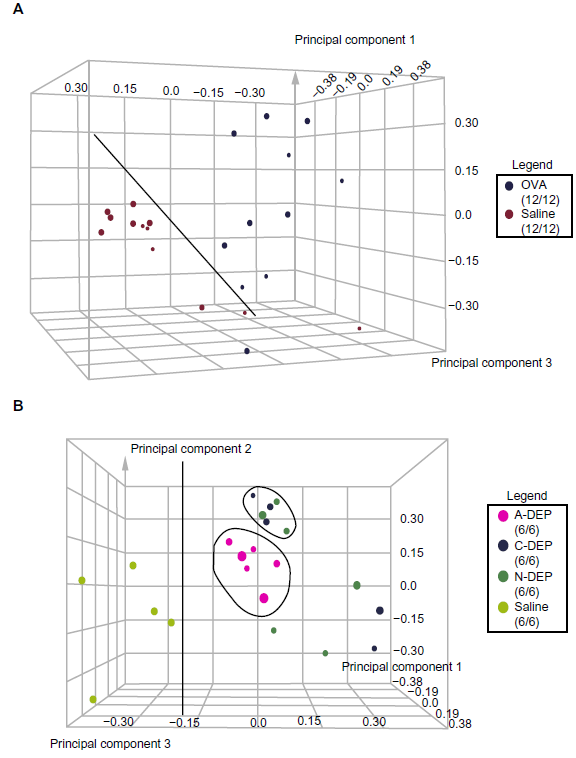
Principle component analysis (PCA) plot from microarray data. PCA plots were created in Rosetta Resolver. Each plot is a representation of all gene chip samples (8 treatments, n = 3) and each dot represents all the genes from one gene chip. Gene chips were highlighted according to the immunization protocol (A) (blue-OVA treatment or red-saline treatment) or the diesel exposure (B) (yellow- saline and saline/OVA, pink- A-DEP and A-DEP/OVA, blue- C-DEP/saline and C-DEP/OVA, and green- N-DEP/saline and N-DEP/OVA).
Gene Set Enrichment Analysis (GSEA)
GSEA was developed to overcome the limitations of relatively small individual differential gene expression changes among biologically related genes and small sample size. In contrast to conventional microarray analysis programs, the algorithm employed by GSEA derives its power by focusing on gene sets with biological relevance rather than individual genes.17,18 To test for sets of related genes that were altered in the lungs of mice exposed to the various treatments, we employed GSEA. The arrays were separated into 6 binary groups; N-DEP/saline and saline, A-DEP/saline and saline, C-DEP/saline and saline, N-DEP/OVA and OVA, A-DEP/OVA and OVA, and C-DEP/OVA and OVA. The C2 collection of curated gene sets from the MSigDB were queried and a detailed description of each gene set can be found on the website http://www.broad.mit.edu/gsea/msigdb/msigdb_zindex.html. Gene sets with an FDR q-value of <0.01 were considered significant. The number of significant gene sets associated with N-DEP, A-DEP, and C-DEP, as determined by the pairwise comparisons (DEP exposure and saline control), was 101, 90, and 98, respectively. In the context of antigen, 60, 68, and 113 gene sets were associated with N-, A-, and C-DEP/OVA, respectively. The complete list of the significant gene sets is found in Appendices 1-6.
Venn Analyses
Venn analyses were performed to identify the common genes to all DEP exposures. The core genes (those genes responsible for a gene set being considered significant with an FDR q-values of <0.01) were extracted from the significant gene sets associated with each diesel exposure identified by GSEA. A Venn diagram was constructed to identify genes common among the 3 DEP/saline exposure pairwise comparisons (Fig. 2a). A-DEP/saline exposure resulted in the greatest number of differentially expressed genes (545). 200 genes were common among all 3 DEP treatments. Similarly a Venn diagram was constructed for the genes associated with each DEP/OVA exposure (Fig. 2b). C-DEP/OVA exposure resulted in greatest number of differentially expressed genes (800). 236 genes were found common to all DEP/OVA exposures. The two sets of common genes were applied to another Venn diagram to identify the 117 common genes among all DEP exposures (Fig. 2c).
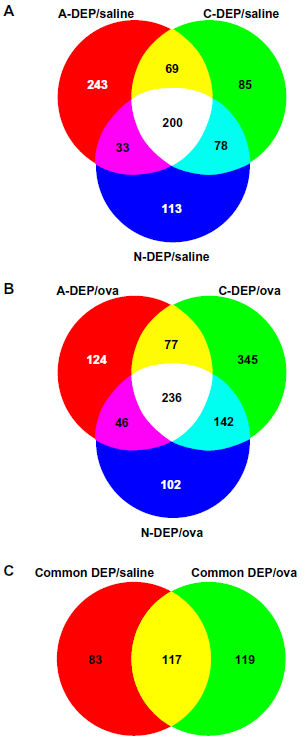
Venn analyses. Venn analyses of the core genes extracted from significantly altered gene sets in GSEA associated with A-, C-, and N-DEP/saline exposures (A) and A-, C-, N-DEP/OVA exposurse (B). Venn analysis of the common genes associated with all DEP/saline and DEP/OVA exposures (C).
KEGG Pathway Analyses
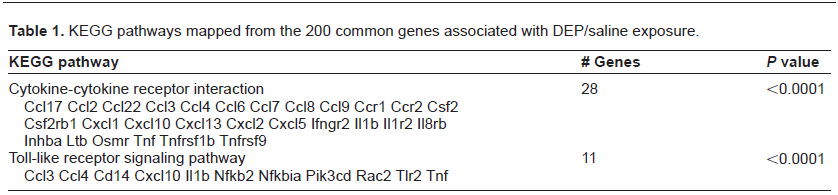
To understand the biological significance of the common genes associated with the 3 DEP/saline exposures, the 200 genes were imported into the gene annotation tool, Gather (http://gather.genome.duke.edu/), and the genes were mapped to KEGG pathways, using the criteria that pathways must have 5 or more differentially expressed genes and be over-represented based on a hypergeometric test with a
KEGG pathways mapped from the 200 common genes associated with DEP/saline exposure.
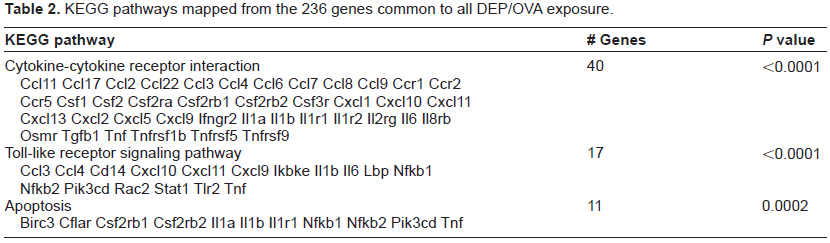
KEGG pathways mapped from the 236 genes common to all DEP/OVA exposure.
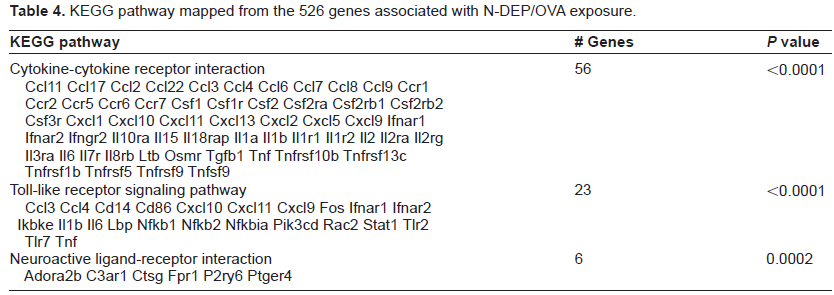
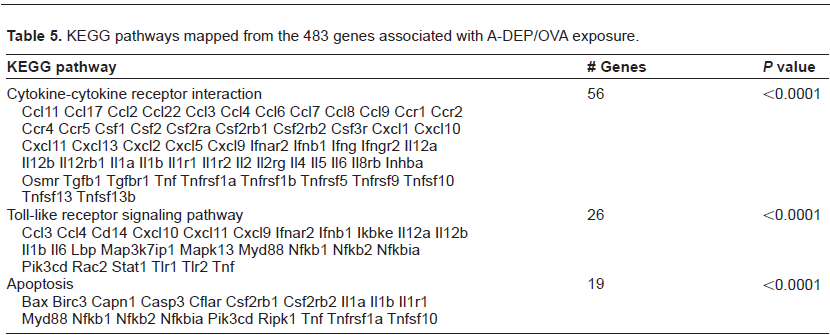
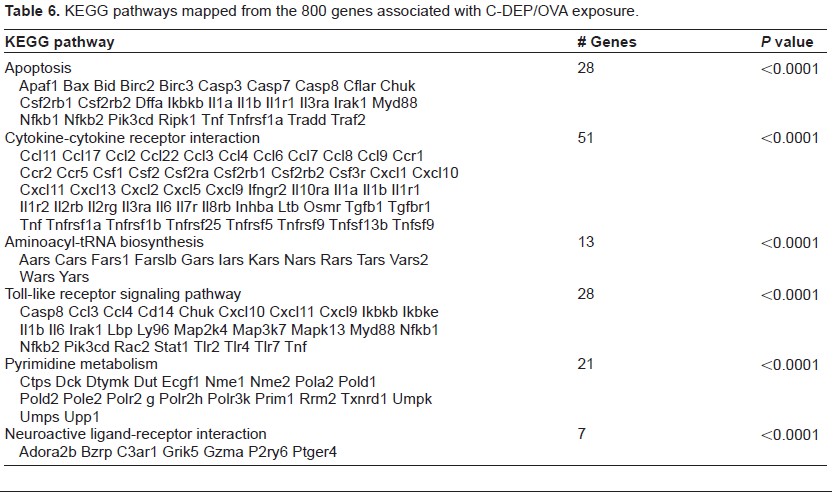
To understand the effects of the individual DEP/OVA exposures, the extracted core genes were mapped to KEGG pathways and the results represented in Tables 4–6. All 3 exposures populated the cytokinecytokine receptor pathway similarly with 56, 56, and 51 genes for N-DEP/OVA, A-DEP/OVA, and C-DEP/OVA, respectively. Additionally, the TLR pathway contained similar amounts of genes with 23, 26, and 28 genes for N-DEP/OVA, A-DEP/OVA, and C-DEP/OVA, respectively. This pathway contained TLRs as well as many pro-inflammatory cytokines and transcription factors. N-DEP/OVA and C-DEP/OVA altered the expression of genes in the neuroactive ligand-receptor interaction pathway. A-DEP/OVA and C-DEP/OVA also altered the apoptosis pathway, while additional pathways for pyrimidine metabolism and aminoacyl-tRNA biosynthesis were unique to the C-DEP/OVA exposures.
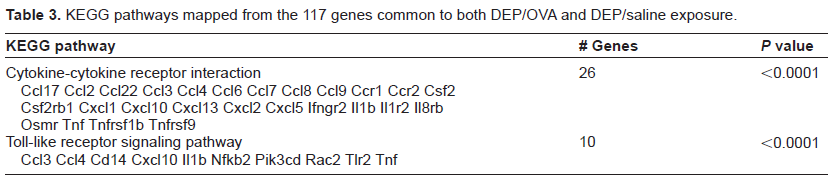
KEGG pathways mapped from the 117 genes common to both DEP/OVA and DEP/saline exposure.
KEGG pathway mapped from the 526 genes associated with N-DEP/OVA exposure.
KEGG pathways mapped from the 483 genes associated with A-DEP/OVA exposure.
KEGG pathways mapped from the 800 genes associated with C-DEP/OVA exposure.
GeneGo Analysis
The C-DEP/OVA exposure gave the highest transcriptional changes based on the numbers of significant gene sets, extracted core genes, and the KEGG pathways, however, these analyses were not specific enough to allow an inference as to why or how C-DEP was able to elicit a stronger TH2 response post-sensitization. We therefore mapped the 3 sets of genes to GeneGo curated databases and presented the results as networks and pathways. Figure 3 depicts the significance (-log(p)values) of the top 20 differentially affected GeneGo process networks for all 3 DEP/OVA exposures (N-DEP/OVA-blue; A-DEP/OVA-red; C-DEP/OVA-orange). Using this approach the similarities and differences of the groups can be clearly discerned. All groups significantly altered networks related to antigen presentation, inflammation, and cell adhesion. In addition the C-DEP/OVA exposure also altered networks related to cell cycle control, DNA damage, and protein degradation.
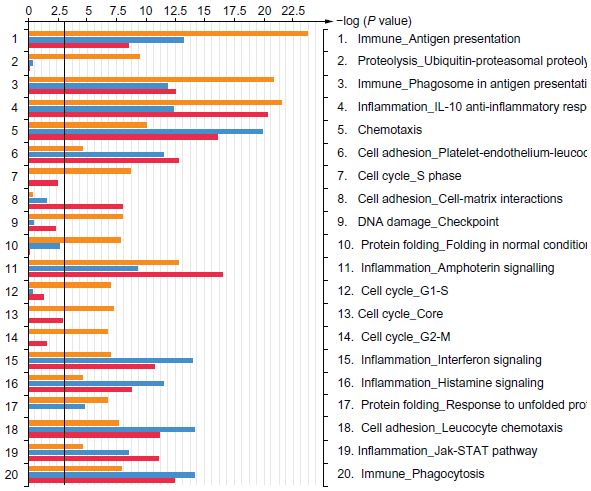
Results of GeneGo mapping of differentially affected networks. The core genes from significantly altered gene sets associated with each DEP/OVA exposure (N-DEP/OVA-blue; A-DEP/OVA-red; C-DEP/OVA-orange) was imported into GeneGo to generate a list of the top 20 networks.
GeneGo pathway analysis revealed that the pathways common to all treatments were associated with MHC class I antigen presentation, inflammation, and other pathways related to the innate immune response. The A-DEP/OVA and C-DEP/OVA common pathways were involved with TNF-a mediated apoptosis pathways whereas C-DEP/OVA alone also induced altered expression of Fas, inhibitor of apoptosis (IAP), and mitochondrial mediated apoptosis and cell cycle regulation pathways (Fig. 4).
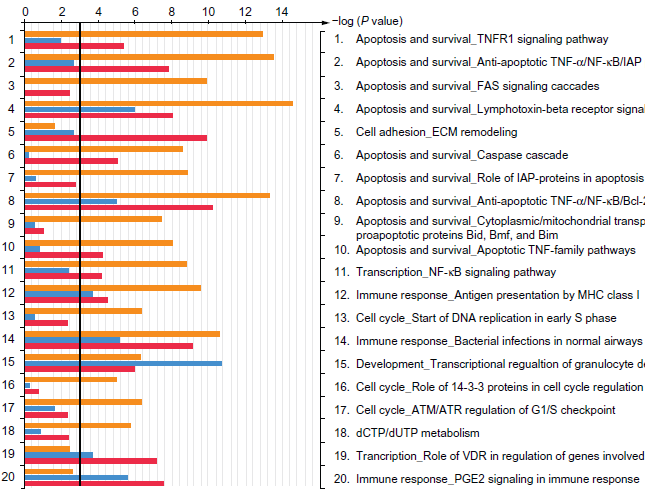
Results of GeneGo mapping of differentially affected pathways. The core genes from significantly altered gene sets associated with each DEP/OVA exposure (N-DEP/OVA-blue; A-DEP/OVA-red; C-DEP/OVA-orange) was imported into GeneGo to generate a list of the top 20 pathways.
Discussion
DEP have been reported to act as adjuvants to upregulate immune responses resulting in increased allergic lung disease; however, there is still a lack of understanding as to what DEP component or components are responsible for these effects, and the underlying mechanisms through which they act. The present study examined global transcriptional changes in the lungs of mice after exposure to three chemically distinct DEP samples (N-, A- and C-DEP) with or without antigen sensitization. Overall, all the DEP and DEP/OVA samples significantly altered cytokine and TLR pathways compared to their respective controls, however, the DEP/OVA samples induced a greater number of genes in these pathways. In addition, A- and C-DEP/OVA samples altered apoptosis pathways while the most biologically active DEP sample, C-DEP/OVA, also altered cell cycle and DNA repair networks.
We recently reported the inflammatory and adjuvant effects of the above three diesels, N-, A-, and C-DEP. 11 Although it is important to identify individual genes associated with adverse biological effects, the resulting phenotypic changes likely occur through interactions of multiple genes. Therefore, to associate transcriptional responses with the allergic phenotype we utilized a global approach to a) characterize the genomic signature of DEP as a class and b) identify pathways common and unique to the DEP/OVA exposures.
Our genomic signature response to DEP as a class compound is well supported by the literature. DEP exposure has been shown to induce lung inflammation as manifested by neutrophil infiltration and elevated levels of total protein, albumin, LDH, and reactive oxygen species (ROS) in the lung as well as up-regulation of inflammatory cytokines.3,11,12,19,20 Furthermore, DEP and other particles including ambient PM have been shown to induce TLR4 expression in the lung,21,22 while TLR4 deficient mice developed less airway inflammation in response to DEP compared to wild type controls. 23 In agreement with these findings, our results demonstrated the cytokine-cytokine receptor and the TLR interaction KEGG pathways were significantly altered in all DEP/saline exposures. These findings not only provide further evidence for the TLR pathway involvement in DEP induced inflammatory response, but also confirmed a common genomic signature response of DEP, regardless of chemical composition.
It has been established that while DEP alone can induce an inflammatory response, when given with an antigen they also act as an immunologic adjuvant.3–6 The DEP/OVA exposures did not alter KEGG pathways such as antigen processing and presentation or T cell receptor signaling. Instead, in a similar fashion to DEP alone, genomic analysis of all the DEP/OVA exposed samples displayed common alterations in the cytokine-cytokine receptor and TLR KEGG pathways. This is a likely response because under this analysis all DEP/OVA samples were compared to OVA exposure. However, compared to DEP/saline, DEP/OVA exposed samples showed a more pronounced increase in the number of genes enriched in these pathways. This provides further evidence, on the genomic level, that DEP and OVA interacted synergistically to produce an immuno-modulatory effect.
Li et al
24
proposed a hierarchical oxidative stress model to explain DEP induced effects whereby low levels of oxidative stress induce antioxidant defense mechanisms to restore redox balance in the cell (tier 1). Intermediate levels of oxidative stress (tier 2) activate MAPK and NF-κB cascades, which induce inflammation, while high levels of oxidative stress (tier 3) activate apoptosis and apoptosis/necrosis pathways.
24
In agreement with this model, the study presented here demonstrates similar effects
It has been established that DEP organic compounds can generate ROS 25 and excessive ROS production can lead to a variety of cellular responses including DNA damage. 26 In fact, oxidative DNA damage (8-hydroxydeoxyguanosine) has been detected in mouse lung DNA after DEP exposure. 27 Although the A-DEP sample contained the greatest amount of DCM EOM, C-DEP contained the greatest amount of PAHs 11 and the C-DEP/OVA exposure group was unique in significantly altering cell cycle and DNA damage pathways. Global transcriptional analysis of lung tissue revealed up-regulation of cell cycle control genes including 6 cyclin genes, 7 cell division cycle genes, 7 members of the family of MAP kinases, 2 cyclin-dependent kinases, RAS p21 protein activator 3 (Rasa3), and 5 other RAS related proteins. Although we can not say with certainty that these changes were due to the PAH content, this evidence suggests the newer C-DEP sample generated more oxidative damage.
Conclusion
In conclusion, mice exposed to all three DEP samples with or without OVA had altered cytokine and toll-like receptor pathways suggesting these responses are common to all DEPs regardless of chemical profile. All DEP/OVA exposures increased transcription of genes involved in tier 1 and 2 of the hierarchical stress response model described by Li et al.24,28,29 Additionally, A- and C-DEP/OVA exposures significantly altered the most number of apoptosis pathways (tier 3). The C-DEP/OVA also altered cell cycle and DNA damage pathways suggesting it is the most bioactive sample. While the C-DEP sample also contained the largest amount of PAHs, these studies were not designed to address whether these components were causal to the effect. Nevertheless, it is known that PAHs can induce a pro-allergic effect.30–32 This comprehensive approach using gene expression analysis to examine pathway changes at a transcriptional level provides a clearer picture of the events occurring in the lung after DEP exposure in the presence or absence of antigen. The results illustrate a wide range of altered pathways suggesting this method may be more sensitive and can be used for identifying mechanisms involved in induction of immune responses that lead to increased severity of allergic lung disease.
Funding
The project described was supported by the EPAUNC Curriculum in Toxicology Training agreement (# T829472). This paper has been reviewed by the National Health and Environmental Effects Research Laboratory, U.S. Environmental Protection Agency, and approved for publication. Approval does not signify that the contents necessarily reflect the views and policies of the Agency, nor does the mention of trade names or commercial products constitute endorsement or recommendation for use.
Disclosures
This manuscript has been read and approved by all authors. This paper is unique and is not under consideration by any other publication and has not been published elsewhere. The authors and peer reviewers of this paper report no conflicts of interest. The authors confirm that they have permission to reproduce any copyrighted material.
Footnotes
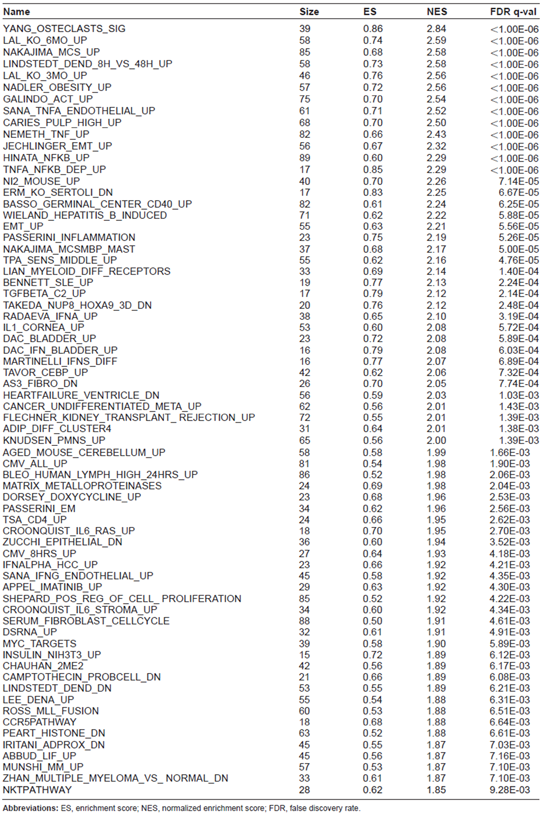
Significantly altered gene sets by N-DEP/saline compared to saline

| Name | Sise | ES | NES | FDR q-val |
|---|---|---|---|---|
| CARIES_PULP_HIGH_UP | 68 | 0.81 | 2.85 | <1.00E-06 |
| LAL_KO_3MO_UP | 46 | 0.84 | 2.80 | <1.00E-06 |
| FLECHNER_KIDNEY_TRANSPLANT_ REJECTION_UP | 72 | 0.78 | 2.79 | <1.00E-06 |
| LINDSTEDT_DEND_8H_VS_48H_UP | 58 | 0.81 | 2.78 | <1.00E-06 |
| LAL_KO_6MO_UP | 58 | 0.80 | 2.75 | <1.00E-06 |
| WIELAND_HEPATITIS_B_INDUCED | 71 | 0.77 | 2.71 | <1.00E-06 |
| GALINDO_ACT_UP | 75 | 0.74 | 2.66 | <1.00E-06 |
| YANG_OSTECLASTS_SIG | 39 | 0.84 | 2.61 | <1.00E-06 |
| NAKAJIMA_MCS_UP | 85 | 0.70 | 2.55 | <1.00E-06 |
| BLEO_HUMAN_LYMPH_HIGH_24HRS_UP | 86 | 0.69 | 2.54 | <1.00E-06 |
| BASSO_GERMINAL_CENTER_CD40_UP | 82 | 0.69 | 2.54 | <1.00E-06 |
| HINATA_NFKB_UP | 89 | 0.69 | 2.52 | <1.00E-06 |
| NADLER_OBESITY_UP | 57 | 0.73 | 2.51 | <1.00E-06 |
| SANA_TNFA_ENDOTHELIAL_UP | 61 | 0.72 | 2.50 | <1.00E-06 |
| NEMETH_TNF_UP | 82 | 0.69 | 2.49 | <1.00E-06 |
| MUNSHI_MM_VS_PCS_UP | 64 | 0.67 | 2.34 | <1.00E-06 |
| MUNSHI_MM_UP | 57 | 0.69 | 2.34 | 7.18E-05 |
| NI2_MOUSE_UP | 40 | 0.74 | 2.33 | 6.78E-05 |
| TNFA_NFKB_DEP_UP | 17 | 0.86 | 2.33 | 6.43E-05 |
| SHIPP_FL_VS_DLBCL_DN | 30 | 0.74 | 2.24 | 6.11E-05 |
| LINDSTEDT_DEND_UP | 44 | 0.69 | 2.23 | 5.81E-05 |
| TAVOR_CEBP_UP | 42 | 0.69 | 2.22 | 5.55E-05 |
| HOUSTIS_ROS | 32 | 0.73 | 2.21 | 5.31E-05 |
| MARTINELLI_IFNS_DIFF | 16 | 0.83 | 2.19 | 5.09E-05 |
| ZUCCHI_EPITHELIAL_DN | 36 | 0.68 | 2.19 | 4.88E-05 |
| TPA_SENS_MIDDLE_UP | 55 | 0.64 | 2.17 | 1.39E-04 |
| ROSS_CBF_MYH | 38 | 0.70 | 2.17 | 2.21E-04 |
| CROONQUIST_IL6_RAS_UP | 18 | 0.81 | 2.15 | 2.99E-04 |
| ZHAN_MULTIPLE_MYELOMA_VS_NORMAL_DN | 33 | 0.71 | 2.15 | 2.89E-04 |
| NAKAJIMA_MCSMBP_MAST | 37 | 0.69 | 2.14 | 3.19E-04 |
| ABBUD_LIF_UP | 45 | 0.66 | 2.14 | 3.09E-04 |
| KNUDSEN_PMNS_UP | 65 | 0.62 | 2.14 | 2.99E-04 |
| JECHLINGER_EMT_UP | 56 | 0.63 | 2.12 | 4.73E-04 |
| DAC_BLADDER_UP | 23 | 0.76 | 2.12 | 4.59E-04 |
| DAC_IFN_BLADDER_UP | 16 | 0.82 | 2.12 | 4.46E-04 |
| PEART_HISTONE_DN | 63 | 0.61 | 2.11 | 4.34E-04 |
| RADAEVA_IFNA_UP | 38 | 0.67 | 2.10 | 4.22E-04 |
| ZELLER_MYC_UP | 23 | 0.73 | 2.10 | 4.11E-04 |
| CANCER_UNDIFFERENTIATED_META_UP | 62 | 0.61 | 2.10 | 4.62E-04 |
| MARSHALL_SPLEEN_BAL | 25 | 0.74 | 2.09 | 4.50E-04 |
| PROTEASOMEPATHWAY | 21 | 0.73 | 2.09 | 4.69E-04 |
| TNFALPHA_ALL_UP | 66 | 0.59 | 2.08 | 5.41E-04 |
| EMT_UP | 55 | 0.60 | 2.08 | 5.29E-04 |
| SCHUMACHER_MYC_UP | 47 | 0.63 | 2.07 | 5.17E-04 |
| PASSERINI_INFLAMMATION | 23 | 0.73 | 2.07 | 5.05E-04 |
| APPEL_IMATINIB_UP | 29 | 0.70 | 2.07 | 4.94E-04 |
| MYC_TARGETS | 39 | 0.65 | 2.07 | 4.84E-04 |
| ADIP_DIFF_CLUSTER4 | 31 | 0.68 | 2.07 | 4.99E-04 |
| CMV_24HRS_UP | 61 | 0.61 | 2.06 | 4.89E-04 |
| OXIDATIVE_PHOSPHORYLATION | 55 | 0.61 | 2.06 | 5.28E-04 |
| CMV_ALL_UP | 81 | 0.57 | 2.05 | 6.36E-04 |
| HOFMANN_MDS_CD34_LOW_AND_HIGH_RISK | 31 | 0.68 | 2.05 | 7.14E-04 |
| FERRANDO_MLL_T_ALL_DN | 71 | 0.57 | 2.03 | 9.73E-04 |
| IFNALPHA_NL_UP | 19 | 0.74 | 2.01 | 1.16E-03 |
| ERM_KO_SERTOLI_DN | 17 | 0.77 | 2.01 | 1.18E-03 |
| AGED_MOUSE_NEOCORTEX_UP | 60 | 0.59 | 2.01 | 1.16E-03 |
| INOS_ALL_UP | 47 | 0.61 | 2.01 | 1.16E-03 |
| CANTHARIDIN_DN | 45 | 0.61 | 2.00 | 1.22E-03 |
| COLLER_MYC_UP | 17 | 0.77 | 2.00 | 1.43E-03 |
| ROS_MOUSE_AORTA_DN | 68 | 0.57 | 2.00 | 1.40E-03 |
| PROTEASOME | 17 | 0.75 | 2.00 | 1.38E-03 |
| NKTPATHWAY | 28 | 0.67 | 1.99 | 1.53E-03 |
| HADDAD_CD45CD7_PLUS_VS_MINUS_ UP | 52 | 0.58 | 1.99 | 1.51E-03 |
| IL6_FIBRO_UP | 35 | 0.63 | 1.99 | 1.48E-03 |
| HEARTFAILURE_VENTRICLE_DN | 56 | 0.59 | 1.99 | 1.55E-03 |
| APOPTOSIS | 64 | 0.56 | 1.98 | 1.84E-03 |
| TAKEDA_NUP8_HOXA9_3D_DN | 20 | 0.71 | 1.97 | 1.85E-03 |
| LIAN_MYELOID_DIFF_GRANULE | 28 | 0.67 | 1.96 | 2.33E-03 |
| HADDAD_HSC_CD7_UP | 52 | 0.58 | 1.96 | 2.39E-03 |
| ST_TUMOR_NECROSIS_FACTOR_PATHWAY | 28 | 0.67 | 1.96 | 2.56E-03 |
| MOOTHA_VOXPHOS | 73 | 0.55 | 1.95 | 2.71E-03 |
| CHAUHAN_2ME2 | 42 | 0.60 | 1.95 | 2.76E-03 |
| RIBOSOMAL_PROTEINS | 78 | 0.54 | 1.95 | 2.77E-03 |
| TNFALPHA_4HRS_UP | 34 | 0.63 | 1.94 | 2.91E-03 |
| LEE_MYC_TGFA_UP | 54 | 0.57 | 1.94 | 2.89E-03 |
| MOREAUX_TACI_HI_IN_PPC_UP | 43 | 0.59 | 1.94 | 2.97E-03 |
| BHATTACHARYA_ESC_UP | 57 | 0.57 | 1.94 | 3.07E-03 |
| BRCA_BRCA1_POS | 68 | 0.56 | 1.94 | 3.09E-03 |
| IFNALPHA_HCC_UP | 23 | 0.70 | 1.94 | 3.13E-03 |
| DSRNA_UP | 32 | 0.64 | 1.94 | 3.09E-03 |
| PROTEASOME_DEGRADATION | 32 | 0.64 | 1.93 | 3.26E-03 |
| BENNETT_SLE_UP | 19 | 0.70 | 1.93 | 3.39E-03 |
| TARTE_PC | 65 | 0.55 | 1.93 | 3.58E-03 |
| CMV_HCMV_TIMECOURSE_12HRS_UP | 21 | 0.69 | 1.93 | 3.58E-03 |
| TNFALPHA_30MIN_UP | 37 | 0.61 | 1.92 | 3.71E-03 |
| UVB_NHEK3_C0 | 73 | 0.54 | 1.92 | 3.89E-03 |
| GOLDRATH_CYTOLYTIC | 24 | 0.67 | 1.92 | 3.84E-03 |
| LIAN_MYELOID_DIFF_RECEPTORS | 33 | 0.61 | 1.92 | 3.84E-03 |
| PARK_RARALPHA_UP | 34 | 0.61 | 1.91 | 4.34E-03 |
| IL2PATHWAY | 21 | 0.68 | 1.90 | 4.71E-03 |
| STEMCELL_COMMON_DN | 54 | 0.56 | 1.90 | 4.66E-03 |
| AGED_MOUSE_CEREBELLUM_UP | 58 | 0.55 | 1.89 | 5.69E-03 |
| DER_IFNG_UP | 54 | 0.56 | 1.88 | 6.10E-03 |
| CCR5PATHWAY | 18 | 0.70 | 1.87 | 7.21E-03 |
| HALMOS_CEBP_UP | 41 | 0.57 | 1.86 | 8.29E-03 |
| ZHAN_MM_CD138_MF_VS_REST | 30 | 0.62 | 1.85 | 8.56E-03 |
| HOHENKIRK_MONOCYTE_DEND_UP | 85 | 0.51 | 1.85 | 8.52E-03 |
| ST_GAQ_PATHWAY | 24 | 0.65 | 1.85 | 8.95E-03 |
| PHOTOSYNTHESIS | 21 | 0.67 | 1.85 | 9.02E-03 |
| IFN_GAMMA_UP | 35 | 0.59 | 1.84 | 9.97E-03 |
| IFNA_UV-CMV_COMMON_HCMV_6HRS_UP | 20 | 0.67 | 1.84 | 9.88E-03 |
Significantly altered gene sets by A-DEP/saline compared to saline

| Name | Size | ES | NES | FDR q-val |
|---|---|---|---|---|
| CARIES_PULP_HIGH_UP | 68 | 0.77 | 2.89 | <1.00E-06 |
| LAL_KO_3MO_UP | 46 | 0.78 | 2.73 | <1.00E-06 |
| LAL_KO_6MO_UP | 58 | 0.73 | 2.65 | <1.00E-06 |
| DNA_REPLICATION_REACTOME | 41 | 0.75 | 2.55 | <1.00E-06 |
| ELECTRON_TRANSPORT_CHAIN | 86 | 0.65 | 2.55 | <1.00E-06 |
| CANCER_UNDIFFERENTIATED_META_UP | 62 | 0.69 | 2.51 | <1.00E-06 |
| MOOTHA_VOXPHOS | 73 | 0.67 | 2.48 | <1.00E-06 |
| YANG_OSTECLASTS_SIG | 39 | 0.74 | 2.45 | <1.00E-06 |
| MANALO_HYPOXIA_DN | 73 | 0.65 | 2.44 | <1.00E-06 |
| CANCER_NEOPLASTIC_META_UP | 59 | 0.68 | 2.44 | <1.00E-06 |
| YU_CMYC_UP | 37 | 0.72 | 2.38 | <1.00E-06 |
| GALINDO_ACT_UP | 75 | 0.62 | 2.37 | <1.00E-06 |
| OXIDATIVE_PHOSPHORYLATION | 55 | 0.66 | 2.36 | <1.00E-06 |
| FLECHNER_KIDNEY_TRANSPLANT_REJECTION_UP | 72 | 0.62 | 2.34 | <1.00E-06 |
| LINDSTEDT_DEND_8H_VS_48H_UP | 58 | 0.65 | 2.32 | <1.00E-06 |
| CANTHARIDIN_DN | 45 | 0.66 | 2.31 | <1.00E-06 |
| SERUM_FIBROBLAST_CELLCYCLE | 88 | 0.58 | 2.30 | <1.00E-06 |
| FERRANDO_MLL_T_ALL_DN | 71 | 0.61 | 2.30 | <1.00E-06 |
| SCHUMACHER_MYC_UP | 47 | 0.66 | 2.29 | <1.00E-06 |
| WIELAND_HEPATITIS_B_INDUCED | 71 | 0.62 | 2.29 | <1.00E-06 |
| ADIP_DIFF_CLUSTER4 | 31 | 0.72 | 2.28 | <1.00E-06 |
| P21_ANY_DN | 27 | 0.74 | 2.28 | <1.00E-06 |
| HOUSTIS_ROS | 32 | 0.71 | 2.27 | <1.00E-06 |
| PEART_HISTONE_DN | 63 | 0.62 | 2.27 | <1.00E-06 |
| IDX_TSA_UP_CLUSTER3 | 81 | 0.60 | 2.26 | 4.59E-05 |
| NEMETH_TNF_UP | 82 | 0.59 | 2.25 | 4.42E-05 |
| CMV_IE86_UP | 42 | 0.67 | 2.24 | 4.25E-05 |
| BLEO_HUMAN_LYMPH_HIGH_24HRS_UP | 86 | 0.57 | 2.21 | 4.10E-05 |
| INOS_ALL_UP | 47 | 0.64 | 2.21 | 3.96E-05 |
| MENSSEN_MYC_UP | 30 | 0.70 | 2.21 | 3.83E-05 |
| UVB_NHEK2_UP | 55 | 0.61 | 2.17 | 2.29E-04 |
| NI2_MOUSE_UP | 40 | 0.64 | 2.16 | 2.97E-04 |
| PROTEASOME_DEGRADATION | 32 | 0.67 | 2.15 | 4.35E-04 |
| RIBOSOMAL_PROTEINS | 78 | 0.56 | 2.15 | 4.57E-04 |
| BHATTACHARYA_ESC_UP | 57 | 0.59 | 2.12 | 5.44E-04 |
| HG_PROGERIA_DN | 24 | 0.71 | 2.12 | 5.29E-04 |
| NAKAJIMA_MCS_UP | 85 | 0.55 | 2.12 | 5.47E-04 |
| COLLER_MYC_UP | 17 | 0.76 | 2.10 | 6.62E-04 |
| HEARTFAILURE_VENTRICLE_DN | 56 | 0.58 | 2.09 | 6.74E-04 |
| OLDAGE_DN | 45 | 0.61 | 2.09 | 6.58E-04 |
| BASSO_GERMINAL_CENTER_CD40_UP | 82 | 0.54 | 2.07 | 9.37E-04 |
| DOX_RESIST_GASTRIC_UP | 30 | 0.65 | 2.06 | 1.26E-03 |
| ZELLER_MYC_UP | 23 | 0.69 | 2.04 | 1.70E-03 |
| UVB_NHEK1_C1 | 41 | 0.60 | 2.03 | 1.69E-03 |
| MOREAUX_TACI_HI_IN_PPC_UP | 43 | 0.60 | 2.03 | 1.70E-03 |
| RIBAVIRIN_RSV_UP | 18 | 0.72 | 2.01 | 2.22E-03 |
| P21_P53_ANY_DN | 35 | 0.62 | 2.01 | 2.17E-03 |
| BREAST_DUCTAL_CARCINOMA_GENES | 19 | 0.71 | 2.01 | 2.30E-03 |
| CMV_24HRS_UP | 61 | 0.55 | 2.00 | 2.42E-03 |
| REN_E2F1_TARGETS | 37 | 0.60 | 2.00 | 2.52E-03 |
| IDX_TSA_UP_CLUSTER5 | 82 | 0.52 | 2.00 | 2.49E-03 |
| CROONQUIST_IL6_STARVE_UP | 32 | 0.62 | 1.99 | 2.51E-03 |
| TNFALPHA_ALL_UP | 66 | 0.53 | 1.99 | 2.60E-03 |
| TSA_CD4_UP | 24 | 0.65 | 1.99 | 2.55E-03 |
| PYRIMIDINE_METABOLISM | 55 | 0.55 | 1.98 | 2.90E-03 |
| HINATA_NFKB_UP | 89 | 0.51 | 1.97 | 3.15E-03 |
| MYC_TARGETS | 39 | 0.59 | 1.96 | 3.66E-03 |
| ADIP_DIFF_CLUSTER5 | 34 | 0.59 | 1.95 | 4.09E-03 |
| SHIPP_FL_VS_DLBCL_DN | 30 | 0.61 | 1.95 | 4.06E-03 |
| TNFA_NFKB_DEP_UP | 17 | 0.71 | 1.95 | 4.23E-03 |
| ATP_SYNTHESIS | 20 | 0.67 | 1.95 | 4.18E-03 |
| TNFALPHA_30MIN_UP | 37 | 0.58 | 1.95 | 4.12E-03 |
| HPV31_DN | 37 | 0.58 | 1.94 | 4.28E-03 |
| P21_P53_MIDDLE_DN | 17 | 0.71 | 1.94 | 4.23E-03 |
| TAVOR_CEBP_UP | 42 | 0.57 | 1.93 | 4.64E-03 |
| PHOTOSYNTHESIS | 21 | 0.67 | 1.93 | 4.74E-03 |
| PROTEASOMEPATHWAY | 21 | 0.65 | 1.92 | 5.43E-03 |
| TARTE_PC | 65 | 0.52 | 1.91 | 5.70E-03 |
| TYPE_III_SECRETION_SYSTEM | 20 | 0.67 | 1.91 | 5.66E-03 |
| CMV_ALL_UP | 81 | 0.50 | 1.91 | 5.88E-03 |
| UEDA_MOUSE_SCN | 86 | 0.49 | 1.91 | 5.82E-03 |
| G1_TO_S_CELL_CYCLE_REACTOME | 65 | 0.51 | 1.90 | 6.40E-03 |
| STRESS_TPA_SPECIFIC_UP | 34 | 0.59 | 1.90 | 6.36E-03 |
| CELL_CYCLE | 71 | 0.50 | 1.90 | 6.42E-03 |
| FLAGELLAR_ASSEMBLY | 20 | 0.67 | 1.89 | 6.60E-03 |
| ABBUD_LIF_UP | 45 | 0.54 | 1.89 | 7.01E-03 |
| KNUDSEN_PMNS_UP | 65 | 0.51 | 1.88 | 7.46E-03 |
| TPA_SENS_MIDDLE_UP | 55 | 0.53 | 1.88 | 7.62E-03 |
| CARBON_FIXATION | 18 | 0.66 | 1.88 | 7.67E-03 |
| MMS_HUMAN_LYMPH_HIGH_24HRS_UP | 18 | 0.69 | 1.88 | 7.58E-03 |
| ZHAN_MM_CD138_PR_VS_REST | 28 | 0.62 | 1.87 | 7.97E-03 |
| ZUCCHI_EPITHELIAL_DN | 36 | 0.58 | 1.87 | 8.21E-03 |
| TIS7_OVEREXP_DN | 17 | 0.67 | 1.87 | 8.23E-03 |
| ZHAN_MULTIPLE_MYELOMA_VS_NORMAL_DN | 33 | 0.58 | 1.87 | 8.23E-03 |
| ROS_MOUSE_AORTA_DN | 68 | 0.50 | 1.87 | 8.17E-03 |
| BRENTANI_DNA_METHYLATION_AND_MODIFICATION | 23 | 0.63 | 1.86 | 8.83E-03 |
| NADLER_OBESITY_UP | 57 | 0.52 | 1.86 | 8.73E-03 |
| BLEO_MOUSE_LYMPH_LOW_24HRS_DN | 24 | 0.63 | 1.86 | 8.70E-03 |
| ET743_SARCOMA_UP | 56 | 0.51 | 1.86 | 8.63E-03 |
| UVB_NHEK3_C6 | 25 | 0.61 | 1.85 | 9.32E-03 |
Significantly altered gene sets by C-DEP/saline compared to saline

| Name | Size | ES | NES | FDR q-val |
|---|---|---|---|---|
| CARIES_PULP_HIGH_UP | 68 | 0.77 | 2.90 | <1.00E-06 |
| GALINDO_ACT_UP | 75 | 0.72 | 2.79 | <1.00E-06 |
| YANG_OSTECLASTS_SIG | 39 | 0.79 | 2.74 | <1.00E-06 |
| LINDSTEDT_DEND_8H_VS_48H_UP | 58 | 0.70 | 2.69 | <1.00E-06 |
| HINATA_NFKB_UP | 89 | 0.65 | 2.64 | <1.00E-06 |
| NAKAJIMA_MCS_UP | 85 | 0.65 | 2.58 | <1.00E-06 |
| NEMETH_TNF_UP | 82 | 0.64 | 2.57 | <1.00E-06 |
| LAL_KO_6MO_UP | 58 | 0.68 | 2.57 | <1.00E-06 |
| WIELAND_HEPATITIS_B_INDUCED | 71 | 0.66 | 2.53 | <1.00E-06 |
| LAL_KO_3MO_UP | 46 | 0.73 | 2.52 | <1.00E-06 |
| HOUSTIS_ROS | 32 | 0.75 | 2.49 | <1.00E-06 |
| SANA_TNFA_ENDOTHELIAL_UP | 61 | 0.66 | 2.48 | <1.00E-06 |
| FLECHNER_KIDNEY_TRANSPLANT_REJECTION_UP | 72 | 0.64 | 2.47 | <1.00E-06 |
| BLEO_HUMAN_LYMPH_HIGH_24HRS_UP | 86 | 0.61 | 2.45 | <1.00E-06 |
| NADLER_OBESITY_UP | 57 | 0.66 | 2.45 | <1.00E-06 |
| ADIP_DIFF_CLUSTER4 | 31 | 0.74 | 2.44 | <1.00E-06 |
| MYC_TARGETS | 39 | 0.71 | 2.44 | <1.00E-06 |
| TNFA_NFKB_DEP_UP | 17 | 0.86 | 2.42 | <1.00E-06 |
| NI2_MOUSE_UP | 40 | 0.71 | 2.41 | <1.00E-06 |
| INOS_ALL_UP | 47 | 0.68 | 2.39 | <1.00E-06 |
| TPA_SENS_MIDDLE_UP | 55 | 0.66 | 2.38 | <1.00E-06 |
| TSA_CD4_UP | 24 | 0.76 | 2.35 | <1.00E-06 |
| CANCER_UNDIFFERENTIATED_META_UP | 62 | 0.62 | 2.35 | <1.00E-06 |
| ZELLER_MYC_UP | 23 | 0.76 | 2.33 | <1.00E-06 |
| ZUCCHI_EPITHELIAL_DN | 36 | 0.70 | 2.33 | <1.00E-06 |
| CMV_IE86_UP | 42 | 0.66 | 2.26 | 5.58E-05 |
| CMV_24HRS_UP | 61 | 0.59 | 2.26 | 5.37E-05 |
| MUNSHI_MM_UP | 57 | 0.59 | 2.24 | 1.03E-04 |
| DAC_BLADDER_UP | 23 | 0.74 | 2.23 | 1.47E-04 |
| PASSERINI_INFLAMMATION | 23 | 0.71 | 2.19 | 3.21E-04 |
| BASSO_GERMINAL_CENTER_CD40_UP | 82 | 0.56 | 2.19 | 3.11E-04 |
| IDX_TSA_UP_CLUSTER3 | 81 | 0.56 | 2.18 | 4.32E-04 |
| MARTINELLI_IFNS_DIFF | 16 | 0.79 | 2.18 | 4.19E-04 |
| CMV_ALL_UP | 81 | 0.54 | 2.17 | 4.47E-04 |
| P21_ANY_DN | 27 | 0.69 | 2.16 | 4.73E-04 |
| MANALO_HYPOXIA_DN | 73 | 0.55 | 2.16 | 4.97E-04 |
| MUNSHI_MM_VS_PCS_UP | 64 | 0.58 | 2.15 | 5.20E-04 |
| FERRANDO_MLL_T_ALL_DN | 71 | 0.56 | 2.15 | 5.06E-04 |
| SHIPP_FL_VS_DLBCL_DN | 30 | 0.66 | 2.14 | 5.30E-04 |
| MMS_HUMAN_LYMPH_HIGH_24HRS_UP | 18 | 0.76 | 2.14 | 5.16E-04 |
| DAC_IFN_BLADDER_UP | 16 | 0.78 | 2.14 | 5.37E-04 |
| DNA_REPLICATION_REACTOME | 41 | 0.62 | 2.13 | 5.24E-04 |
| PROTEASOME_DEGRADATION | 32 | 0.66 | 2.13 | 5.43E-04 |
| ROSS_CBF_MYH | 38 | 0.61 | 2.12 | 7.18E-04 |
| HG_PROGERIA_DN | 24 | 0.70 | 2.11 | 7.33E-04 |
| ROS_MOUSE_AORTA_DN | 68 | 0.55 | 2.10 | 8.96E-04 |
| OLDAGE_DN | 45 | 0.60 | 2.09 | 1.05E-03 |
| COLLER_MYC_UP | 17 | 0.76 | 2.09 | 1.14E-03 |
| KNUDSEN_PMNS_UP | 65 | 0.55 | 2.08 | 1.29E-03 |
| TARTE_PC | 65 | 0.54 | 2.07 | 1.37E-03 |
| PROTEASOME | 17 | 0.75 | 2.07 | 1.37E-03 |
| DER_IFNG_UP | 54 | 0.56 | 2.06 | 1.37E-03 |
| CANCER_NEOPLASTIC_META_UP | 59 | 0.55 | 2.06 | 1.40E-03 |
| CHAUHAN_2ME2 | 42 | 0.60 | 2.06 | 1.48E-03 |
| SCHUMACHER_MYC_UP | 47 | 0.60 | 2.06 | 1.45E-03 |
| UVB_NHEK2_UP | 55 | 0.57 | 2.06 | 1.50E-03 |
| NKTPATHWAY | 28 | 0.65 | 2.06 | 1.50E-03 |
| MENSSEN_MYC_UP | 30 | 0.64 | 2.06 | 1.52E-03 |
| SERUM_FIBROBLAST_CELLCYCLE | 88 | 0.52 | 2.05 | 1.54E-03 |
| TAVOR_CEBP_UP | 42 | 0.59 | 2.05 | 1.58E-03 |
| PROTEASOMEPATHWAY | 21 | 0.69 | 2.04 | 1.71E-03 |
| IFNALPHA_NL_UP | 19 | 0.71 | 2.04 | 1.68E-03 |
| JECHLINGER_EMT_UP | 56 | 0.55 | 2.04 | 1.70E-03 |
| ABBUD_LIF_UP | 45 | 0.59 | 2.04 | 1.76E-03 |
| IL6_FIBRO_UP | 35 | 0.60 | 2.03 | 1.79E-03 |
| PEART_HISTONE_DN | 63 | 0.53 | 2.02 | 2.33E-03 |
| AS3_FIBRO_DN | 26 | 0.65 | 2.01 | 2.34E-03 |
| YU_CMYC_UP | 37 | 0.59 | 2.01 | 2.34E-03 |
| P21_P53_MIDDLE_DN | 17 | 0.71 | 2.01 | 2.31E-03 |
| STRESS_TPA_SPECIFIC_UP | 34 | 0.61 | 2.01 | 2.40E-03 |
| DSRNA_UP | 32 | 0.60 | 2.00 | 2.60E-03 |
| ERM_KO_SERTOLI_DN | 17 | 0.71 | 1.99 | 2.64E-03 |
| RADAEVA_IFNA_UP | 38 | 0.59 | 1.99 | 2.73E-03 |
| TNFALPHA_4HRS_UP | 34 | 0.60 | 1.99 | 2.90E-03 |
| CANTHARIDIN_DN | 45 | 0.55 | 1.98 | 2.97E-03 |
| IFN_GAMMA_UP | 35 | 0.59 | 1.98 | 3.04E-03 |
| HOFMANN_MDS_CD34_LOW_AND_HIGH_RISK | 31 | 0.61 | 1.97 | 3.31E-03 |
| ADIP_DIFF_CLUSTER5 | 34 | 0.59 | 1.97 | 3.27E-03 |
| TIS7_OVEREXP_DN | 17 | 0.69 | 1.97 | 3.22E-03 |
| LIAN_MYELOID_DIFF_RECEPTORS | 33 | 0.59 | 1.97 | 3.36E-03 |
| MARSHALL_SPLEEN_BAL | 25 | 0.63 | 1.95 | 4.34E-03 |
| NAKAJIMA_MCSMBP_MAST | 37 | 0.58 | 1.94 | 4.80E-03 |
| TAKEDA_NUP8_HOXA9_3D_DN | 20 | 0.67 | 1.93 | 5.19E-03 |
| PYRIMIDINE_METABOLISM | 55 | 0.52 | 1.93 | 5.34E-03 |
| TNFALPHA_ALL_UP | 66 | 0.51 | 1.92 | 6.17E-03 |
| CMV_HCMV_TIMECOURSE_12HRS_UP | 21 | 0.65 | 1.92 | 6.12E-03 |
| HEARTFAILURE_VENTRICLE_DN | 56 | 0.52 | 1.92 | 6.14E-03 |
| IFNALPHA_HCC_UP | 23 | 0.64 | 1.91 | 6.44E-03 |
| HYPOXIA_REVIEW | 68 | 0.50 | 1.91 | 6.64E-03 |
| LINDSTEDT_DEND_UP | 44 | 0.54 | 1.91 | 6.87E-03 |
| CROONQUIST_IL6_RAS_UP | 18 | 0.67 | 1.90 | 7.79E-03 |
| LEE_MYC_TGFA_UP | 54 | 0.51 | 1.89 | 7.81E-03 |
| EMT_UP | 55 | 0.51 | 1.89 | 8.20E-03 |
| LEE_ACOX1_UP | 58 | 0.51 | 1.89 | 8.21E-03 |
| BENNETT_SLE_UP | 19 | 0.65 | 1.88 | 8.45E-03 |
| ZHAN_MMPC_SIMAL | 41 | 0.55 | 1.88 | 8.40E-03 |
| P21_P53_ANY_DN | 35 | 0.57 | 1.88 | 8.63E-03 |
| BREAST_DUCTAL_CARCINOMA_GENES | 19 | 0.65 | 1.88 | 8.74E-03 |
Abbreviations: ES, enrichment score; NES, normalized enrichment score; FDR, false discovery rate.
Significantly altered gene sets by N-DEP/OVA compared to OVA

| Name | Size | ES | NES | FDR q-val |
|---|---|---|---|---|
| CARIES_PULP_HIGH_UP | 68 | 0.81 | 2.76 | <1.00E-06 |
| LAL_KO_3MO_UP | 46 | 0.83 | 2.61 | <1.00E-06 |
| LAL_KO_6MO_UP | 58 | 0.79 | 2.60 | <1.00E-06 |
| NEMETH_TNF_UP | 82 | 0.74 | 2.59 | <1.00E-06 |
| WIELAND_HEPATITIS_B_INDUCED | 71 | 0.74 | 2.54 | <1.00E-06 |
| NADLER_OBESITY_UP | 57 | 0.76 | 2.51 | <1.00E-06 |
| YANG_OSTECLASTS_SIG | 39 | 0.82 | 2.50 | <1.00E-06 |
| LINDSTEDT_DEND_8H_VS_48H_UP | 58 | 0.73 | 2.45 | <1.00E-06 |
| NAKAJIMA_MCS_UP | 85 | 0.69 | 2.44 | <1.00E-06 |
| SANA_TNFA_ENDOTHELIAL_UP | 61 | 0.71 | 2.41 | <1.00E-06 |
| BASSO_GERMINAL_CENTER_CD40_UP | 82 | 0.69 | 2.40 | <1.00E-06 |
| GALINDO_ACT_UP | 75 | 0.69 | 2.40 | <1.00E-06 |
| FLECHNER_KIDNEY_TRANSPLANT_REJECTION_UP | 72 | 0.69 | 2.39 | <1.00E-06 |
| HINATA_NFKB_UP | 89 | 0.64 | 2.26 | <1.00E-06 |
| NI2_MOUSE_UP | 40 | 0.70 | 2.16 | 3.02E-04 |
| BLEO_HUMAN_LYMPH_HIGH_24HRS_UP | 86 | 0.60 | 2.14 | 2.83E-04 |
| GOLDRATH_CYTOLYTIC | 24 | 0.77 | 2.14 | 3.32E-04 |
| BRENTANI_IMMUNE_FUNCTION | 42 | 0.68 | 2.13 | 3.75E-04 |
| JECHLINGER_EMT_UP | 56 | 0.64 | 2.11 | 5.30E-04 |
| ADIP_DIFF_CLUSTER3 | 28 | 0.73 | 2.10 | 5.03E-04 |
| TNFA_NFKB_DEP_UP | 17 | 0.80 | 2.09 | 5.83E-04 |
| YU_CMYC_DN | 53 | 0.65 | 2.09 | 5.57E-04 |
| YAGI_AML_PROGNOSIS | 31 | 0.70 | 2.07 | 7.26E-04 |
| ROSS_MLL_FUSION | 60 | 0.62 | 2.05 | 1.12E-03 |
| LIAN_MYELOID_DIFF_RECEPTORS | 33 | 0.69 | 2.03 | 1.47E-03 |
| EMT_UP | 55 | 0.61 | 2.02 | 1.50E-03 |
| PASSERINI_INFLAMMATION | 23 | 0.74 | 2.01 | 1.69E-03 |
| APPEL_IMATINIB_UP | 29 | 0.70 | 2.01 | 1.96E-03 |
| ABBUD_LIF_UP | 45 | 0.64 | 2.01 | 1.89E-03 |
| TAKEDA_NUP8_HOXA9_3D_DN | 20 | 0.74 | 2.01 | 1.86E-03 |
| LINDSTEDT_DEND_DN | 53 | 0.61 | 2.01 | 1.87E-03 |
| CMV_ALL_UP | 81 | 0.56 | 2.01 | 1.81E-03 |
| TAVOR_CEBP_UP | 42 | 0.63 | 1.99 | 2.34E-03 |
| STEMCELL_COMMON_DN | 54 | 0.60 | 1.98 | 2.89E-03 |
| SCHUMACHER_MYC_UP | 47 | 0.61 | 1.97 | 3.54E-03 |
| ERM_KO_SERTOLI_DN | 17 | 0.75 | 1.96 | 3.66E-03 |
| DAC_IFN_BLADDER_UP | 16 | 0.77 | 1.95 | 4.26E-03 |
| SANA_IFNG_ENDOTHELIAL_UP | 45 | 0.62 | 1.95 | 4.26E-03 |
| WANG_HOXA9_VS_MEIS1_UP | 25 | 0.68 | 1.94 | 4.75E-03 |
| LIAN_MYELOID_DIFF_GRANULE | 28 | 0.68 | 1.93 | 5.19E-03 |
| CMV_24HRS_UP | 61 | 0.58 | 1.93 | 5.58E-03 |
| MARTINELLI_IFNS_DIFF | 16 | 0.75 | 1.93 | 5.45E-03 |
| TARTE_PC | 65 | 0.56 | 1.92 | 5.48E-03 |
| MYC_TARGETS | 39 | 0.63 | 1.92 | 5.46E-03 |
| WANG_MLL_CBP_VS_GMP_UP | 42 | 0.61 | 1.91 | 6.10E-03 |
| XU_CBP_UP | 25 | 0.68 | 1.91 | 6.53E-03 |
| LOTEM_LEUKEMIA_UP | 22 | 0.69 | 1.91 | 6.39E-03 |
| LINDSTEDT_DEND_UP | 44 | 0.61 | 1.90 | 6.60E-03 |
| LU_IL4BCELL | 62 | 0.56 | 1.90 | 6.79E-03 |
| ZELLER_MYC_UP | 23 | 0.69 | 1.90 | 6.99E-03 |
| CASPASEPATHWAY | 20 | 0.69 | 1.90 | 6.89E-03 |
| ROSS_CBF_MYH | 38 | 0.62 | 1.90 | 6.76E-03 |
| CMV_8HRS_UP | 27 | 0.66 | 1.88 | 8.38E-03 |
| TPA_SENS_MIDDLE_UP | 55 | 0.57 | 1.88 | 8.27E-03 |
| DSRNA_UP | 32 | 0.63 | 1.87 | 8.52E-03 |
| NAKAJIMA_MCSMBP_MAST | 37 | 0.61 | 1.87 | 8.37E-03 |
| CROONQUIST_IL6_RAS_UP | 18 | 0.72 | 1.87 | 8.38E-03 |
| GENOTOXINS_ALL_24HRS_REG | 22 | 0.68 | 1.87 | 8.26E-03 |
| HOHENKIRK_MONOCYTE_DEND_UP | 85 | 0.53 | 1.87 | 8.40E-03 |
| SHIPP_FL_VS_DLBCL_DN | 30 | 0.63 | 1.87 | 8.34E-03 |
Significantly altered gene sets by A-DEP/OVA compared to OVA
| Name | Size | ES | NES | FDR q-val |
|---|---|---|---|---|
| YANG_OSTECLASTS_SIG | 39 | 0.86 | 2.84 | <1.00E-06 |
| LAL_KO_6MO_UP | 58 | 0.74 | 2.59 | <1.00E-06 |
| NAKAJIMA_MCS_UP | 85 | 0.68 | 2.58 | <1.00E-06 |
| LINDSTEDT_DEND_8H_VS_48H_UP | 58 | 0.73 | 2.58 | <1.00E-06 |
| LAL_KO_3MO_UP | 46 | 0.76 | 2.56 | <1.00E-06 |
| NADLER_OBESITY_UP | 57 | 0.72 | 2.56 | <1.00E-06 |
| GALINDO_ACT_UP | 75 | 0.70 | 2.54 | <1.00E-06 |
| SANA_TNFA_ENDOTHELIAL_UP | 61 | 0.71 | 2.52 | <1.00E-06 |
| CARIES_PULP_HIGH_UP | 68 | 0.70 | 2.50 | <1.00E-06 |
| NEMETH_TNF_UP | 82 | 0.66 | 2.43 | <1.00E-06 |
| JECHLINGER_EMT_UP | 56 | 0.67 | 2.32 | <1.00E-06 |
| HINATA_NFKB_UP | 89 | 0.60 | 2.29 | <1.00E-06 |
| TNFA_NFKB_DEP_UP | 17 | 0.85 | 2.29 | <1.00E-06 |
| NI2_MOUSE_UP | 40 | 0.70 | 2.26 | 7.14E-05 |
| ERM_KO_SERTOLI_DN | 17 | 0.83 | 2.25 | 6.67E-05 |
| BASSO_GERMINAL_CENTER_CD40_UP | 82 | 0.61 | 2.24 | 6.25E-05 |
| WIELAND_HEPATITIS_B_INDUCED | 71 | 0.62 | 2.22 | 5.88E-05 |
| EMT_UP | 55 | 0.63 | 2.21 | 5.56E-05 |
| PASSERINI_INFLAMMATION | 23 | 0.75 | 2.19 | 5.26E-05 |
| NAKAJIMA_MCSMBP_MAST | 37 | 0.68 | 2.17 | 5.00E-05 |
| TPA_SENS_MIDDLE_UP | 55 | 0.62 | 2.16 | 4.76E-05 |
| LIAN_MYELOID_DIFF_RECEPTORS | 33 | 0.69 | 2.14 | 1.40E-04 |
| BENNETT_SLE_UP | 19 | 0.77 | 2.13 | 2.24E-04 |
| TGFBETA_C2_UP | 17 | 0.79 | 2.12 | 2.14E-04 |
| TAKEDA_NUP8_HOXA9_3D_DN | 20 | 0.76 | 2.12 | 2.48E-04 |
| RADAEVA_IFNA_UP | 38 | 0.65 | 2.10 | 3.19E-04 |
| IL1_CORNEA_UP | 53 | 0.60 | 2.08 | 5.72E-04 |
| DAC_BLADDER_UP | 23 | 0.72 | 2.08 | 5.89E-04 |
| DAC_IFN_BLADDER_UP | 16 | 0.79 | 2.08 | 6.03E-04 |
| MARTINELLI_IFNS_DIFF | 16 | 0.77 | 2.07 | 6.89E-04 |
| TAVOR_CEBP_UP | 42 | 0.62 | 2.06 | 7.32E-04 |
| AS3_FIBRO_DN | 26 | 0.70 | 2.05 | 7.74E-04 |
| HEARTFAILURE_VENTRICLE_DN | 56 | 0.59 | 2.03 | 1.03E-03 |
| CANCER_UNDIFFERENTIATED_META_UP | 62 | 0.56 | 2.01 | 1.43E-03 |
| FLECHNER_KIDNEY_TRANSPLANT_ REJECTION_UP | 72 | 0.55 | 2.01 | 1.39E-03 |
| ADIP_DIFF_CLUSTER4 | 31 | 0.64 | 2.01 | 1.38E-03 |
| KNUDSEN_PMNS_UP | 65 | 0.56 | 2.00 | 1.39E-03 |
| AGED_MOUSE_CEREBELLUM_UP | 58 | 0.58 | 1.99 | 1.66E-03 |
| CMV_ALL_UP | 81 | 0.54 | 1.98 | 1.90E-03 |
| BLEO_HUMAN_LYMPH_HIGH_24HRS_UP | 86 | 0.52 | 1.98 | 2.06E-03 |
| MATRIX_METALLOPROTEINASES | 24 | 0.69 | 1.98 | 2.04E-03 |
| DORSEY_DOXYCYCLINE_UP | 23 | 0.68 | 1.96 | 2.53E-03 |
| PASSERINI_EM | 34 | 0.62 | 1.96 | 2.56E-03 |
| TSA_CD4_UP | 24 | 0.66 | 1.95 | 2.62E-03 |
| CROONQUIST_IL6_RAS_UP | 18 | 0.70 | 1.95 | 2.70E-03 |
| ZUCCHI_EPITHELIAL_DN | 36 | 0.60 | 1.94 | 3.52E-03 |
| CMV_8HRS_UP | 27 | 0.64 | 1.93 | 4.18E-03 |
| IFNALPHA_HCC_UP | 23 | 0.66 | 1.92 | 4.21E-03 |
| SANA_IFNG_ENDOTHELIAL_UP | 45 | 0.58 | 1.92 | 4.35E-03 |
| APPEL_IMATINIB_UP | 29 | 0.63 | 1.92 | 4.30E-03 |
| SHEPARD_POS_REG_OF_CELL_PROLIFERATION | 85 | 0.52 | 1.92 | 4.22E-03 |
| CROONQUIST_IL6_STROMA_UP | 34 | 0.60 | 1.92 | 4.34E-03 |
| SERUM_FIBROBLAST_CELLCYCLE | 88 | 0.50 | 1.91 | 4.61E-03 |
| DSRNA_UP | 32 | 0.61 | 1.91 | 4.91E-03 |
| MYC_TARGETS | 39 | 0.58 | 1.90 | 5.89E-03 |
| INSULIN_NIH3T3_UP | 15 | 0.72 | 1.89 | 6.12E-03 |
| CHAUHAN_2ME2 | 42 | 0.56 | 1.89 | 6.17E-03 |
| CAMPTOTHECIN_PROBCELL_DN | 21 | 0.66 | 1.89 | 6.08E-03 |
| LINDSTEDT_DEND_DN | 53 | 0.55 | 1.89 | 6.21E-03 |
| LEE_DENA_UP | 55 | 0.54 | 1.88 | 6.31E-03 |
| ROSS_MLL_FUSION | 60 | 0.53 | 1.88 | 6.51E-03 |
| CCR5PATHWAY | 18 | 0.68 | 1.88 | 6.64E-03 |
| PEART_HISTONE_DN | 63 | 0.52 | 1.88 | 6.61E-03 |
| IRITANI_ADPROX_DN | 45 | 0.55 | 1.87 | 7.03E-03 |
| ABBUD_LIF_UP | 45 | 0.56 | 1.87 | 7.16E-03 |
| MUNSHI_MM_UP | 57 | 0.53 | 1.87 | 7.10E-03 |
| ZHAN_MULTIPLE_MYELOMA_VS_NORMAL_DN | 33 | 0.61 | 1.87 | 7.10E-03 |
| NKTPATHWAY | 28 | 0.62 | 1.85 | 9.28E-03 |
Abbreviations: ES, enrichment score; NES, normalized enrichment score; FDR, false discovery rate.
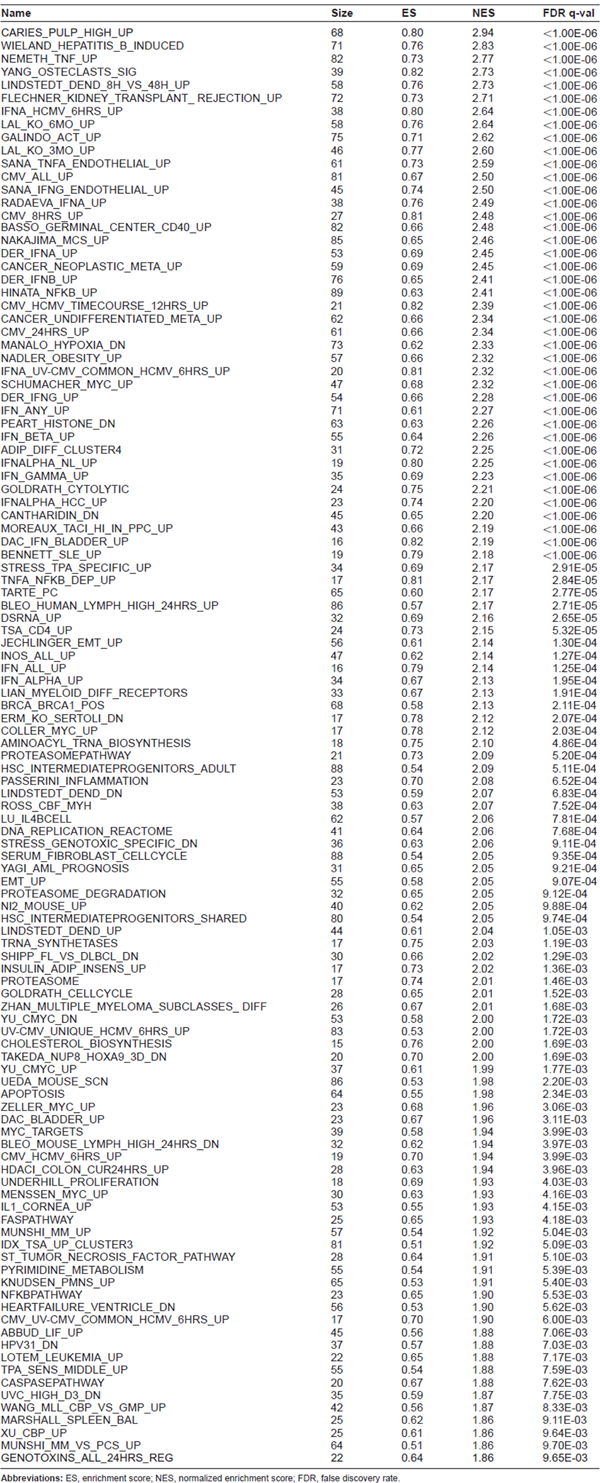
Significantly altered gene sets by C-DEP/OVA compared to OVA
| Name | Size | ES | NES | FDR q-val |
|---|---|---|---|---|
| CARIES_PULP_HIGH_UP | 68 | 0.80 | 2.94 | <1.00E-06 |
| WIELAND_HEPATITIS_B_INDUCED | 71 | 0.76 | 2.83 | <1.00E-06 |
| NEMETH_TNF_UP | 82 | 0.73 | 2.77 | <1.00E-06 |
| YANG_OSTECLASTS_SIG | 39 | 0.82 | 2.73 | <1.00E-06 |
| LINDSTEDT_DEND_8H_VS_48H_UP | 58 | 0.76 | 2.73 | <1.00E-06 |
| FLECHNER_KIDNEY_TRANSPLANT_REJECTION_UP | 72 | 0.73 | 2.71 | <1.00E-06 |
| IFNA_HCMV_6HRS_UP | 38 | 0.80 | 2.64 | <1.00E-06 |
| LAL_KO_6MO_UP | 58 | 0.76 | 2.64 | <1.00E-06 |
| GALINDO_ACT_UP | 75 | 0.71 | 2.62 | <1.00E-06 |
| LAL_KO_3MO_UP | 46 | 0.77 | 2.60 | <1.00E-06 |
| SANA_TNFA_ENDOTHELIAL_UP | 61 | 0.73 | 2.59 | <1.00E-06 |
| CMV_ALL_UP | 81 | 0.67 | 2.50 | <1.00E-06 |
| SANA_IFNG_ENDOTHELIAL_UP | 45 | 0.74 | 2.50 | <1.00E-06 |
| RADAEVA_IFNA_UP | 38 | 0.76 | 2.49 | <1.00E-06 |
| CMV_8HRS_UP | 27 | 0.81 | 2.48 | <1.00E-06 |
| BASSO_GERMINAL_CENTER_CD40_UP | 82 | 0.66 | 2.48 | <1.00E-06 |
| NAKAJIMA_MCS_UP | 85 | 0.65 | 2.46 | <1.00E-06 |
| DER_IFNA_UP | 53 | 0.69 | 2.45 | <1.00E-06 |
| CANCER_NEOPLASTIC_META_UP | 59 | 0.69 | 2.45 | <1.00E-06 |
| DER_IFNB_UP | 76 | 0.65 | 2.41 | <1.00E-06 |
| HINATA_NFKB_UP | 89 | 0.63 | 2.41 | <1.00E-06 |
| CMV_HCMV_TIMECOURSE_12HRS_UP | 21 | 0.82 | 2.39 | <1.00E-06 |
| CANCER_UNDIFFERENTIATED_META_UP | 62 | 0.66 | 2.34 | <1.00E-06 |
| CMV_24HRS_UP | 61 | 0.66 | 2.34 | <1.00E-06 |
| MANALO_HYPOXIA_DN | 73 | 0.62 | 2.33 | <1.00E-06 |
| NADLER_OBESITY_UP | 57 | 0.66 | 2.32 | <1.00E-06 |
| IFNA_UV-CMV_COMMON_HCMV_6HRS_UP | 20 | 0.81 | 2.32 | <1.00E-06 |
| SCHUMACHER_MYC_UP | 47 | 0.68 | 2.32 | <1.00E-06 |
| DER_IFNG_UP | 54 | 0.66 | 2.28 | <1.00E-06 |
| IFN_ANY_UP | 71 | 0.61 | 2.27 | <1.00E-06 |
| PEART_HISTONE_DN | 63 | 0.63 | 2.26 | <1.00E-06 |
| IFN_BETA_UP | 55 | 0.64 | 2.26 | <1.00E-06 |
| ADIP_DIFF_CLUSTER4 | 31 | 0.72 | 2.25 | <1.00E-06 |
| IFNALPHA_NL_UP | 19 | 0.80 | 2.25 | <1.00E-06 |
| IFN_GAMMA_UP | 35 | 0.69 | 2.23 | <1.00E-06 |
| GOLDRATH_CYTOLYTIC | 24 | 0.75 | 2.21 | <1.00E-06 |
| IFNALPHA_HCC_UP | 23 | 0.74 | 2.20 | <1.00E-06 |
| CANTHARIDIN_DN | 45 | 0.65 | 2.20 | <1.00E-06 |
| MOREAUX_TACI_HI_IN_PPC_UP | 43 | 0.66 | 2.19 | <1.00E-06 |
| DAC_IFN_BLADDER_UP | 16 | 0.82 | 2.19 | <1.00E-06 |
| BENNETT_SLE_UP | 19 | 0.79 | 2.18 | <1.00E-06 |
| STRESS_TPA_SPECIFIC_UP | 34 | 0.69 | 2.17 | 2.91E-05 |
| TNFA_NFKB_DEP_UP | 17 | 0.81 | 2.17 | 2.84E-05 |
| TARTE_PC | 65 | 0.60 | 2.17 | 2.77E-05 |
| BLEO_HUMAN_LYMPH_HIGH_24HRS_UP | 86 | 0.57 | 2.17 | 2.71E-05 |
| DSRNA_UP | 32 | 0.69 | 2.16 | 2.65E-05 |
| TSA_CD4_UP | 24 | 0.73 | 2.15 | 5.32E-05 |
| JECHLINGER_EMT_UP | 56 | 0.61 | 2.14 | 1.30E-04 |
| INOS_ALL_UP | 47 | 0.62 | 2.14 | 1.27E-04 |
| IFN_ALL_UP | 16 | 0.79 | 2.14 | 1.25E-04 |
| IFN_ALPHA_UP | 34 | 0.67 | 2.13 | 1.95E-04 |
| LIAN_MYELOID_DIFF_RECEPTORS | 33 | 0.67 | 2.13 | 1.91E-04 |
| BRCA_BRCA1_POS | 68 | 0.58 | 2.13 | 2.11E-04 |
| ERM_KO_SERTOLI_DN | 17 | 0.78 | 2.12 | 2.07E-04 |
| COLLER_MYC_UP | 17 | 0.78 | 2.12 | 2.03E-04 |
| AMINOACYL_TRNA_BIOSYNTHESIS | 18 | 0.75 | 2.10 | 4.86E-04 |
| PROTEASOMEPATHWAY | 21 | 0.73 | 2.09 | 5.20E-04 |
| HSC_INTERMEDIATEPROGENITORS_ADULT | 88 | 0.54 | 2.09 | 5.11E-04 |
| PASSERINI_INFLAMMATION | 23 | 0.70 | 2.08 | 6.52E-04 |
| LINDSTEDT_DEND_DN | 53 | 0.59 | 2.07 | 6.83E-04 |
| ROSS_CBF_MYH | 38 | 0.63 | 2.07 | 7.52E-04 |
| LU_IL4BCELL | 62 | 0.57 | 2.06 | 7.81E-04 |
| DNA_REPLICATION_REACTOME | 41 | 0.64 | 2.06 | 7.68E-04 |
| STRESS_GENOTOXIC_SPECIFIC_DN | 36 | 0.63 | 2.06 | 9.11E-04 |
| SERUM_FIBROBLAST_CELLCYCLE | 88 | 0.54 | 2.05 | 9.35E-04 |
| YAGI_AML_PROGNOSIS | 31 | 0.65 | 2.05 | 9.21E-04 |
| EMT_UP | 55 | 0.58 | 2.05 | 9.07E-04 |
| PROTEASOME_DEGRADATION | 32 | 0.65 | 2.05 | 9.12E-04 |
| NI2_MOUSE_UP | 40 | 0.62 | 2.05 | 9.88E-04 |
| HSC_INTERMEDIATEPROGENITORS_SHARED | 80 | 0.54 | 2.05 | 9.74E-04 |
| LINDSTEDT_DEND_UP | 44 | 0.61 | 2.04 | 1.05E-03 |
| TRNA_SYNTHETASES | 17 | 0.75 | 2.03 | 1.19E-03 |
| SHIPP_FL_VS_DLBCL_DN | 30 | 0.66 | 2.02 | 1.29E-03 |
| INSULIN_ADIP_INSENS_UP | 17 | 0.73 | 2.02 | 1.36E-03 |
| PROTEASOME | 17 | 0.74 | 2.01 | 1.46E-03 |
| GOLDRATH_CELLCYCLE | 28 | 0.65 | 2.01 | 1.52E-03 |
| ZHAN_MULTIPLE_MYELOMA_SUBCLASSES_DIFF | 26 | 0.67 | 2.01 | 1.68E-03 |
| YU_CMYC_DN | 53 | 0.58 | 2.00 | 1.72E-03 |
| UV-CMV_UNIQUE_HCMV_6HRS_UP | 83 | 0.53 | 2.00 | 1.72E-03 |
| CHOLESTEROL_BIOSYNTHESIS | 15 | 0.76 | 2.00 | 1.69E-03 |
| TAKEDA_NUP8_HOXA9_3D_DN | 20 | 0.70 | 2.00 | 1.69E-03 |
| YU_CMYC_UP | 37 | 0.61 | 1.99 | 1.77E-03 |
| UEDA_MOUSE_SCN | 86 | 0.53 | 1.98 | 2.20E-03 |
| APOPTOSIS | 64 | 0.55 | 1.98 | 2.34E-03 |
| ZELLER_MYC_UP | 23 | 0.68 | 1.96 | 3.06E-03 |
| DAC_BLADDER_UP | 23 | 0.67 | 1.96 | 3.11E-03 |
| MYC_TARGETS | 39 | 0.58 | 1.94 | 3.99E-03 |
| BLEO_MOUSE_LYMPH_HIGH_24HRS_DN | 32 | 0.62 | 1.94 | 3.97E-03 |
| CMV_HCMV_6HRS_UP | 19 | 0.70 | 1.94 | 3.99E-03 |
| HDACI_COLON_CUR24HRS_UP | 28 | 0.63 | 1.94 | 3.96E-03 |
| UNDERHILL_PROLIFERATION | 18 | 0.69 | 1.93 | 4.03E-03 |
| MENSSEN_MYC_UP | 30 | 0.63 | 1.93 | 4.16E-03 |
| IL1_CORNEA_UP | 53 | 0.55 | 1.93 | 4.15E-03 |
| FASPATHWAY | 25 | 0.65 | 1.93 | 4.18E-03 |
| MUNSHI_MM_UP | 57 | 0.54 | 1.92 | 5.04E-03 |
| IDX_TSA_UP_CLUSTER3 | 81 | 0.51 | 1.92 | 5.09E-03 |
| ST_TUMOR_NECROSIS_FACTOR_PATHWAY | 28 | 0.64 | 1.91 | 5.10E-03 |
| PYRIMIDINE_METABOLISM | 55 | 0.54 | 1.91 | 5.39E-03 |
| KNUDSEN_PMNS_UP | 65 | 0.53 | 1.91 | 5.40E-03 |
| NFKBPATHWAY | 23 | 0.65 | 1.90 | 5.53E-03 |
| HEARTFAILURE_VENTRICLE_DN | 56 | 0.53 | 1.90 | 5.62E-03 |
| CMV_UV-CMV_COMMON_HCMV_6HRS_UP | 17 | 0.70 | 1.90 | 6.00E-03 |
| ABBUD_LIF_UP | 45 | 0.56 | 1.88 | 7.06E-03 |
| HPV31_DN | 37 | 0.57 | 1.88 | 7.03E-03 |
| LOTEM_LEUKEMIA_UP | 22 | 0.65 | 1.88 | 7.17E-03 |
| TPA_SENS_MIDDLE_UP | 55 | 0.54 | 1.88 | 7.59E-03 |
| CASPASEPATHWAY | 20 | 0.67 | 1.88 | 7.62E-03 |
| UVC_HIGH_D3_DN | 35 | 0.59 | 1.87 | 7.75E-03 |
| WANG_MLL_CBP_VS_GMP_UP | 42 | 0.56 | 1.87 | 8.33E-03 |
| MARSHALL_SPLEEN_BAL | 25 | 0.62 | 1.86 | 9.11E-03 |
| XU_CBP_UP | 25 | 0.61 | 1.86 | 9.64E-03 |
| MUNSHI_MM_VS_PCS_UP | 64 | 0.51 | 1.86 | 9.70E-03 |
| GENOTOXINS_ALL_24HRS_REG | 22 | 0.64 | 1.86 | 9.65E-03 |
Abbreviations: ES, enrichment score; NES, normalized enrichment score; FDR, false discovery rate.
Acknowledgements
Dr. William Ward for review of the manuscript and helpful suggestions.