
Abstract
microRNAs represent a class of noncoding small RNAs of approximately 20–23 nt length, which are evolutionarily conserved and play a vital role in various biological processes by either degrading or repressing mRNA translation. The
Introduction
miRNAs, a class of conserved small noncoding regulatory RNAs, which do not translate into a protein and are involved in regulation of gene expression. They inhibit translation by binding to their target mRNAs at the 3′ untranslated regions (UTRs) followed by their degradation or inhibiting its expression. 1 Studies have shown that miRNAs are also involved in control of organ development, stem cell differentiation and developmental timing.2,3 Different reports reveals the role of miRNAs in diseases such as cancer and other infections. 4 Recent studies on miRNAs have begun to understand the influence of the microRNA network or an individual miRNA on cellular processes. 5
By March, 2009, 9539 hairpin sequence entries have been registered in miRBase.6–8 Sequence analysis have shown that some mature miRNAs are phylogenetically conserved, particularly in the first 7–8 residues at the 5′ end in species of the same kingdom. 6 Quite a few mature miRNA sequences are conserved between animals and plants. For example, mir-854, has been identified in C. elegans, mouse, human and plants. 9
There are two major approaches for miRNA discovery, which are computational identification and cDNA cloning. Since some miRNAs are expressed at a low level and the expression of many miRNAs has spatiotemporal specificity, it is difficult to find them through cDNA cloning. However, computational approaches can predict the miRNAs specifically expressed or with low abundance. The hairpin sequences of precursor miRNAs are phylogenetically diverse. In addition, the genomic locations of miRNA precursor genes and the folding structures of miRNAs have been used to identify previously unknown miRNAs. The three characteristics that allow miRNA genes to be identified using computational approaches are: i. miRNAs are generally derived from 70–100 nucleotide precursor transcripts having an extended stem-loop structure; ii. miRNAs are usually conserved between genomes of related species; and iii. miRNAs display a characteristic pattern of evolutionary divergence.10–20 Additionally genomic mapping of known miRNAs have enabled identification of orthologous miRNAs in other species where genomic annotations are lacking.21,22
Experimental evidence reveals that miRNAs play important roles in a variety of disease, such as cancer, diabetes, viral infection, cardiac disease, as well as in stem cell biology.14–20,23 Some miRNAs are present in the genome as clusters where multiple miRNAs are aligned in the same orientation and transcribed as polycistronic structure, which may function synchronously and cooperatively. Studies have provided evidence for miRNA regulation of many essential oncogenes including BCL2, RAS, MYC, p53.22,24–28
The sequence of the
Materials and Methods
To search for potential conserved miRNAs, the sequences of previously identified pre-miRNAs (miRNA genes) for all known animals were obtained from miRBase Sequence Database, release 13.0. 30 We have obtained sequences of all vertebrates from release 13.0 (March 2009). This downloaded set contained nearly 7383 miRNA sequences, which were both predicted and experimentally validated. We performed BLAST search with expect value 0.01, mismatch −2 using all previously reported vertebrate pre-miRNAs and query against the cat genome assembly (2.8X) Build 0.1 (release 01/14/2009). 31 All the hits were downloaded in FASTA format and used for further analysis. The hits were carefully examined and iterated to remove the duplicate hits of same miRNA gene based on similar genome coordinates and with maximum optimal values of identity, alignment length, bit score values and gaps between the query and hit sequences, whose values differ from one miRNA to another. Also, for the similar bit score value hits, minimal folding energy was considered. For those hits with identity <85% were screened with MiPred algorithm (Fig. 1). 32 Clusters were identified by comparing the newly reported miRNAs to the previously identified 33 miRNA clusters in miRBase. The sequence characteristics analysis was performed by identifying base frequencies of A, G, C, U, A + U, G + C of the hit sequences. Independently, statistical analysis of all vertebrate miRNA gene sequences were performed and compared with the iterated putative pre-miRNA sequences. Minimal folding energy (MFE) of the secondary structure was obtained using m-FOLD 34 for all the putative pre-miRNA genes. The adjusted minimal folding energy (AMFE) and the MEFI (minimal energy folding index), was calculated as previously described by Zhang. 35
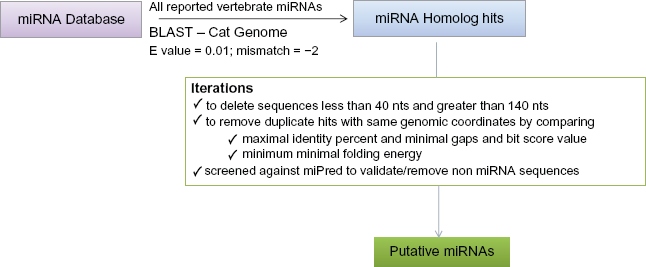
Schematic representation of the miRNA gene search procedure to identify homologs to reported miRNAs.
Results and Discussion
Pre-miRNA and mature miRNAs of cat
All the sequences from BLAST hits were stored and iterated as mentioned above. The resulting sequences are referred as putative pre-miRNA sequences. Thus, we identify 405 putative pre-miRNAs, of which 87 have 100% identity, 168 have identity between 95%–99.9%, 112 have identity between 90%–94.9% and 32 have between 85%–89.9% of identity (Fig. 2, Suppl. Table 1, 2). The hits with less than 85% identity were screened using miPred 32 to predict if any of these sequences could be considered as putative pre-miRNA sequence. We found that 6 sequences with less than 85% identity could be considered as real miRNAs (Fig. 2, Suppl. Table 1, 2).

Identity percent of pre-miRNAs and mature miRNAs. Identity percent of
Statistical analysis of pre-miRNA sequence of

The units for length is number of nucleotides.
Comparison of MFE, AMFE, MFEI of
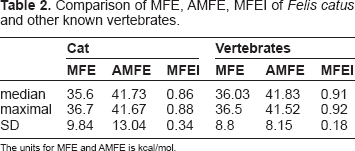
The units for MFE and AMFE is kcal/mol.
The mature miRNA sequences were compared for their identities with their query sequences and found that 357 miRNAs have 100% identity, 20 have between 95%–99.9%, 19 have between 90%–94.9%, 5 between 85%–89.9% and 4 with less than 85% identity (Fig. 2). The number of miRNAs that overlap based on their identity between pre- and mature miRNAs, were used to construct a matrix in an excel sheet (Suppl. Table 3). A bird view of the matrix showed that 87 (21.48%) miRNAs had both pre- and mature sequences with 100% identity (Fig. 3). We also find that 156 (38.51%) miRNAs have an identity of 100% with mature sequence and 95%−99.9% with pre-miRNA sequences (Fig. 3). Further, it was noted that among the 6 pre-miRNA sequences with identity of <85%, 3 (0.74%) were having 100% identity at the mature sequence. Overall, 357 mature miRNAs with 100% identity suggests high conservation of sequences at the mature miRNA level (Fig. 3).

Histogram showing number of pre-miRNAs as a subset of mature miRNAs based on their percent identity. X-axis denotes the different percent identities of mature miRNA, y-axis denotes the same for pre-miRNAs and z-axis shows the number of miRNAs.
Identity with other vertebrates
We wondered what could be the identity pattern of the putative cat miRNAs among all vertebrate species studied. In particular, our interest was more to those species from which the predicted putative miRNAs were deduced from BLAST hits with maximum identity percent. For this, we constructed a matrix for the number of pre-miRNAs over query species based on the identity percent (Suppl. Table 4). We found that 96 pre-miRNAs are identical to

Comparison of percent identity of pre-miRNAs of cat with other vertebrates.
Further, we were curious to know whether the identity pattern between cat and other vertebrates were also similar at mature miRNA level. In order to investigate this we examined mature miRNA identity across the vertebrates, by constructing a similar matrix as described for pre-miRNAs (Suppl. Table 5). Our results show that at 100% identity–-90 miRNA sequences were identical to cattle, followed by 53 in humans, 50 in dogs and 30 in mice (Fig. 4B). While the number of mature miRNAs do not show distinct pattern below 99.9% identity, this is due to more number of miRNAs shift towards 100% identity at mature sequence. Therefore, these results indicate that just like pre-miRNA, mature miRNA analyses also showed that cattle is closer to cat than other vertebrates.

Histogram showing number of mature miRNAs distribution with respect to mature miRNA identities across vertebrate species. X-axis shows mature miRNA identity (%), y-axis shows the vertebrate species studied and z-axis is the number of miRNAs.
Statistical sequence characteristics
Sequence characteristics of pre- and mature miRNAs are reported in plants and very recently in animals. It is important to perform a statistical analysis comparing with the rest of reported animal miRNAs, for understanding the distribution of random bases variables across the animal kingdom. Further, these statistical values could play an important role in understanding the miRNAs and deducing more computational methods for predicting more true positive hits. 36 We performed a detailed analysis of sequence characteristics of both the cat and all known vertebrate miRNA sequences (Table 1). Our study shows that the length of cat pre-miRNAs varies between 56 to 146 nucleotides (nt) on an average of 86.62 ± 14.4 nt, which is consistent with the other known vertebrates (Table 1). The mean base composition of pre-miRNA sequences in cat and other vertebrates are identical. The frequency of U in cat is higher and is 28.3% (Fig. 5A). Such higher frequency of U has also been reported for all other known vertebrate miRNAs. 36 Due to the high frequency of A + U, the base frequency of G + C is generally found to be much less in cat which is the case even in other vertebrates (Table 1). 37 It is well understood that A + U composition decreases the stability of the pre-miRNA secondary structure; it gets easily processed to mature miRNA by RNA induced silencing complex (RISC). 38 Further, we find that G/C and U/A ratio for vertebrates and cat are 1.16 ± 0.24, 1.22 ω 0.1 and 1.18 ± 0.36, 1.22 ± 0.03, respectively, which is again identical and vertebrate's base ratios are consistent with the previous study. 20 We further analyzed the frequency of nucleotides at each position in the mature miRNA of cat. We find that U is predominant at positions 1, 6, 9, 13, 17 and 21 (Fig. 4A). Generally, in plants, cytosine is the dominant nucleotide at position 19; however, this is not reported to any animal. 38 Instead this is the first report of guanine being dominant (31.8%) at the position 19, followed by Uracil (28.4%), Cytosine (19.51%) and Adenine (15.81%) in cat. Further, we also find that G + C frequency is higher than A + U at position 19 and 11; and interestingly at position 15 it is equal, which is unique. Earlier studies have shown that uracil nucleotide is the predominant at 5′ end of the mature miRNA. Based on this it has been proposed that the 5′ end may play an important role in biogenesis of mature miRNA through recognition of the targeted miRNA precursors by RISC. 38 Consistent to this, our studies have also shown that uracil is present predominantly at 5′ end of the cat miRNAs (Fig. 5B), adding an additional support to the existing studies.
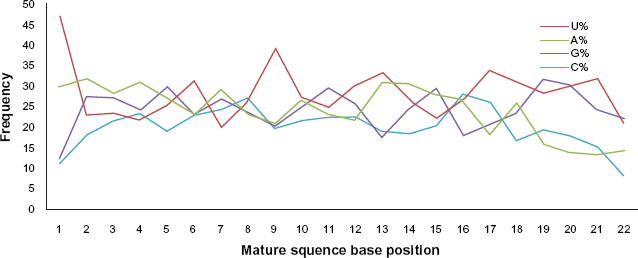
Graph showing base frequency across the length of the mature miRNA sequences. A, U, G, C frequency (%) was plotted against the length of mature miRNA sequences.
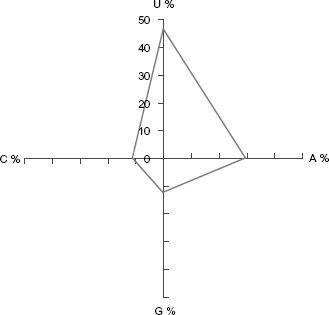
End base frequency in miRNA of cats.
Previously it has been demonstrated that compared to other noncoding RNAs, pre-miRNAs have lower MFE. 38 Therefore, MFE was considered as one of the important factors to identify miRNA genes. 32 We find that the average MFE values for cat pre-miRNAs is 35.6 ± 9.8 kcal/mol. Adjusted minimal folding energy (AMFE) and MFEI was calculated to normalize the MFE values for the sequence length (Table 2). Altogether, these statistical features could play a significant role in further understanding the secondary formation of the pre-miRNAs.
microRNA family and cluster
miRNAs are usually grouped into gene families. A typical miRNA family contains several mature miRNAs with identical sequences and could be present anywhere in the genome of an organism.
39
In most of the cases, at least one member of the family has been experimentally identified, while others are identified based on
It is well known that miRNA genes often form clusters within the genome.
13
Clusters are defined as miRNA genes present in the same orientation of gene and are transcribed as one polycistronic transcriptional unit. At a threshold sequence length 500–1000 bp, we identify 32 clusters from cats (Suppl. Table 8). In an earlier study
29
it has been reported that mir-let-7a-1 and mir-125a were missing from cat miRNA clusters 24 and 6, respectively. However, we found that both mir-let-7a-1 and mir-125a are in fact present in the respective clusters (Suppl. Table 8). The total miRNA identified in that study was only about 179, in contrast to 405 in our study, which could be due to incomplete sequencing of
Conclusion
Many
Footnotes
Acknowledgement
We thank the Cat Genome Sequencing Group for their efforts and making data available for the public.
Disclosure
This manuscript has been read and approved by all authors. This paper is unique and is not under consideration by any other publication and has not been published elsewhere. The authors and peer reviewers of this paper report no conflicts of interest. The authors confirm that they have permission to reproduce any copyrighted material.
Supplementary Table Legends
Suppl Table 1. Table showing the number of pre- and mature miRNAs in cat.
Suppl Table 2. Detailed list of predicted miRNAs from cat.
Suppl Table 3. Matrix showing distribution of total miRNAs between pre-miRNA and mature identity percent.
Suppl Table 4. Matrix showing distribution of total miRNAs between pre-miRNA identity and vertebrates.
Suppl Table 5. Matrix showing distribution of total miRNAs between mature identity and vertebrates.
Suppl Table 6. List of family of miRNAs.
Suppl Table 7. Matrix showing distribution of total miRNAs between family miRNAs and vertebrates.
Suppl Table 8. Detailed list of predicted clustered miRNAs.