
Abstract
In this study, the BALB/c and Qs mouse responses to infection by the parasite Neospora caninum were investigated in order to identify host response mechanisms. Investigation was done using gene set (enrichment) analyses of microarray data. GSEA, MANOVA, Romer, subGSE and SAM-GS were used to study the contrasts Neospora strain type, Mouse type (BALB/c and Qs) and time post infection (6 hours post infection and 10 days post infection). The analyses show that the major signal in the core mouse response to infection is from time post infection and can be defined by gene ontology terms Protein Kinase Activity, Cell Proliferation and Transcription Initiation. Several terms linked to signaling, morphogenesis, response and fat metabolism were also identified. At 10 days post infection, genes associated with fatty acid metabolism were identified as up regulated in expression. The value of gene set (enrichment) analyses in the analysis of microarray data is discussed.
Introduction
Microarray technology has been used extensively for the study of host responses to infection by a variety of Apicomplexa. Such studies have used well established methods for mining of data to extract the identity of genes, pathways and other host mechanisms differentially expressed within the data sets under study.1–4 The involvement of changes in expression of genes associated with specific pathways is typically investigated by the application of enrichment tests applied to gene ontology terms, thereby providing evidence for enrichment of pathways by association with these terms. 5 Pathway and network analyses potentially offer a number of advantages for analyzing microarray datasets, notwithstanding the identification of specific pathways, and hence networks of genes that are affected by the experimental treatment under study.6,7
More recently, a variety of methods for gene set (enrichment) analysis have evolved, providing an alternative way of mining the transcriptional changes present in microarray data.8–12 Gene set analysis essentially asks whether the expression of a list of genes in a microarray data set is positively or negatively associated with one of the two experimental groups (eg, infected and uninfected mice). Gene sets represent lists of genes that are typically associated with a chromosomal location, biochemical pathway, or other computationally derived biological processes or experimentally studied systems such as cancer. Most published studies use gene sets downloadable from the Molecular Signatures (MSigDB) database (http://www.broadinstitute.org/gsea/msigdb/index.jsp), but personalized gene sets can also be created through tools such as WhichGenes. 13
Various mice types support N. caninum infection. These include the BALB/c and Qs that have been described previously.14,15 The BALB/c mouse is susceptible to infection by N. caninum, whereas the Qs is considerably more resistant to infection by both highly pathogenic and less pathogenic strains such as NC-Liverpool and NC-Nowra respectively. The outcome of infection of BALB/c and Qs mice with N. caninum therefore differs. BALB/c mice typically become lethargic and their fur becomes ruffled, after which they may lose weight and may die, 14 whereas the Qs mouse shows none of these signs of infection. 15
In this study, gene set analysis was used to mine microarray data derived from a previous study that investigated changes in transcription in mice in response to N. caninum infection. 3 In that study both BALB/c and Qs mice were used and their response to infection by NC-Liverpool and NC-Nowra investigated. This dataset was previously analyzed by significance analysis of microarrays, clustering, and gene ontology enrichment and these analyses have shown, notwithstanding, the complexity of the mouse response to infection. Here it is shown that gene set analyses provides a simple, yet effective, method by which to mine microarray data. For the record, elements of the core mouse response to infection by N. caninum are identified and discussed.
Methods
Data
Microarray data was derived from the Gene Expression Omnibus (https://www.ncbi.nlm.nih.gov/geo/) series record GSE23520. The data set is derived from a two color study containing two different mice types (BALB/c and Qs) and two different N. caninum (NC-Nowra and NC-Liverpool) isolates, studied at 6 hours post infection (HPI) and 10 days post infection (DPI). The experimental design, which included at least three mice per experimental group, is described elsewhere. 3 Essentially mice were infected with N. caninum and RNA prepared from spleen removed at 6 HPI or 10 DPI. mRNA was converted into cDNA, which was hybridized to microarrays containing the NIA15K gene set, using RNA from uninfected BALB/c or Qs mice as a control. The Kooperberg model-based background correction was applied to the raw microarray data, after which the expression log ratios were normalized within the slide (using print-tip loess). Array data were then RMA normalized within treatments prior to linear model fitting.
As gene set analysis requires gene annotation information, all data for genes in the array data set that did not contain annotation were removed, as were data for multiple probes representing the same gene. Annotation information was obtained from ID converter. 16
Gene sets (GMT format) were obtained from the MSigDB for all categories (human, C1–C5). Gene identifiers used in the array dataset and gene sets were gene symbols. Mouse gene sets were also obtained from WhichGenes in the GMT format and the WEHI website (http://bioinf.wehi.edu.au/software/MSigDB/index.html). The WEHI gene sets are derived from the MSigDB by conversion of human gene symbols to mouse orthologs, with reference to the Jackson Laboratory Human and Mouse Orthology Report. In these analyses, the mouse gene sets analyzed were restricted to those sets containing between 10 and 500 genes as recommended. 17 A gene set compiled for tissues from the Stanford Microarray Database was also used (http://www.stat.stanford.edu/~tibs/GSA/).
Gene set analysis
All comparisons made involved investigating those gene sets that are associated with either (1) Mouse: meaning mouse type (BALB/c vs. Qs); (2) Type: meaning N. caninum strain (NC-Nowra vs. NC-Liverpool), or (3) Time: meaning time post infection (6 HPI vs. 10 DPI). Data from the GEO series record GSE23520 was pooled for the different groups (Table 1) so that such comparisons could be made across the species N. caninum. For example, in order to compare the response to Qs and BALB/c mice, data from all Qs groups (infected with either N. caninum type and the two different time points) were considered as “Qs”. Similarly all groups from the BALB/c set of infections (infected with either N. caninum type and the two different time points) were considered as “BALB/c”.
Experimental codes explaining how the data was analysed. a

Analysis of 1v2 = comparison of NC-Nowra v NC-Liverpool (Neospora type); 3v4 = comparison of Qs v BALB/c mice (Mouse type); 5v6 = comparison of 6 HPI v 10 DPI (time);
6 HPI or 10 DPI.
Initially gene set enrichment analysis (GSEA)10,12 was performed using the JAVA desktop application 18 with the human C1–C5 gene set collections (from the MSigDB), with 1000 permutations of the gene set.
Parametric (PAGE) analyses were performed using the webserver GAzer. 19 1263 gene sets using the gene ontology (GO biological process and molecular function categories) pathway and chromosome categories included on the server were investigated. Analyses were done with the fold change option, specifying a minimum of five genes/significant gene set to be reported. More specific parametric gene set analyses (PGSEA from Bioconductor) of mouse gene sets were performed in R using gene sets obtained from WhichGenes, reporting only gene sets returning a P < 0.05.
Four additional methods of gene set enrichment analysis were used to analyze the microarray data. The first method used to analyze the data was SAM-GS which was introduced as an extension of the significance analysis of microarray approach to accommodate gene sets. 20 In SAM-GS the sum of the squares of the test statistics from a t-test (or similar) for individual genes is used to calculate a gene set test statistic. A sample permutation is then used to obtain P values for each gene set. To do this, the R implementation of SAM-GS was used. It is available at http://www.ualberta.ca/~yyasui/homepage.html.
The second method used was multivariate analysis of variance. 21 In the case where there are two genotype groups, a Hotelling's T2 test is used to determine whether there are any differences in gene expression between the two groups. A number of non-equivalent tests are available if more than two genotype groups are to be compared. Shrinkage covariance matrix estimators are used to overcome the problem of having fewer samples of each phenotype than there are genes in a gene set. An R implementation of MANOVA was used that can be found at http://mail.cmu.edu.tw/~catsai/research.htm.
The third method that was used to analyze the microarray data was subGSE. 22 In this method the genes within each gene set are ranked based on their association with the phenotype group and “strict subsets” of the top i genes are permuted to obtain raw P values, the smallest of which is used to test gene set significance. The advice of the authors of this paper was adopted in that a minimum strict subset size of C = 5 genes was used to ensure that the tests are not too sensitive to single genes with strong association. The C++ implementation of this algorithm was used, which can be found at http://www.rcf.usc.edu/~fsun/Programs/SubGSEWebPages/SubGSEMain.html.
The final method that used was Romer, the rotation mean rank version of GSEA for linear models. This method uses a rotation based simulation to obtain P values. This simulation method was introduced in 23 and is discussed in terms of gene analysis elsewhere. 24 Ten thousand rotations of the mouse gene sets (categories C1–C5 limited to 10 to 500 genes/gene set) were used, which appeared to give reasonably stable gene set rankings between simulations. The limma package in R was used to perform this analysis.
Once the P values for each test were obtained, the Q value package in R was used to obtain the estimated false discovery rates for each gene set within each test. The method in the Q value package is based on the theory of Q values.25,26
In all the analyses described here, gene sets returning a Q value of <0.25 were initially recorded and lists of gene sets were sorted according to their Q and P values. In order to reduce the lists down from thousands of gene sets to a more manageable number, gene sets ranked by P values (Manova, SAM-GS, Romer, subGSE) were selected representing the top 10% quantile of the cumulative frequency distribution. Gene lists representing those genes in the gene set were used in the Gene_Search excel macro to extract expression data from the original microarray expression matrix. Gene_Search is a second generation version of the Find_Gene macro described elsewhere. 3 The gene lists were then filtered by value so as to identify those genes that met certain criteria based on M values. For example, genes were extracted where M > 0.1 and M < –0.1 for all four groups in the array data representing 6 HPI or 10 DPI or all eight groups from 6 HPI and 10 DPI together. Venn diagrams were constructed using Venny (http://bioinfogp.cnb.csic.es/tools/venny/index.html).
Network analyses
Results obtained from gene set analyses using subGSE (ranked by P value) were displayed by enrichment mapping in cytoscape. 17 Descriptors for node clusters were generated using the WordCloud plugin.
Results
Gsea
The expression dataset (GSE23520) has data for 15151 gene probes that after collapsing into gene symbols gave data for 10384 genes. A summary of the number of gene sets that were significantly associated with the three analyses conducted is shown in Table 2. The contrast Time gave a rich number of gene sets for study (258, 111 with Q < 0.1), followed by Mouse, showing the strongest informative signal occurring in the dataset at 6 HPI. The main pathways identified were Glycolysis and Gluconeogenesis, Oxidative Phosphorylation and Proteasome Pathway (Table 3). The highest ranked (by NES) gene set (ICHIBA_GVHD; not shown) contained 102 genes including Irf1, H2-D1, pbef, S100A9, Nfkbia, H2-DMA, C1qb, Ly6a, Irf8, Tgtp and Gp49a. C5 gene sets gave results associated with a range of pathways such as Regulation of IκB kinase NF-κB Cascade (Ltbr, Myd88, Litaf, Bcl10, Ikbke), Structural Constituent of Ribosome (39 ribosomal proteins), Immune System Process (Ifitm3, Cd34, Il18, Irf8, Bcl10, Il2rg, Il6st, Cd164, Csf1, Cxcr4, Cd26), Inflammatory Response (S100A9, Nfkb1, Cxcl1, Cxcr4, Tnfaip6), and 21 genes of the Mitochondrial Envelope.
Summary of GSEA results for Q < 0.25.
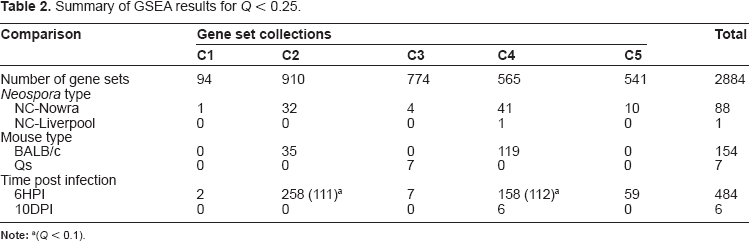
(Q < 0.1).
Summary of GSEA results.
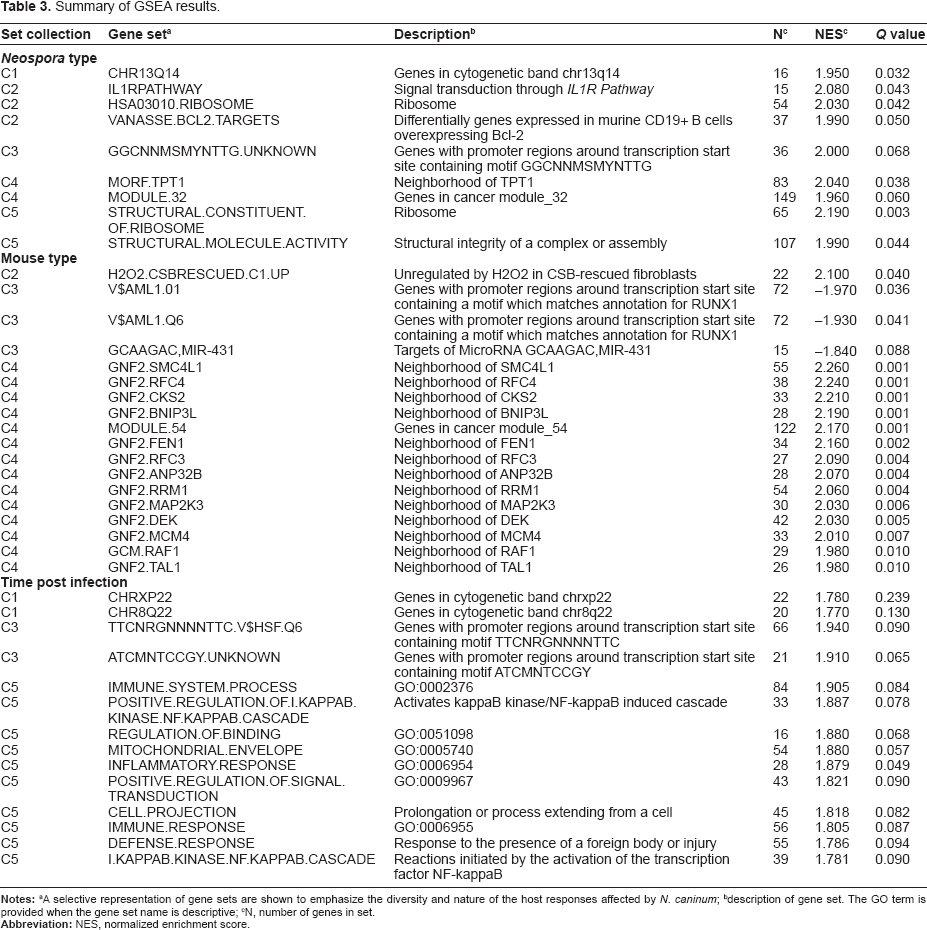
A selective representation of gene sets are shown to emphasize the diversity and nature of the host responses affected by N. caninum;
description of gene set. The GO term is provided when the gene set name is descriptive;
N, number of genes in set.
A comparison of the C1 sets associated with Type (Neospora) identified a single gene set (CHR13Q14, Q = 0.0044) that was negatively associated with NC-Nowra and positively correlated with NC-Liverpool. The leading edge genes in CHR13Q14 were Lcp1, Tpt1, Wbp4, Kpna3, Gtf2f2, and Itm2b. Il1R pathway gave the highest NES with C2 gene sets and contained genes Map3k7, Ikbkb, Tgfb2, Mapk14, Mapk8, Map2k3, Nfkb1, Chuk and Nkkbia as contributing to the core enrichment. MORF_TPT1 had the highest NES of the C4 sets and contained a large number of genes associated with translation including ribosomal proteins Rps5, Rp15, Rp17, Rp131, Rp115a, Rp110, Rp124, Rp127, Rp115, Rps25, Rp112, Rp122, Rp138, Rp111, Rps3a, Rps7, Rps27, Rps4x, Rp132, Rps14, Rp118a, Rp119, Rps10, Rp110a, Rp130, Rp127a and elongation factors Eif4a2, Eif4 g2, Eef1b2, Eef1 g. Gene sets Structural Constituent of Ribosome and Structural Molecule Activity of C5 also gave Q < 0.1 and also contained ribosomal proteins.
Investigations of Mouse identified gene sets primarily in the C2 and C4 categories. In C4 many of the gene sets contained genes associated with the cell cycle, such as cyclins A2, H, B2 and F plus other associated regulatory molecules such as Cdc6, Cdc28, Cdnk2c, Cks1b, Cks2, and Tgfbr3.
Parametric gene set analysis (PAGE)
From the three analyses conducted using GAzer, 166 gene sets were associated with one or more of the contrasts, 66 were associated with Time and Mouse, and 34 were associated with Type. Those gene sets with a Q < 0.1 are listed in Table 4. Seven of the sets featured in two or more of the PAGE analyses outcomes: Hemoglobin complex, Heme Biosynthesis_GenMAPP, Glutathione metabolism_KEGG, Proteasome_KEGG, Proteasome Core Complex (sensu Eukaryota), Immune Response and Mitochondrial fatty acid betaoxidation_GenMAPP.
GAzer results for Q < 0.1.
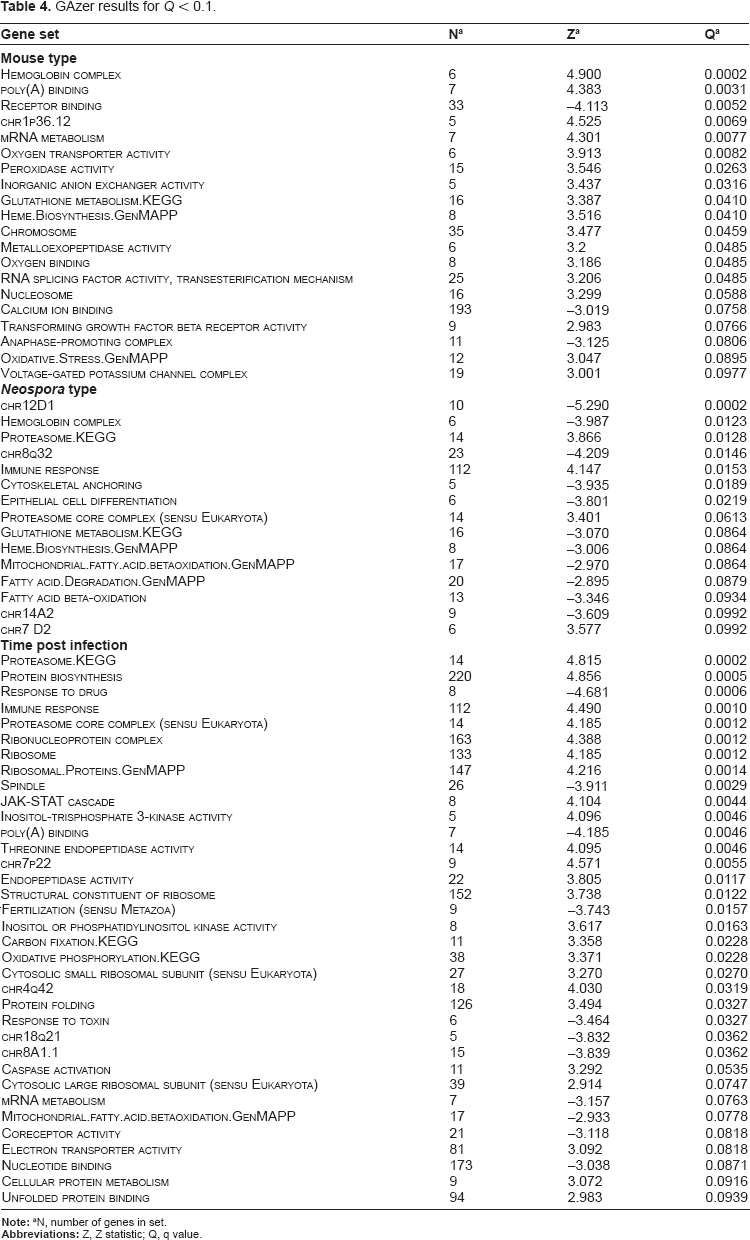
N, number of genes in set.
Both these initial studies using GSEA and PAGE had indicated that Time was rich in correlation with gene sets, indicating that the expression profiles obtained at 6 HPI and 10 DPI are quite different. Further analyses to confirm this observation was performed using PGSEA (in R) with a cut-off P value of 0.05. Using the Tissues gene set, 34 of them were significantly associated with Time. Gene expression data for genes present in these 34 gene sets were extracted; 20 genes were up-regulated in most (7/8 or 8/8) experimental groups studied. Two of the genes (Bst2, Mc11) are associated with the GO term Regulation of Apoptosis while three were associated with Cell Cycle (Atm, Lats2, Wee1). Eighty six genes were primarily up-regulated at 6 HP1 while 132 showed raised expression at 10 DPI (not shown). These gene lists were further investigated by GO enrichment. At 6 HPI the gene list was linked to terms such as Natural Killer Cell Mediated Cytotoxicity, Glycolysis and Cell Redox Homeostasis amongst others. At 10 DPI the gene list was linked to GO terms associated with a range of Cell Division activities, as well as terms such as Protein Amino Acid Phosphorylation, Cell Respiration and Signaling Pathways.
SAM-GS and MANOVA
No gene sets were identified by SAM-GS that correlated with either of the contrasts Mouse or Type, with all gene sets giving Q > 0.25. In contrast, all gene sets studied (8965) were significantly associated with Time (post infection), with all Q values less than 0.06 with most being < 0.003. Similarly with MANOVA, no gene sets were identified that correlated with either of the contrasts Mouse or Type, with all gene sets giving Q > 0.32. 6378 gene sets were significantly associated with Time, with all Q values < 0.034.
Identification of core host response
Experience with SAM-GS and MANOVA produced very long lists of gene sets that were significantly correlated with Time. In order to identify those gene sets that were highly correlated with Time, gene set analyses was repeated using Romer and subGSE and gene sets in the 10% quantile of each list were extracted and the lists compared. Thirty seven gene sets were common to the lists generated by MANOVA, SAM-GS, Romer and subGSE (Table 5). Visual inspection of the gene lists associated with each gene set showed that some gene sets shared genes for which data was responsible for the enrichment observed. For example, Response to UV and Response to Light Stimulus shared similar lists of genes when the microarray data was considered. Similarly, Cytoplasmic Vesicle Part and Cytoplasmic Vesicle Membrane also shared gene lists. Consequently the presence of unique genes in the 37 gene sets was investigated. Extraction of the gene data was performed using the excel macro Gene_Search and 1951 unique genes were identified in these 37 gene sets. The gene data was further filtered according to value using criteria specific for either 6 HPI, 10 DPI or both (using M > 0.1 or < –0.1; Table 6). Figure 1 shows a Venn diagram that summarizes the number of genes meeting these criteria. The 10 DPI had higher numbers of genes showing altered expression compared to the 6 HPI time point. The identity of the genes affected was also different.
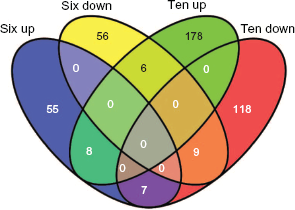
Venn diagram summarizing the number of genes changing in expression at the two different time points (from Table 6).
Thirty seven common gene sets found in the top 10% quantile of lists derived by MANOVA, SAM-GS, Romer and subGSE.
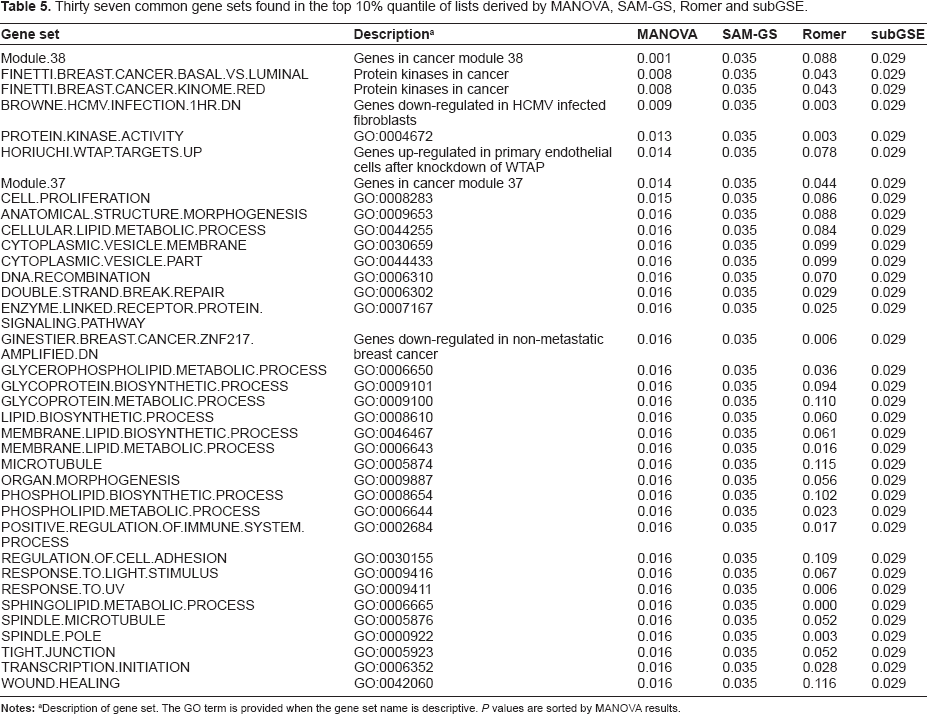
Description of gene set. The GO term is provided when the gene set name is descriptive. P values are sorted by MANOVA results.
Number of unique genes defined in the core mouse response to N. caninum from the gene sets of Table 5.

Defined as a change in M value as <0.1 or > –0.1.
A small number of genes were identified whose expression involved a greater than two fold change in expression in these 37 gene sets (Table 7). Four genes were up-regulated at 6 HPI and four at 10 DPI. None were identified in any other possible group. Aak1, which functions in clathrin mediated endocytosis, showed the highest fold change (81 fold at 10 DPI) in BALB/c mice infected with NC-Liverpool. Expression of Acadvl, associated with mitochondrial long chain fatty acid beta-oxidation in the mouse, was raised in mice at 10 DPI infected with NC-Liverpool. The significance of fatty acid metabolism at 10 DPI is discussed below.
List of genes with a twofold (or greater) change in expression identified from the 37 gene sets of Table 5.

Discussion
Gene set enrichment is a method that investigates whether predefined sets of genes are differentially expressed between two sets of conditions (eg, infected vs. uninfected)8,10,12,20 present in microarray data. The most commonly used method is gene set enrichment analysis (GSEA). However, debate and the recognition of shortcomings in gene set analyses7,20 has led to the emergence and validation of other approaches such as SAM-GS and MANOVA for gene set analysis.27–29
The microarray data sets used in this study were derived from a series of experiments that involved infection of Qs and BALB/c mice with N. caninum (NC-Nowra or NC-Liverpool strains). Two different time points (6 HPI and 10 DPI) were studied, providing an insight into the host responses occurring early during infection. 3 Qs mice are relatively resistant to infection by N. caninum, 15 whereas responses in BALB/c are strain specific. NC-Liverpool, for example, is very pathogenic in the BALB/c mouse leading to weight loss, appearance of clinical signs such as head tilting and limb paralysis, and death. 14 The comparison of these groups (Type: Nc-Nowra v NC-Liverpool, Mouse: Qs v BALB/c and Time: time post infection) should provide further understanding of an animal's responses to infection by N. caninum and the mechanisms associated with disease and resistance.
Using the same data set, it was previously demonstrated that the transcriptional responses occurring in the spleen of mice was dependent on a number of factors including the strain of N. caninum used, as well as the mouse type and time post infection. 3 The methods of differential gene analyses used included significance of microarrays, ANOVA and clustering methods.30,31 Alternatively, Bayes statistics using the functions lmFit, eBayes and topTable found in limma 32 were used in association with gene enrichment methodologies that measured functional enrichment (of gene ontology terms). These approaches identify lists of genes that are assigned to biological processes and functions via the gene ontology language. In contrast the gene set approaches described here represent an alternative approach for mining microarray data. It is argued that informative signals, derived from multiple genes associated with a pathway for example, may be more easily identified than those associated with single genes alone. Such approaches may be beneficial in analyzing data sets where an association with a treatment or phenotype has yet to be identified. Consequently the mouse response to infection by N. caninum was examined here, in anticipation that gene set analyses would provide further insight into identifying host responses that are associated with neosporosis.
GSEA and PAGE were initially used to mine the expression data. The main reason behind this choice was that easily used web servers are available that can be used to rapidly analyze data by gene set analyses. Despite the limitations of these approaches, including use of human gene symbols in the gene sets, they identified that the largest number of gene sets were correlated with Time (post infection) rather than Mouse or Type. Subsequently, gene set analyses were conducted by SAM-GS, MANOVA, Romer and subGSE. The number of gene sets detected that correlated with the microarray expression data was very much dependent on the method used for gene set (enrichment) analyses, as well as the definition of the minimum number of genes to be included. SAM-GS, for example, found no correlations with Mouse or Type. Using expression data merged from both Qs and BALB/c mice types infected with either NC-Liverpool or NC-Nowra, the analyses showed that the host response is quite different at these two time points. Similar observations were made with all methods of analysis. For example, GSEA identified a range of gene sets with an immunological basis such as inflammatory responses and NF-κB signaling. The two time points chosen (6 HPI and 10 DPI) were based on the previous observations of others concerning the mechanisms of innate and adaptive immunity to N. caninum in the mouse. For example, γ-interferon is known to be one response molecule produced at these time points. 33 PAGE identified the Jak-Stat cascade as one of the significant gene sets. Overall, these results indicated the timing of the host response (Time) needed to be further investigated for its importance in determining infection outcomes in terms of disease.
GSEA and PAGE both identified significant differences in the expression data derived from mice infected with NC-Nowra or NC-Liverpool (that is they were correlated with strain of N. caninum) suggesting that the mouse response to infection by these two strains is different. The two methods identified very different gene sets that differed between the groups. GSEA identified differences in molecules affecting translation (eg, ribosomal proteins) along with MAP kinase activity whereas PAGE suggested fatty acid metabolism differs along with proteasomal activity (plus others). SAM-GS and MANOVA found no associations in this category. The idea that fatty acid metabolism is influenced by the Neospora strain represents just one example where gene set analyses has provided new hypotheses to explore. The BALB/c and Qs mice differed, according to GSEA, by the expression of genes associated with the cell cycle. GAzer identified haemoglobin/heme-metabolism/oxygen-related gene sets as being significantly different between these mice types. Peroxidase and glutathione metabolism are also in the list produced by PAGE, identifying that redox metabolism differs between mouse types.
Overall the results obtained by GSEA and PAGE were similar with those obtained previously by analyses of individual gene data by SAM, clustering and ANOVA, followed by enrichment analyses of gene lists based on GO. 3 The advantages of gene set analysis are, however, evident—unlike analyses of individual genes, it is advantageous to identify several genes of a pathway (gene set) that is altered by the experimental treatment, thereby flagging those pathways for future study. There are also, however, several drawbacks associated with gene set analysis. In the first instance, the presence of a differentially expressed gene in more than one gene set means that several of the associations found can occur simply because of the impact of gene membership on a gene set. An example can be found here in those gene sets that contain ribosomal proteins, which occurred in more than one gene set. The algorithms themselves have also come up for criticism. GSEA was shown to be subject to false positive and negative findings, 20 and PAGE ignores gene-specific variances. 8
Methods for gene set (enrichment) analyses are typically grouped as two types, competitive or self-contained, with the later gaining widespread popularity based on logical criteria.7,34 SAM-GS, MANOVA and subGSE are examples of self-contained methods for finding gene sets associated with two groups under study. The approach adopted here for identifying the mouse core responses was to select the top ranking gene sets identified by each of these analyses (including Romer) and to simply determine those present in the top 10% quantile of each. In this manner 37 gene sets containing 1521 unique genes were identified as featuring in the mouse response to N. caninum.
Host responses to N. caninum are known to be of the Th1-type and the present dogma is that resistance to infection is mediated via IFN-γ35,36 Similar to those anti-parasitic mechanisms observed in T. gondii, 37 host responses to N. caninum are shown in this and the accompanying studies 3 to be extremely diverse in their nature. Of note is the statistical significance supporting claims for involvement of pathways associated with MyD88 and NF-κB, as well as Jak-Stat signaling in the mouse response, for which experimental evidence is now present.38,39 With T. gondii, mouse responses are also based on toll-receptor MyD88, NF-κB, and MAP kinase signaling, resulting in defined inflammatory responses. 40 It is reassuring that gene set analyses has identified similar pathways, thereby providing a high degree of confidence in the results presented here and the claims behind the association of other pathways and mechanisms in the mouse response to N. caninum.
Finally, it is now possible to provide a more detailed, albeit general, summary of the core responses of the mouse in response to infection by N. caninum. The influence of γ-interferon on gene expression is extensively described and linked to a vast number of responses including those of dendritic and other antigen-presenting cells, natural killer cells, macrophages and T helper and Treg cells, to name just a few. 41 Systems biology approaches have led to the curation of the widespread influence of γ-interferon on gene expression; 31 of the top 50 network hubs (genes) of the γ-interferon network 42 were present in the dataset studied here. The fold changes in expression associated with them were relatively small (generally in the 1.1–3 range, eg, Nfkbia and Irf8 were increased across all the groups studied). Five of the hub genes (Irf1, Irf3, Ctnnb1, Raf1, Map3k7) were reduced in expression at 10 DPI by up to 50% of the level shown by uninfected mice (not shown). Text mining using SciMinder identifies 1562 genes linked to a search through the keyword “gamma interferon”; 355 were present on the arrays used here. Only five (Stat1, Irf1, Ccnd2, Lap3, Nod1) showed a greater than twofold increase in expression at either of the two time points studied and all were at 6 HPI.
Table 5 summarizes the identity of 37 gene sets associated with Time, identified by MANOVA, SAM-GS, Romer and subGSE, which define the core mouse response to infection by N. caninum. From a GO perspective there are a number of significant terms in this list, such as Protein Kinase Activity, Cell Proliferation and Transcription Initiation, which reflect core activities differing between the two time points post infection. The word clouds in Figure 2 attempt to summarize the simple terms associated with the core responses identified by just one of the methods used for gene set analyses (subGSE). Although the different methods of gene set enrichment are likely to generate slightly different word clouds as a result of the different results obtained from the enrichment analyses, subGSE was selected for illustration purposes only. Using KEGG based gene sets, two major nodes are observed in the enrichment map composed of transcription and regulation of metabolic process. Gene ontology gene sets provide word clouds focused on nodes related to regulation and protein. In the latter, regulation is linked to a variety of nodes describing functions such as Apoptosis, Programmed Cell Death, Signaling, Transduction, Kinase, Cascade and ikappaB. The protein node is connected to a wide number of other nodes describing protein functions such as Transport, Localization, Modification and Metabolic.
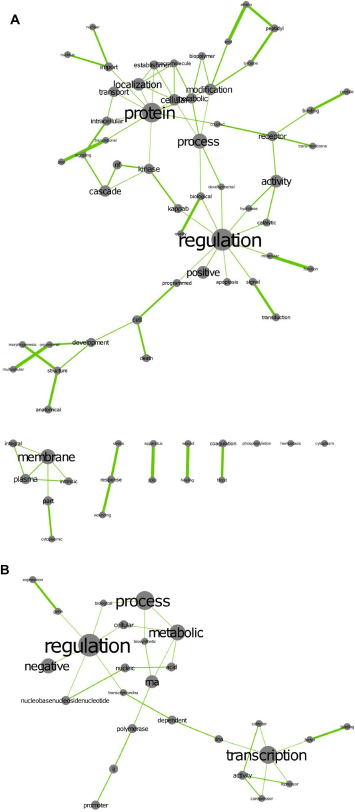
Wordcloud network derived from the subGSE analysis of time. 651 gene sets (P = 0.029) were selected and an enrichment map derived using (
At 6 HPI four genes were identified that showed at least a twofold change in expression in response to infection by N. caninum. Thioredoxin (Trx1) is a fundamental component of the pathways that maintain redox homoestasis, 43 B3gnt5 is crucial for development of B cells in spleen, 44 Cnn3 regulates phagocyte motility, 45 and S100A9 is secreted by both neutrophils and monocytes early during infection. 46
An interesting outcome of these analyses is the observed mouse response associated with fatty acid metabolism at 10 DPI. Acadvl, Adipor2 and Mest were all raised significantly in expression at 10 DPI in comparison to uninfected mice. Acadvl is a mitochondrial, very long-chain specific acyl-CoA dehydrogenase involved with the initial steps of fatty acid β oxidation that generates ATP in mitochondria. 47 Adipor2 is a receptor for adiponectin, an anti-inflammatory adipocytokine produced by adipocytes. 48 Adipor2 is typically expressed in the liver and disruption of Adipor2 results in decreased PPAR-α signaling and increased inflammation and oxidative stress, ultimately leading to glucose intolerance. 49 Mest is induced in response to dietary fat 50 and knock down of Mest expression prevents adipogenesis. 51 Aak1 also showed raised expression in response to infection by N. caninum at 10 DPI; this Ser/Thr kinase triggers clathrin assembly during clathrin-mediated endocytosis, which is also a feature of adiponectin signaling. 48 Such observations suggest a direct effect of infection by N. caninum on fat cells, as well as metabolism of fatty acids. Coincidentally, recent research using a new animal model (the fat-tailed dunnart) has provided direct evidence that the mass of body fat is dramatically reduced during the course of infection of a susceptible animal by N. caninum. 52 Obviously there are important leads here to investigate further. For example, BALB/c mice infected with NC-Liverpool also tend to loose body weight rapidly from about day 10 DPI and this may also be associated with loss of body fat.
Another of the novel observations made here is the relatively large number of genes in these 37 gene sets that are associated with mammalian development and embryogenesis. This is demonstrated in the word cloud of Figure 2A as the group of nodes in the bottom left hand corner linked to development. Module.38 and the sets linked to Morphogenesis are examples of gene sets containing such genes. Mest is extensively expressed in fetal tissues, 53 while Acadvl is also widely expressed. 54 S100A9 is a proinflammatory mediator secreted by leukocytes at sites of infection or injury. Studies have also implicated the molecule in control of intrauterine infections, 55 as well as the onset of labor. 56
A developing theme is therefore that genes associated with host responses to pathogens are also associated with reproduction and fetal development. The multifunctional role of proteins such as those discussed here shows this to be a reasonable assertion. Another example is that of TGF-β, which is produced in response to infection but is also involved in a wide range of other processes including remodeling of the feto-maternal interface. 57 A mechanism of molecules possessing many different functions may well represent a means for preserving the health of the pregnant animal during infection, at the potential expense of the unborn fetus. That pregnant mice often resorb fetuses in response to infection is well known and a simple illustration of this. 15
Fetal death and abortion are the main clinical signs observed in cattle following infection by N. caninum and it is believed that the route and timing of infection determines the outcome of the pregnancy.58,59 Recently, progress in this area from studies on cattle indicates placental function may contribute to control of infection by N. caninum rather than simply being deleterious to fetal survival. 60 Similarly, studies on fetal immunity suggest the timing of infection in relation to development of fetal immune competence is a key process in determining the outcome of infection on pregnancy.59,60 The studies described here and elsewhere provide additional leads to explore during investigations of cattle responses to N. caninum, especially during pregnancy. In cattle, there is evidence that liver Acadvl expression is correlated with serum nonesterified fatty acid levels. 61 A duodenal infusion of alpha-linolenic acid into dairy cattle was also shown to have immunomodulating activity that was associated with changes in γ interferon. 62 The link between fatty acid metabolism and inflammation is obviously one of the more important areas to be explored further. As it is recognized that immune responses differ between adult and fetus,63,64 studies on fetal immunity may also provide the clues needed to understand the link between neosporosis and fetal death and abortion.
Funding
This research was funded by the University of Technology, Sydney.
Author Contributions
Conceived and designed the experiments: JE, SB. Analyzed the data: JE, SB, SG. Wrote the first draft of the manuscript: JE, SB. Contributed to the writing of the manuscript: JE, SB, SG, PK. Agree with manuscript results and conclusions: JE, SB, SG, PK. Jointly developed the structure and arguments for the paper: JE, SB, SG, PK. Made critical revisions and approved final version: JE, SB, SG, PK. All authors reviewed and approved of the final manuscript.
Disclosures and Ethics
As a requirement of publication author(s) have provided to the publisher signed confirmation of compliance with legal and ethical obligations including but not limited to the following: authorship and contributorship, conflicts of interest, privacy and confidentiality and (where applicable) protection of human and animal research subjects. The authors have read and confirmed their agreement with the ICMJE authorship and conflict of interest criteria. The authors have also confirmed that this article is unique and not under consideration or published in any other publication, and that they have permission from rights holders to reproduce any copyrighted material. Any disclosures are made in this section. The external blind peer reviewers report no conflicts of interest.
Footnotes
Acknowledgements
We thank Qi Liu and Yutaka Yasui (University of Alberta) and Xiting Yan (Yale University) for their patience and assistance with installing SAM-GS and subGSE respectively.
JE's institution has patented previous work on Neospora caninum. Other authors disclose no competing interests.