
Abstract
An effective strategy to elucidate the signal transduction cascades activated by a transcription factor is to compare the transcriptional profiles of wild type and transcription factor knockout models. Many statistical tests have been proposed for analyzing gene expression data, but most tests are based on pair-wise comparisons. Since the analysis of microarrays involves the testing of multiple hypotheses within one study, it is generally accepted that one should control for false positives by the false discovery rate (FDR). However, it has been reported that this may be an inappropriate metric for comparing data across different experiments. Here we propose an approach that addresses the above mentioned problem by the simultaneous testing and integration of the three hypotheses (contrasts) using the cell means ANOVA model. These three contrasts test for the effect of a treatment in wild type, gene knockout, and globally over all experimental groups. We illustrate our approach on microarray experiments that focused on the identification of candidate target genes and biological processes governed by the fatty acid sensing transcription factor PPARα in liver. Compared to the often applied FDR based across experiment comparison, our approach identified a conservative but less noisy set of candidate genes with same sensitivity and specificity. However, our method had the advantage of properly adjusting for multiple testing while integrating data from two experiments, and was driven by biological inference. Taken together, in this study we present a simple, yet efficient strategy to compare differential expression of genes across experiments while controlling for multiple hypothesis testing.
Keywords
Introduction
Genome-wide transcriptional profiling, or transcriptomics, is extensively used to study how cells respond to certain stimuli or to diagnose and predict clinical outcomes.1–4 Transcription factors (TFs) are the key effectors which control gene expression. From a variety of research fields, including nutrition sciences, there is a major interest in characterizing the genes and networks that are controlled by transcription factors. Advances in genome-wide expression profiling methodologies and the availability of model systems offered new, powerful tools to address this.5–11
An effective strategy to elucidate the signal transduction cascades activated by transcription factors is through transcriptional profiling. Transcription profiling can be applied on gain- and loss-of-function TF mutants, and changes in global gene expression that are associated with the various phenotypes could then be used for a comprehensive understanding of TF function.6,7,11–13 To this end, transcription factor target genes have to be efficiently and accurately identified from the transcriptomics data set. It is important to realize that from a biological perspective, TF target genes are only those genes that do significantly respond upon treatment with a potent agonist or gain of function, in wild type but not mutant (knockout) models. However, from a statistical inference point of view the identification of biological relevant target genes from such 2 × 2 factorial experiments is less straight-forward.
It is generally accepted that statistical testing is required to reliable identify differentially expressed genes (reviewed in eg, Allison et al. 14 ). Moreover, since the statistical analysis of microarrays involves the testing of multiple hypotheses (genes) within one study, it is necessary to control for false positives. A frequently used metric to quantify the level of confidence any particular gene is differentially expressed, that takes into account multiple testing, is the false discovery rate (FDR). 14 Therefore in many studies a cutoff based on the FDR rather than P-value is used to select significantly regulated genes within experiments, which subsequently are compared across experiments to identify transcription factor target genes. However, Higdon et al 15 reported that the use of the FDR and its associated q-value may result in inconsistent and misleading interpretation of the comparisons across different experiments, especially when the effect sizes of the experiments vary dramatically, as for example is the case when comparing effects of potent agonists in wild type and TF knockout models.
Therefore, the purpose of the work described in the current paper is to present a strategy that optimally integrates and controls for multiple hypothesis testing using data obtained from two biological systems that respond completely different to a treatment. We outline our approach using one of our datasets on the mouse peroxisome proliferator-activated receptor alpha (PPARα). 16 PPARα is a TF belonging to the nuclear receptor superfamily, and is activated by a variety of compounds, including dietary fatty acids and their derivatives as well as synthetic agonists.17–19
Material and Methods
Experimental data
We illustrate our approach (Fig. 1) on one of our publicly available datasets (Gene Expression Omnibus (GEO) accession: GSE8295). This dataset was generated to identify PPARα target genes in mouse liver, 16 and was also used by Higdon et al 15 to illustrate the inappropriateness of using the FDR as cut-off metric when comparing two transcriptomics experiments with different effect sizes.

Overview of our integrated strategy.
Briefly, pure bred wild type (129S1/SvImJ) and PPARα-null (129S4/SvJae-Pparatm1Gonz/J) mice 20 were fed chow or chow supplemented with 0.1% WY14643 (Chemsyn, Lenexa, KS) for 5 days (n = 4 mice per group). WY14643, ({4-Chloro-6-[(2,3-dimethylphenyl)amino]-2-pyrimidinyl}-sulfanyl)acetic acid (CAS: 50892-23-4), is a chemical that was developed by the pharmaceutical industry to lower serum cholesterol. It is not used in clinical applications, but it is rather used as prototype chemical to induce peroxisome proliferation. WY14643 is a highly specific and potent agonist for PPARα and is therefore often used in studies on this nuclear receptor.21,22 On the sixth day, mice were anaesthetized and livers were excised. Total RNA was prepared using TRIzol reagent (Invitrogen, Carlsbad, CA) followed by purification using the RNeasy mini kit (Qiagen, Hilden, Germany). RNA integrity was checked by chip analysis (Agilent 2100 bioanalyzer, Agilent Technologies, Amsterdam, The Netherlands) according to the manufacturer's instructions. RNA was judged as suitable for array hybridization only if samples exhibited intact bands corresponding to the 18S and 28S ribosomal RNA subunits, and displayed no chromosomal peaks or RNA degradation products, and had a RNA integrity number (RIN) above 8.0). The Affymetrix GeneChip RNA One cycle Amplification Kit (Afffymetrix, Santa Clara, CA) was used to prepare labeled cRNA from 5 μg of total RNA, which subsequently was hybridized on Affymetrix Mouse Genome 430 2.0 plus arrays. The animal study was approved by the Local Committee for Care and Use of Laboratory Animals.
Cell means ANOVA model
The dataset on the identification of PPARα target genes in mouse liver has a 2 × 2 factorial design; that is factor ‘treatment’ has 2 levels (WY, Control), as has the factor ‘genotype’ (wild type, knockout). Analysis of variance (ANOVA) is commonly used for analyzing data from experiments with multiple categorical factors.23,24 To appropriately identify candidate PPARα target genes, we propose to perform and integrate three comparisons using the cell means ANOVA model. 25 For every probeset the model was defined as follows:

where Yijk is the expression of a probeset at ith treatment (1 for WY, 2 for Control) in jth strain of genotype (1 for WT, 2 for KO) and kth replication (n = 4), μ is the mean value of ith treatment and jth strain of each gene, and ∊ijk is a random error term which follows normal distribution with mean = 0 and variance = σ 2 .
Formally, the definition of a contrast C is expressed below, using the notation μj for the jth treatment mean:

where,

As stated before, from a biological perspective, candidate PPARα target genes are only those genes that do significantly respond upon treatment with the potent PPARα agonist WY14643 in wild type but not in PPARα knockout mice. Therefore three different contrasts (comparisons) from this 2 × 2 factorial experiment were combined to infer the probesets that were significantly and PPARα-dependently regulated. The different contrasts tested were (Table 1):
The contrasts defining the different hypotheses.

Contrast 1: H0: μ11 – μ21 = 0 versus H1: μ11 – μ21 ≠ 0, returning all probesets regulated in the wild type mice by the agonist WY;
Contrast 2: H0: μ12 – μ22 = 0 versus H1: μ12 – μ22 ≠ 0, returning all probesets regulated in the PPARα knockout mice by the agonist WY; and
Global Contrast: H0:(μ11 – μ21) – (μ12 – μ22 = 0 versus H1: (μ11 – μ21) – (μ12 – μ22) ≠ 0, returning the overall differential expressed probesets in wild type versus knockout mice groups after treatment with WY compared to control.
The PPARα-dependently regulated probesets were then identified by extracting those probesets that were only significantly regulated in both Contrast 1 and Global Contrast, and subsequently corrected for multiple testing.
Implementation
All analyses were performed in R, 26 using packages from the Bioconductor project. 27 Probesets were redefined according to Dai et al. 28 In this study, probes were reorganized based on Entrez Gene database, build 36, version 2 (remapped CDF version 12). Our workflow was as follows (note that since we used a remappped chip definition file based on the Entrez Gene database, the terms probeset and gene are used interchangeably):
Expression estimates were obtained by GC-robust multiarray (GCRMA) normalization, using the empirical Bayes approach to adjust background. 29
For each of the three above-mentioned contrasts, differentially expressed probesets (genes) were identified using linear models, as implemented in limma. 30 For each contrast probesets were selected based on P < 0.05.
Probesets that were common only in Contrast 1 and the combined Global Contrast were identified. This set of probesets represented only transcription factor regulated genes, and was designated X.
Multiple testing was corrected for using a false discovery rate method, 31 based on the Global Contrast considering the output of all probesets. Probesets in X that satisfied the criterion FDR < 5% were considered to be transcription factor target genes.
An schematic overview of our implementation is also given in the Figure 1, and the R-code and other required files are available as supplemental material.
Validation
To validate our integrated approach, obtained results (Fig. 2) were compared to results from the across experiment comparison (Fig. 3) using two sets of well-established PPARα target genes obtained from a recent review (Table 1 from Rakhshandehroo et al 32 ). These sets are available as supplemental material. The true positive rate (sensitivity) as function of the false positive rate (1-specificity) for different cutoff points was plotted for both the across experiment comparison and our integrated approach using the R-library ROCR. 33 The partial area under the ROC curve was calculated using P = 0.2 (thus 1-specificity = 0.2) as cutoff. This cutoff value was chosen because for the identification of transcription factor target genes a high specificity is required (>80%) before considering its sensitivity. 34 In addition, the biological features that were overrepresented in the lists of candidate PPARα target genes that were generated on the basis of both approaches were analyzed with the software tool Ontologizer, 35 applying the ‘parent-child-union’ (PCU) algorithm and using the biological process ontology of Gene Ontology.

Application of the integrated approach on PPARα dataset GSE8295.

The FDR based across experiment comparison of PPARα dataset GSE8295.
Results and Discussion
Identification of candidate PPARα target genes
The application of transcriptomics to compare the effects of specific agonists, such as WY14643, in wild type and PPARα knockout mice is a powerful approach to identify candidate PPARα target genes.12,13 However, when comparing across different experiments the use of FDR cutoff values may result in inconsistent and misleading interpretation of the data. 15 In this study we propose a simple yet effective strategy that avoids comparing probesets across experiments based on FDR values while still controlling for multiple testing. Testing three different hypotheses (contrasts) for each probeset allowed the robust identification of transcription factor target genes. Since only the interaction effects are of interest for identifying candidate target genes, the cell means ANOVA model was used to infer this 2 × 2 factorial design.
The number of probesets significantly regulated (P < 0.05) upon PPARα activation by WY14643 in wild type mice (= Contrast 1) equaled to 5458, whereas in PPARα –/– mice (Contrast 2) this number was only 1540 (Fig. 2).
Such a large difference was expected since the KO mice do not express any functional PPARα. The Global Contrast, incorporating expression information for all probesets in all groups, identified 4282 significantly regulated probesets (P < 0.05) (Fig. 2), representing genes that from an inferential perspective are differentially regulated by WY between the two mouse strains. However, these included genes that for example were only regulated in the KO mice, or were regulated in wild type and, although to a lesser extent, still in KO mice. To filter out these ‘biological irrelevant’ genes, only probesets that were common in Contrast 1 and Global Contrast were retained, resulting in a set of 3345 probesets, which was called set X. Thus, this set X contained only probesets that from a biological perspective fulfill the criterion of being candidate PPARα target genes. To correct for multiple testing, FDR values of the 3345 genes in X were calculated based on all 16392 genes in Global Contrast, since in this comparison statistical inference was simultaneously adjusted for both experiments in wild type and knockout mice. Finally, a robust set of PPARα target genes was obtained by selecting those 2432 probesets from set X that fulfilled the criterion FDR < 0.05 (Fig. 2). Of these, 1325 probesets were induced and 1107 probesets were suppressed.
For comparison, we also generated a list of candidate PPARα target genes that were generated on the basis of directly comparing the wild type and knockout experiment using a FDR cutoff (Fig. 3). Note that this frequently used approach is criticized 15 and that it is in essence identical to the analysis strategy published and interpreted by Rakhshandehroo et al 16 , except that these authors also employed a fold change cutoff. Using a FDR cutoff of 0.05, we identified 4324 probesets that were regulated in the wild type experiment (Contrast 1), whereas 12 probesets were changed in the knockout experiment (Contrast 2). Of these 12 probesets, 10 were also regulated in the wild type experiment. Thus, the FDR based comparison of these two experiments identified 4314 probesets that should be considered PPARα target genes.
The number of FDR based selected probesets was about twice as large as the list of probesets obtained using our integrated approach (4314 versus 2432 probesets). Comparison of these two sets of candidate genes revealed that almost all (i.e. 99%) of the probesets obtained by our integrated approach were also identified when using a FDR cutoff (Fig. 4). This indicates that while Global Contrast is more conservative it will identify similar if not identical biological features (see also section on validation).
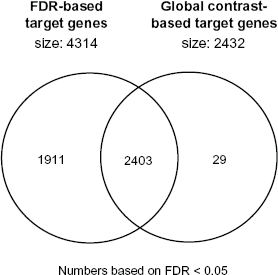
Venn diagram of the identified candidate PPARα target genes obtained by our integrated approach or the FDR based across experiment comparison of PPARα dataset GSE8295.
It is important to realize that the results of statistical hypothesis testing are never free of error. Two types of error are distinguished: type I error, i.e. rejecting the null hypothesis when it is in fact true, and type II error, i.e. not rejecting the null hypothesis when in fact the alternative hypothesis is true. In other words, occurrence of the former leads to inclusion of false positives whereas the latter leads to inclusion of false negatives. Consequently, we cannot exclude that the set of 1911 probesets that were discarded by Global Contrast contained false negatives that otherwise would have been retained. However, especially within the context of genome-wide screening studies for candidate genes, we believe that limiting type I error is of primary concern, and that of type II error is of secondary importance. Thus, to err on the safe side we prefer to control for false positives rather than for false negatives. Moreover, the probesets that were discarded by Global Contrast were characterized by a relatively low effect size compared to the probesets that were still included. The mean of the absolute coefficients (log2 of the fold-change) of the excluded probesets was 0.36 (equaling to a mean fold change of 1.28), and was 0.87 (mean FC = 1.83) for the included probesets. Taken together, we showed that compared to the FDR based across experiment comparison our approach identified a conservative set of more robustly regulated candidate PPARα target genes. We believe this is advantageous because a clear overview of candidate genes and corresponding biological process normally is aimed for.
Validation
To compare the performance of our integrated approach with that of the FDR based across experiments comparison, we first performed a sensitivity versus specificity analysis. To this end two benchmark sets of well-established PPARα target genes were selected from a review that summarized the latest literature on this topic. 32 We created two benchmark sets; one set containing only 32 genes, and another set containing 189 genes. The smaller benchmark set contained only genes that were demonstrated to be bona fide PPARα target genes in both human and mouse liver and that do contain a functional PPAR response element (PPRE) in the regulatory regions. The larger benchmark set contained all genes that were demonstrated to be PPARα-dependently regulated in mouse liver but for which no functional PPRE has yet been identified. We next plotted the true positive rate (sensitivity) as function of the false positive rate (1-specificity) for different cutoff points for both our integrated approach and the across experiment comparison (Fig. 5).

Sensitivity versus specificity of our proposed method and the across experiment comparison.
Even though our approached identified a conservative list of candidate genes, we observed that it performed very similar to the across experiment comparison in identifying known PPARα target genes, which was also reflected by almost identical partial area under the ROC curve (pAUC; P = 0.2) for both methods. Values were 0.129 and 0.121, respectively for the across experiment comparison and our integrated approach when the smaller set of 32 PPARα target genes was used, whereas these numbers were 0.128 and 0.124, respectively, for the larger set of 189 putative PPARα target genes.
Next we detected and compared the biological features that were overrepresented in the lists of candidate PPARα target genes that were either generated by our approach or the across experiment comparison. Enriched biological processes were identified by overrepresentation analysis based on Gene Ontology (GO) categories, which is a generally accepted procedure to achieve this. 14 To this end the software tool Ontologizer was used, 35 applying the ‘parent-child-union’ (PCU) algorithm. This algorithm takes the graph structure of GO into account, thereby reducing false-positive and biologically misleading results. 36 We ran the PCU algorithm on the biological process ontology of GO. Using the Benjamini-Hochberg correction for multiple testing and a cutoff of 0.05, 27 significantly enriched categories (out of 172 annotated categories) were returned in the list of 4314 putative PPARα target genes obtained by comparing the wild type and knockout experiment (Fig. 6A).
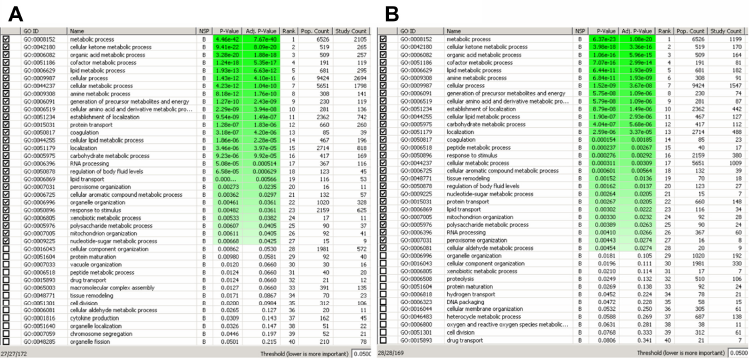
Significantly enriched Gene Ontology categories found in the two lists of candidate PPARα target genes.
Similarly, using the same criteria 28 significantly enriched categories (out of 169 annotated categories) were scored in the list of 2432 genes generated by our integrated approach (Fig. 6B). Twenty-five identified enriched biological processes were identical in both sets of genes. As expected, many processes that were enriched have been functionally demonstrated to be controlled by PPARα, including cellular ketone metabolic process, lipid metabolic process, cellular amino acid and derivative metabolic process, peroxisome organization, and mitochondrion organization.17,37,38 Thus, despite the drastically reduced number of candidate PPARα target genes identified by our approach, GO enrichment analysis demonstrated a very similar functional characterization of these genes, again demonstrating the validity of our strategy.
Conclusions
Taken together, in this study we present a simple, yet efficient strategy to compare genes across experiments that controls for multiple testing and is able to properly detect differentially expressed genes. Compared to the conventional used FDR based across experiment comparison, our approach is more conservative and less noisy. Our approach is in particular suitable to identify candidate target genes of a transcription factor or signaling route from functional genomics experiments, but can be applied to any genomics experiment in which the effects of a treatment are compared between two genotypes.
Funding
This work was partially supported by the Wageningen University program for Systems Biology to MM (IP/OP SysBio).
Author Contributions
Conceived and designed the experiments: MOU, MM, GH. Analysed the data: MOU, GH. Wrote the first draft of the manuscript: MOU. Made critical revisions and approved final version: MM, GH. All authors reviewed and approved of the final manuscript.
Disclosures and Ethics
As a requirement of publication author(s) have provided to the publisher signed confirmation of compliance with legal and ethical obligations including but not limited to the following: authorship and contributorship, conflicts of interest, privacy and confidentiality and (where applicable) protection of human and animal research subjects. The authors have read and confirmed their agreement with the ICMJE authorship and conflict of interest criteria. The authors have also confirmed that this article is unique and not under consideration or published in any other publication, and that they have permission from rights holders to reproduce any copyrighted material. Any disclosures are made in this section. The external blind peer reviewers report no conflicts of interest.
Footnotes
The authors disclose no potential conflicts of interest.
Supplementary Materials
Supplementary 1. R code to perform the described analysis.
Supplementary 2. Sample description file for use with limma.
Supplementary 3. Excel file containing the two benchmark gene sets.