
Abstract
Genome-wide association studies (GWAS) have been successful in detecting common genetic variants underlying common traits and diseases. Despite the GWAS success stories, the percent trait variance explained by GWAS signals, the so called “missing heritability” has been, at best, modest. Also, the predictive power of common variants identified by GWAS has not been encouraging. Given these observations along with the fact that the effects of rare variants are often, by design, unaccounted for by GWAS and the availability of sequence data, there is a growing need for robust analytic approaches to evaluate the contribution of rare variants to common complex diseases. Here we propose a new method that enables the simultaneous analysis of the association between rare and common variants in disease etiology. We refer to this method as SCARVA (simultaneous common and rare variants analysis). SCARVA is simple to use and is efficient. We used SCARVA to analyze two independent real datasets to identify rare and common variants underlying variation in obesity among participants in the Africa America Diabetes Mellitus (AADM) study and plasma triglyceride levels in the Dallas Heart Study (DHS). We found common and rare variants associated with both traits, consistent with published results.
Introduction
Genome-wide association studies (GWAS) have proved to be an important tool for the identification of common genetic variants associated with many complex diseases and traits.1,2 Notably, however, the collection of variants identified so far through GWAS explain only a small fraction of the heritability estimated from family studies for any particular disease or trait.3,4 It has been suggested that this “missing heritability” is due to the collective effects of rare variants which are usually unaccounted for in GWAS. The “rare variant hypothesis”5–7 proposes that a significant proportion of the inherited susceptibility to relatively common human chronic diseases may be due to the cumulative effects of a series of low frequency dominantly and independently acting variants at different genes, each conferring a moderate, but detectable, increase in relative risk. It is believed that such rare variants will mostly be population-specific, because of founder effects resulting from genetic drift. Data from published results show that the effects of rare variants tend to be larger than those of common variants. For example, only a handful of risk estimates for common variants (ie, frequency ≥5%) exceeds 2 with the majority falling between 1.1 and 1.4.8,9 In contrast, rare variants tend to have risk estimates that are larger than 2. Moreover, it is believed that associated rare variants are more likely to be causal.7,9 A comprehensive review of current understanding of the allelic complexity of human disease genes is provided by Smith and Lusis. 10 In addition, Bodmer and Bonilla 7 provided a historical review of the search for genetic variants influencing susceptibility of an individual to a chronic disease, from R.A. Fisher's seminal work to the current progress of whole-genome association studies.
The current thinking about the contribution of rare variants to complex diseases and traits has motivated the development of new analytic tools. Li and Leal 11 developed combined multivariate and collapsing and kernel based adaptive cluster methods to test for rare variant associations with complex traits. Price et al 12 considered a method for the analysis of rare variants. Other approaches have been proposed by Grady et al, 13 Morris and Zeggini 14 and Zhu et al. 15 McClellan et al 16 summarized evidence for rare alleles responsible for Schizophrenia, Shental et al 17 proposed a method based on compressed sequences. Notably, all of these approaches are based on the separate analysis of common and rare variants. However, we believe that the most efficient strategy to localize disease/trait variants will involve approaches that can identify both common and rare variants in the same model. Also, the method should distinguish between significant rare variants that increase risk and those that are protective. We present such an approach in this study.
The Method
Our method uses quantitative trait data with typed haplotypes and covariates from unrelated individuals. The term “rare variant” seems to lack a common definition; some define it as a variant with a minor allele frequency less than 1%, but with non-negligible effect, residing in a functional unit, such as a gene. 18 Here we define a rare variant as a haplotype with population frequency less than 1%. In this study, genomic loci (eg, genes or chromosomes) are first partitioned into haplotypes, defined as a consecutive strings of SNPs transmitted together from parents to offspring, using existing methods (for example, HapLink, the HapMap website.19–21 The association of common haplotypes are modeled separately, while the combined association of all rare haplotypes is modeled, to overcome the problem of a low number of observations. The proposed method is a joint regression model with common and rare alleles as covariates, along with other covariates.
We refer to this method as SCARVA (simultaneous common and rare variants analysis).
Let
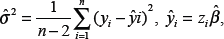
A standard method of analyzing quantitative phenotype in the presence of covariates is regression. First, we describe a regression model in which the effects of all rare alleles are modeled by a single parameter. Due to the expectation that some rare variants will be positively associated, while others will be inversely associated, we first identified the direction of the association (Step III below) in a single effect model and then modeled the positive and negative associations using different parameters. This modeling strategy minimizes the loss of power that is likely to result from the single effect model and simultaneously analyzes rare variants that are positively and negatively associated with the underlying trait(s). Also, the proposed stepwise regression approach effectively addresses a major limitation of most existing rare variants analysis, which is the combined analysis of non-functional and functional variants with the resulting loss of statistical power.
Let 

To simplify notations, let 

So the proposed approach for the identification of common and rare variants that are associated with the trait of interest consists of several steps as discribed below.
Step I. Fit the saturated model (2)
The least squares estimate 
Step II. Analysis of Common Risk Allele(s)
Here we test the significance of the coefficient
Let 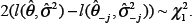
Given a significance level of 
After testing all the
Step III. Analysis of rare allele(s)
The risk rare alleles are of two types: alleles that are positively associated with the trait of interest (ie, contributes positively to the effect

Based on our simulation studies and with the assumption that risk rear variants generally account for no more than 30% of all real variants), we recommend the following values for γ: γ = 1.1, 1.3 and 1.5 to represent somewhat significant, significant and very significant.
If
Thus, we can identify all the positively and negatively associated rare variants in a given haplotype. Now let
Note: if an analysis locus has only 1 rare allele, it may not be meaningful to analyze it because the corresponding number of observations will be too few to make reliable conclusion.
Step IV. Fit the final model
Now with 
The least squares estimates of the parameter
Simulation Study
We simulated a range of datasets with varied parameter values and different numbers of variants, and used SCARVA to analyze the generated data. In this simulation we sampled data sets based on a set of 4,000 observed quantitative traits, covariates, and corresponding alleles within a given haplotype region; for brevity, we present the results from one of these simulation exercises. We simulated observed haplotypes directly, without simulating genotypes and constructing haplotypes by existing methods. The simulated haplotype region contained 20 alleles, with the first 10 designated as common and the last 10 as rare, with frequencies (
For each of the individual observations ()
Λ/

We correctly identified the common risk allele 3 with a
Real Data Analysis
We used SCARVA to analyze two independent real datasets to identify rare and common variants underlying variation in obesity among participants in the Africa America Diabetes Mellitus (AADM) study and plasma triglyceride levels in the Dallas Heart Study (DHS). 23 The software PHASE, 24 was used to construct haplotypes. For both traits, our results were consistent with published results.
First Real Dataset
The AADM dataset included 141 unrelated individuals from West Africa who were part of a linkage and association study of type 2 diabetes (T2D) and associated risk factors, including BMI, a commonly used measure of the degree of adiposity. The AADM protocol was approved by the institutional review board of Howard University and the respective institutions in West Africa. Written informed consent was obtained from each participant.
For this study we focused on the linkage and association signal observed in a 19cM region on chromosome 5. After evidence for strong linkage in this region (125906 bp to 125960 bp) on chromosome 5, we conducted fine-mapping using experimentally and imputed SNPs genotypes for an average map density of less than 1 kb. The results of the fine-mapping (manuscript in preparation) identified a very strong candidate gene for obesity and this gene was subsequently sequenced using Sanger technology. It is this sequence data that was analyzed using SCARVA. Using an established method,
25
we identified 9 haplotype blocks in this gene. The results of the analyses of the haplotypes within these blocks using SCARVA were similar to those obtained using traditional methods, like logistic regression. Some numerical details of these results, including values of the corresponding
Λ/

As shown in Table 2, we observed a significant (
The overall results for all the nine haplotypes are summarized in Table 3 below. Displayed in the table are the number of common and rare haplotypes, the significant common allele with the corresponding
Summary results for the AADM data.

In addition to the results described above for haplotype 1, we observed that common allele 4 (
To evaluate our real dataset and compare the results to those obtained from SCARVA, we used QuTie
26
approach (the Rare Variant Analysis Tool for Quantitative Trait). Notably, the QuTie method is designed to detect association of rare allele(s) only. It pools the low frequency/rare variants within defined regions and treats them as a single super locus, with analysis by linear regression and student's
Second Real Dataset
The aim of the Dallas Heart Study
23
was to use a reverse genetic strategy to test the hypothesis that 4 angiopoietin-like proteins (
We reanalyzed the DHS sequencing data for the three genes (
Summary results for the ANGPTL data.

Briefly, the results of our reanalysis using SCARVA are as follows: we observed 2 common and 7 rare variants in
Discussion
We proposed a novel approach (SCARVA) for the combined association analysis of common and rare variants in disease and non-disease trait research. SCARVA is a regression-based strategy that uses quantitative trait and haplotype data together with covariates. The common alleles analysis implemented in SCARVA is a straightforward linear regression. However, to avoid the problem of dimensionality (ie, large number of parameters with very small dataset), SCARVA models the effect of rare alleles using a single parameter with the well-developed approach of identifying variants that show positive as well as negative associations. Furthermore, we implemented the BIC and the AIC as test statistics, because the modeling of rare alleles is partly non-nested, the classical chi-squared approach is not appropriate. In this regard, the rare variants analysis in SCARVA is less ‘quantitative’ than that of the common alleles. We note that, as implemented, SCARVA addresses a major limitation (ie, dilution of power due to the combined analysis of functional and non-functional variants) of current rare variants analysis software packages. Finally, we showed that the method is simple to use and computationally effcient. Simulation studies showed that the method works well and can accurately identify both the common and rare risk alleles defined as those variants with at least moderate effects on the trait.
In principle Step 2 and 3 can be done iteratively, but we prefer the current order of Step 2 then followed by Step 3, as data on common alleles have more observations, and results inferred from them are more reliable than those from rare alleles. Thus we use the common alleles to guide the regressor selection in the model.
SCARVA uses haplotype information instead of individual SNPs, which lowers the computational burden of the analysis. However, this computational advantage is at the cost of lower resolution. As part of future efforts in our lab, we are actively exploring how to extend SCARVA to accommodate the analysis of both haplotypes and individual SNPs. In this case synthetic association27,28 can be considered.
Disclosures
Author(s) have provided signed confirmations to the publisher of their compliance with all applicable legal and ethical obligations in respect to declaration of conflicts of interest, funding, authorship and contributorship, and compliance with ethical requirements in respect to treatment of human and animal test subjects. If this article contains identifiable human subject(s) author(s) were required to supply signed patient consent prior to publication. Author(s) have confirmed that the published article is unique and not under consideration nor published by any other publication and that they have consent to reproduce any copyrighted material. The peer reviewers declared no conflicts of interest.
Footnotes
Acknowledgement
This work is supported in part by the National Center for Research Resources at NIH grant 2G12RR003048, and by the Center for Research on Genomics and Global Health (CRGGH) at NHGRI/NIH.