
Abstract
Brugada syndrome (BrS) is a rare cardiac arrhythmia with a complex and largely unexplained genetic basis. In this study, we analysed genomic data from 214 Taiwanese BrS cases and 1316 controls to uncover susceptibility loci using genome-wide association study (GWAS), copy number variation (CNV) analysis, and rare-variant association test (RVAT). Imputation with a population-specific Merged-TWN-panel yielded the highest accuracy across SNP categories. GWAS identified four genome-wide significant SNPs across three loci, including SCN10A, ZNF451, and RP11-510I5, with the ZNF451 locus showing a strong association (OR = 9.845, P = 6.8e-11). The total SNP-heritability for BrS was estimated at 0.18 (SE = 0.20), and SNPs located in the 3 risk loci regions accounted for 0.13 (SE = 0.02) of the phenotypic variance. Functional annotation revealed several regulatory non-coding SNPs, and gene-based analysis confirmed SCN10A as significant. Notably, ZNF451-AS1, a non-coding RNA gene overlapping the ZNF451 region, was identified via RVAT, suggesting that both common and rare variants at this locus contribute to BrS risk. CNV analysis further identified potential case-enriched regions, including a duplication involving HRAS. These findings underscore the importance of population-specific genomic resources and highlight ZNF451 as a key susceptibility locus, bridging both common and rare-variant contributions to BrS.
Keywords
Introduction
Brugada syndrome (BrS) is a rare and potentially fatal cardiac arrhythmia, first described in 1992, that predisposes individuals to sudden cardiac death, often presenting as ventricular fibrillation.1,2 It predominantly affects younger males with structurally normal hearts and accounts for approximately 4% of global cardiac deaths.1,3 BrS has a prevalence of 5 to 20 cases per 10 000 healthy individuals, with a notably higher frequency in Southeast Asian populations, where it is considered endemic. 4 Diagnosing BrS is challenging due to its reliance on specific electrocardiogram (ECG) patterns that are only observable during an arrhythmic event, while patients typically exhibit normal ECG patterns, heart structure, and function prior to such events. This complicates traditional risk assessment and early detection. 5
Genetic research has shifted towards identifying genetic markers that could help predict BrS risk. The SCN5A gene, responsible for encoding the cardiac sodium channel, was the first gene implicated in BrS. 5 However, variants in SCN5A only explain 20% to 30% of BrS cases, leaving the genetic basis for many cases unexplained. 6 SCN5A harbours over 350 rare variants, and fewer than 10 copy number variations (CNVs), 7 with 37% to 47% of rare variants classified as deleterious. 8 Despite these findings, the genetic contribution of SCN5A variants to BrS is limited. Beyond SCN5A, over 150 other genes have been linked to BrS, but collectively these variants explain just 10% of cases, suggesting a polygenic nature for the disease. 4 The heritability of BrS is estimated to be between 17% and 34%, 9 with rare BrS-associated variants (minor allele frequency [MAF] < 0.01) present in about 2% of the global population, though they are more common (~5%) in non-Caucasian populations. 10 These observations highlight the significant role of ethnic background in understanding BrS genetics.
The first genome-wide association study (GWAS) for BrS, published in 2013, 11 identified three significant single nucleotide polymorphisms (SNPs), which were validated in European and Japanese cohorts but only partially replicated in Taiwanese patients. 4 This reinforces the need for population-specific genetic studies to fully uncover the genetic landscape of BrS.
In this study, we aimed to better understand BrS’s genetic architecture by analysing SNP, gene, and CNV data from affected Taiwanese individuals. Our objectives included identifying rare (MAF < 0.01), less-common (0.01 < MAF < 0.05), and common (MAF > 0.05) variants associated with BrS, conducting expression quantitative trait loci (eQTL) analysis to explore genetic associations with gene expression, and enhancing variant detection using a customized ethnicity-specific reference genome. We used a multi-faceted approach that incorporated whole-genome association, rare-variant burden analyses, and functional analysis to identify candidate genes and variants that could serve as biomarkers for early BrS risk detection. The study paves the way for more targeted prevention and management strategies for BrS, especially in populations where the disease is more prevalent.
Methods
The reporting of this study conforms to the STROBE statement 12 and is presented in Supplementary file 1.
Data sources
This study utilized two genome-wide SNP array datasets. The first dataset, referred to as the base dataset henceforth, was used to create a Taiwanese reference panel (TWN-panel). This panel consisted of 96 unrelated BrS cases whose blood samples were genotyped using the Affymetrix Genome-wide TWB array version 2.0 (TWB2), yielding 684 436 SNPs. The TWN-panel was subsequently merged with 1000 Genomes East Asian (1KG-EAS) data to generate two customized reference panels: the Merged-TWN-panel and the Improved-TWN-panel, which were used for imputation of the second dataset, referred to as the study dataset hereafter.
The study dataset comprised 221 unrelated BrS cases genotyped using the Affymetrix Genome-Wide TPM Array version 2.0 (TPM) and TWB2 arrays along with 5000 healthy controls, which were obtained from Taiwan Biobank, a national cohort containing more than 100 000 healthy volunteers in Taiwan. 13 Aborigines were excluded from this study and the diagnosis of BrS was made by two independent cardiologists according to expert consensus. 14 The following criteria were used to diagnose a patient with BrS: (i) Patients with spontaneous type 1 (‘coved-type’) ST-segment elevation, characterized by ST-segment elevation ⩾2 mm (0.2 mV) in ⩾1 right precordial leads (V1-V3) positioned in the 4th, 3rd, or 2nd intercostal space; (ii) when a type 1 ST-segment elevation is unmasked using a sodium channel blocker, diagnosis of BrS should require that the patient also presented with 1 of the following: documented VF or polymorphic VT, syncope of probable arrhythmic cause, a family history of SCD at or before 45 years old with negative autopsy, coved-type ECGs in family members, or nocturnal agonal respiration.
Quality control: raw data
Quality control (QC) (pre-imputation QC) procedures are essential to retain high-quality SNPs and individuals to be used for imputation. Pre-imputation filtering was performed using PLINK1.9 15 with the following exclusion criteria: variants with call rate <95%, minor allele frequency (MAF) < 0.001, Hardy-Weinberg equilibrium (pHWE) <1e-06, duplicates, or multiallelics were excluded. Samples with ±3 standard deviations from the mean heterozygosity rate, cryptic relatedness (PI_HAT) >0.1875 (one sample from each related pair), missing genotypes >5%, missing clinical information, or sex discrepancies were also removed, in alignment with widely accepted GWAS QC standard.16-18 A detailed QC flowchart is shown in Figure 1.
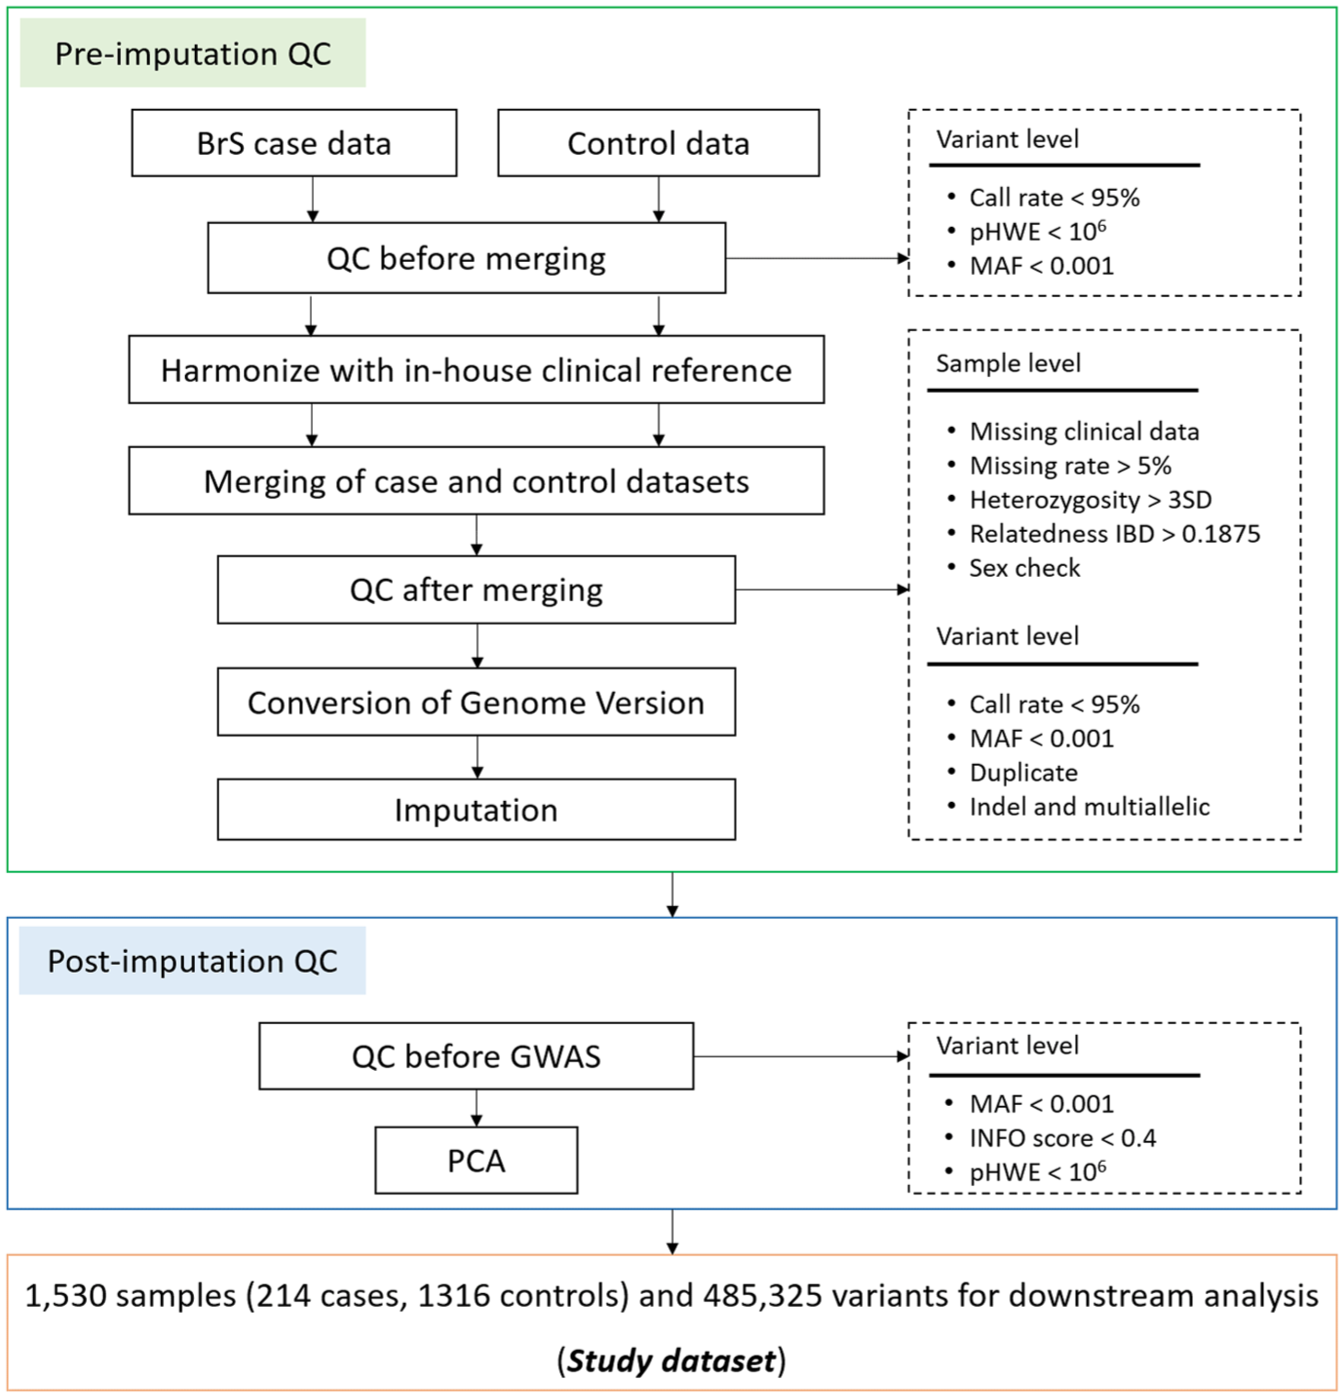
Quality control of study dataset.
For CNV analysis, raw CEL files containing intensity data for each probe from SNP genotyping were used. Standard QC protocols, as detailed in the CNV association analysis section under Methods, were followed to ensure accurate CNV calling and reliable downstream analyses.
Genotype imputation and creation of customized reference panels
Genotype pre-phasing and imputation were conducted using SHAPEIT 19 and IMPUTE 20 respectively. During pre-phasing, individual haplotypes were estimated and iteratively refined based on the haplotype estimates of all other individuals. Missing genotypes were imputed using IMPUTE2, which employs a hidden Markov chain Monte Carlo (MCMC) method to compare haplotypes with those observed in a reference genome. Post-imputation QC was applied to remove low-confidence and poor quality variants. Variants with imputation quality score (INFO) < 0.4, MAF < 0.001 and Hardy-Weinberg equilibrium (pHWE) < 1e-06 were excluded to retain only high-confidence imputed genotypes for downstream analysis, following standard practices in GWAS (Figure 1).16,17,21,22 The Multi-ethnic Imputation System (MI-System) was utilized for all imputations in this study. 23
The study dataset was imputed using three reference panels: 1KG-EAS, Merged-TWN-panel, and Improved-TWN-panel, created as follows: 1KG-EAS: This panel was derived from the 1000 Genomes Phase III dataset, which includes sequence data from 2504 individuals across five subpopulations: African (AFR), American (AMR), European (EUR), East Asian (EAS), and South Asian (SAS).24,25 For this study, only the East Asian subpopulation, comprising 5008 haplotypes and over 88 million variants, was used as the reference panel. Merged-TWN-panel: The TWN-panel was first created by converting Plink binary data into the ‘hap/legend/sample’ format required by IMPUTE2. The ‘merge reference panel’ option of MI-System was used to integrate 1KG-EAS and TWN-panel, with both panels pre-phased and imputed using each other. The merged panel retained phased haplotype information from both sources. Improved-TWN-panel: Using the ‘Improved reference panel’ option of MI-System, the TWN-panel was imputed against the 1KG-EAS reference panel. The resulting imputed TWN-panel incorporated phased haplotypes from 1KG-EAS and unphased haplotypes from the TWN-panel, forming the Improved-TWN-panel.
These tailored reference panels enhanced the representation and accuracy of low-frequency variant imputation for this study population.
Simulation study
Simulation studies were conducted to evaluate the performance of the three reference panels. Random sets of SNPs from the study dataset were masked and then imputed using the reference panels. The imputed genotype probabilities were compared against the original genotypes to assess accuracy.
Three SNP categories were randomly selected based on minor allele frequency (MAF): common SNPs (MAF > 0.05), less-common SNPs (0.01 < MAF < 0.05), and rare SNPs (MAF < 0.01). For each category, 50% of the SNPs with true genotypes were masked and subsequently imputed.
Panel performance was assessed using the following metrics: Imputation Rate: The proportion of masked SNPs successfully imputed. INFO Score: Generated by IMPUTE2, this score ranges from 0 to 1, with higher values indicating more accurate imputations. A cut off of 0.4 was considered acceptable for GWAS applications. Hellinger Score: This platform-independent metric compares the similarity between true genotype probabilities and imputed posterior distributions.
25
The score, calculated as 1−Hellinger distance, measures the overlap of two probability distributions. A Hellinger score ⩾ 0.6 ensures the posterior probability of imputed best-guess genotypes is at least 0.7, indicating high concordance between imputed and original genotypes.
These analyses confirmed the efficacy of the reference panels, with results demonstrating robust imputation performance across SNP categories. The Hellinger distance concept, introduced by Ernst Hellinger in 1909 (https://djalil.chafai.net/blog/2020/01/22/about-the-hellinger-distance/), further reinforced the reliability of imputed genotypes.
Genome-wide association study
The best-performing reference panel was identified through simulation studies and used to impute the study dataset for subsequent GWAS analysis. Post-imputation QC measures, as outlined in the Genotype imputation and creation of customized reference panels section, were applied to the imputed dataset. Principal component analysis (PCA) was performed to address potential population stratification. Only SNPs with an INFO score > 0.4 were included in the GWAS.
GWAS was conducted using an adjusted logistic regression model, incorporating age, sex and the first 20 principal components (PCs), which together explained over 99% of the variation, as covariates. Genome-wide significance was defined as a P-value < 5e-08, while suggestive significance was set at a P-value < 1e-05.
To assess potential inflation of test statistics due to polygenicity, the LD Score regression (LDSR) intercept was calculated using the LD Score regression (LDSC) 26 tool with the GWAS summary statistics derived from the imputed study dataset. This ensured accurate interpretation of GWAS findings and adjustment for any confounding inflation.
Heritability estimation
SNP-based heritability (h2SNP) was estimated for all SNPs, common SNPs (MAF > 0.05), and less-common SNPs (0.01 < MAF < 0.05) using the generalized restricted maximum likelihood (GREML) approach implemented in Genome-wide Complex Trait Analysis (GCTA). 27 Analyses were conducted on three subsets derived from the imputed study dataset (study dataset imputed with the best-performing reference panel), extracted using PLINK v1.9: All imputed SNPs; SNPs located at ±500 KB around GWAS-identified BrS-associated regions; SNPs outside ±1 MB of GWAS-identified BrS-associated regions (to explore potential ‘missing’ heritability). Heritability, defined as the proportion of phenotypic variation attributable to genetic variance, was estimated by constructing genetic relationship matrices (GRMs) for each subset.27,28 GRMs were computed separately for all SNPs, common SNPs, and less-common SNPs using imputed dosage scores, excluding SNPs with MAF < 0.001 or INFO score < 0.4. The analyses were adjusted for the first 20 PCs, age, and sex to account for population structure.28,29
To address ascertainment bias, the disease prevalence of BrS was set at 0.0012, based on Southeast Asian ancestry populations. 4 GCTA transformed heritability estimates from the observed scale to the underlying liability scale to ensure robustness. The heritability estimates were compared across the three data subsets: (i) all SNPs; (ii) SNPs within GWAS-identified regions; (iii) SNPs outside GWAS-identified regions (to investigate ‘hidden’ heritability). These analyses provided insights into the contribution of genetic variation to BrS, including common and less-common variants, and highlighted potentially unexplored heritability beyond GWAS-identified loci.
Functional mapping of genetic variants
Functional Mapping and Annotation of Genome-Wide Association Studies (FUMA GWAS) 30 was employed to perform functional analysis of significant GWAS findings by mapping and annotating the imputed study dataset. FUMA identified risk loci from lead SNPs (P-value ⩽ 5e-08; r2 < 0.6) and merged LD blocks if separated by less than 250 kb, based on standard LD threshold parameters.
Gene-level and gene-set association analyses were conducted using Multi-marker Analysis of Genomic Annotation (MAGMA). 31 For gene-level analysis, GWAS SNPs were mapped to protein-coding genes, and P-values were calculated. For gene-set analysis, MAGMA evaluated curated gene sets, canonical pathways, and Gene Ontology (GO) terms obtained from MsigDB v5.2. 32 P-values for gene-set associations were computed to identify functional pathways potentially involved in BrS. To correct for multiple testing, FUMA applied Bonferroni correction for gene-level analysis and the false discovery rate (FDR) for gene-set analysis. Linkage disequilibrium (LD) between SNPs and genes was calculated using the 1KG-EAS Phase 3 reference genome. Additional functional relevance of the lead SNPs based on their overlap with regulatory genomic regions and chromatin contact domains were assessed using SNPnexus (ENCODE)33-35 and Roadmap Epigenomics Project. 36 This comprehensive annotation and mapping approach provided biologically meaningful insights into the functional relevance of BrS-associated genetic variants.
Conditional rare-variant association test (RVAT) analysis
Rare-variant association tests (RVATs) were conducted on the imputed study dataset using the sequence kernel association test (SKAT) software. 37 SKAT is a computationally efficient regression method designed to test the association between a SNP set (e.g. gene or genetic region) and a continuous or dichotomous phenotype. First, rare genetic variants were identified within 500 kb upstream and downstream of each significant risk locus identified via GWAS, forming RVAT regions centred on these loci. Variants were then annotated and grouped into genes using the Genome Reference Consortium Human Build 37 (GRCh37/hg19) within the ANNOVAR software package. 38 The annotated data were indexed and formatted to meet SKAT input requirements. RVAT analyses were performed for each region using SKAT in R. Analyses were restricted to rare variants (MAF < 0.01) within each RVAT region and conditioned on the corresponding risk loci. Covariates included the first 20 PCs, age, sex, and dosage information from the risk loci, as depicted in Supplementary Figure S1. SKAT calculated P-values for associations between gene groups and BrS. Multiple testing was addressed by applying Bonferroni correction, and genes with significant adjusted P-values were identified as potential contributors to BrS pathogenesis. This approach enabled the identification of genes harbouring rare variants that may contribute to the genetic architecture of BrS.
Expression quantity trait loci (eQTL) analysis
Expression quantitative trait locus (eQTL) data for the heart left ventricle were obtained from the GTEx portal (https://www.gtexportal.org/home/). The S-PrediXcan tool 39 employed to assess associations between predicted gene expression and the phenotype, utilizing genome-wide significant SNP summary statistics. The eQTL dataset provided the weights for predicting gene expression, the covariances of SNPs included in the prediction models, and GWAS coefficients for each SNP. S-PrediXcan is particularly advantageous as it eliminates the need for individual-level data, significantly reducing computational demands while enabling the analysis of large-scale meta-analytic datasets.
CNV association analysis
The raw CEL files containing intensity data from SNP genotyping of the study dataset were used for CNV calling. Structural variants, including CNVs, are hypothesized to contribute to the ‘missing heritability’ of complex diseases, prompting their inclusion in association analyses.
Genotype calling was performed using Affymetrix Power Tools (APT), a specialized suite for processing and analysing data from GeneChip® arrays (Affymetrix Power Tools). Parameters optimized for the TWB Axiom array were applied. Initial QC excluded samples with an average SNP call rate below 93%. CNV calling was conducted using the PennCNV-Affy pipeline, 40 with measures to reduce false positives by excluding CNVs with low SNP density. Individual-level QC criteria included a standard deviation of the log R ratio (LRR_SD) below 0.35 and fewer than 50 CNVs per individual. Call-level QC ensured each CNV contained at least 10 SNPs and spanned less than 50 kb. Deletions or duplications were considered valid if they were at least 100 kb in length and included at least 10 consecutive SNPs. Finally, the CNV region association analysis was performed using ParseCNV, 41 enabling robust evaluation of CNV contributions to BrS risk.
Results
Data characteristics
A total of 214 patients diagnosed with Brugada syndrome (BrS) were included in this study. The mean age was 40.8 ± 16.8 years, with 86.4% being male. At presentation, 14.4% were asymptomatic, 6.0% reported palpitations, 28.9% experienced syncope, and 21.4% had a history of sudden cardiac death (SCD). A spontaneous type 1 Brugada ECG pattern was present in 69.6% of patients, and the average QRS duration was 107 ± 18.3 ms. A family history of SCD was reported in 14.9%. Electrophysiological studies were performed in 54.2% of patients, with inducible VT/VF in 24.1% of those tested. The overall data characteristics are presented in Table 1. The prevalence of SCN5A mutations, the major gene associated with BrS, in this cohort was 16%.
Clinical and demographic characteristics of Brugada Syndrome patients.

After applying standard QC procedures (detailed in the Methods section), the base dataset included 96 BrS samples with 645 940 SNPs, as shown in Supplementary Figure S2.
For the genetic analysis, the study dataset initially consisted of 221 BrS cases and 5000 controls as separate datasets. After applying pre-imputation QC, as detailed in the Quality control: raw data section and presented in Figure 1, the case and control datasets were harmonized with an in-house clinical reference; and then merged using PLINK 1.9. Sample- and variant-level QC were further performed on the merged dataset, resulting in a final dataset of 1530 samples (214 cases and 1316 controls) and 485 325 high-quality SNPs for analysis. This two-step QC approach before and after merging is commonly used in GWAS to maintain variant quality within each dataset and in the combined dataset. 42
Simulation study shows imputation with the Merged-TWN-panel yields the most accurate imputed genotypes
To evaluate and compare the imputation quality and performance of three reference panels: 1KG-EAS, Merged-TWN-panel, and Improved-TWN-panel; 50% of common SNPs (MAF > 0.05), less-common SNPs (0.01 < MAF < 0.05), and rare SNPs (MAF < 0.01) were randomly selected from each autosome and masked from the study dataset. These masked SNPs were then imputed using each reference panel. As panel performance was consistent across chromosomes, we present detailed results for chromosomes 1, 12, and 22 as representative large/medium/small autosomes, respectively, a reporting approach commonly used for imputation benchmarking.23,43
Figure 2 shows that the comparison of the proportion of imputed SNPs showed similar results for 1KG-EAS (98.55%) and Improved-TWN-panel (98.55%), while the Merged-TWN-panel achieved a substantially higher proportion (99.99%) across all SNP categories.

Simulation study: comparing proportions of imputed SNPs after masking across the three reference panels. (A) No. of masked and imputed common SNPs (MAF > 0.05) from chromosome 1, (B) no. of masked and imputed common SNPs (MAF > 0.05) from chromosome 12, (C) no. of masked and imputed common SNPs from chromosome 22, (D) no. of masked and imputed less-common SNPs from chromosome 1, (E) no. of masked and imputed less-common SNPs from chromosome 12, (F) no. of masked and imputed less-common SNPs from chromosome 22, (G) no. of masked and imputed rare SNPs from chromosome 1, (H) no. of masked and imputed rare SNPs from chromosome 12, and (I) no. of masked and imputed rare SNPs from chromosome 22.
Figure 3 presents the panel-specific strengths based on INFO scores and Hellinger scores. The Improved-TWN-panel resulted in the highest proportion of imputed less-common (88.48%) and rare SNPs (69.10%) passing the INFO score threshold (INFO > 0.4). The Merged-TWN-panel performed better for common SNPs (99.57%). In contrast, the 1KG-EAS panel showed the lowest proportion of SNPs passing the INFO score threshold across all categories (common: 89.16%; less-common: 52.52%; rare: 48.66%).

Simulation study: quality comparison using INFO score across the three reference panels. (A) No. of imputed common SNPs with INFO > 0.4 for chromosomes 1, 12, and 22; (B) no. of imputed less-common SNPs with INFO > 0.4 for chromosomes 1, 12, and 22; (C) no. of imputed rare SNPs with INFO > 0.4 for chromosomes 1, 12, and 22.
Hellinger score analysis (Hellinger > 0.6) showed that the 1KG-EAS panel had the highest proportion of accurately imputed SNPs (common: 31.26%; less-common: 11.51%; rare: 23.63%). The Merged-TWN-panel achieved slightly lower accuracy (common: 28.02%; less-common: 10.91%; rare: 21.95%), while the Improved-TWN-panel had the fewest accurately imputed SNPs (common: 26.85%; less-common: 3.18%; rare: 10.62%) as shown in Figure 4.

Simulation study: quality comparison using Hellinger score (HS) across the three reference panels. (A) No. of imputed common SNPs with HS > 0.6 for chromosomes 1, 12, and 22; (B) no. of imputed less-common SNPs with HS > 0.6 for chromosomes 1, 12, and 22; (C) no. of imputed rare SNPs with HS > 0.6 for chromosomes 1, 12, and 22.
Overall, based on the number of imputed SNPs passing QC thresholds, the Merged-TWN-panel emerged as the most effective reference panel.
Discovery of genetic loci associated with BrS and heritability estimation
Based on the simulation study results, the study dataset imputed with the Merged-TWN-panel (referred to as the imputed study dataset) was selected for GWAS and heritability analyses. GWAS was conducted using logistic regression with the top 20 principal components (PCs), age, and sex as covariates. The cumulative variance and the individual genetic variation captured by each PC are illustrated in Supplementary Figure S3, and a scatter plot of PC1 and PC2 is shown in Supplementary Figure S4.
GWAS identified four association signals (defined by lead SNPs, r2 < 0.6) at three risk loci achieving genome-wide statistical significance (P < 5e-08), as shown in Table 2 and Figure 5A: Chromosome 3 locus: One signal (rs7617547, OR = 2.199, P = 3.7e-08, MAF = 0.1859) mapped to the SCN10A gene, which encodes the sodium channel isoform Nav1.8. Although this SNP had not been previously associated with BrS, SCN10A itself had been implicated in BrS in earlier studies;9,11,44,45 Chromosome 6 locus: One signal (rs76107757, OR = 9.845, P = 6.8e-11, MAF = 0.0205) mapped to the ZNF451 gene, which encodes the zinc finger protein 451. This gene had not been associated with BrS before but had been linked to atrial fibrillation; 46 Chromosome 12 locus: Two signals (rs79266279, OR = 4.651, P = 8.4e-09, MAF = 0.0323; and rs12427133, OR = 3.091, P = 1.61e-08, MAF = 0.0650) mapped to the RP11-510I5 gene.
Genome-wide significant SNPs from Merged-TWN-panel – imputed study dataset.


Results from GWAS on Merged-TWN-panel imputed study dataset. (A) Manhattan plot. (B) Quantile-Quantile plot.
To assess the extent of genomic inflation and potential confounding factors, we first examined the genomic inflation factor (λ), which was 0.9691, indicating minimal deviation from the expected distribution of test statistics as shown in Figure 5B. The genomic control lambda (λGC) was 1.0225, further suggesting negligible inflation at the genome-wide level. Importantly, LDSR analysis yielded an intercept of 0.9959 (SE = 0.0055), supporting the interpretation that the observed inflation was predominantly due to polygenicity rather than uncorrected population stratification, cryptic relatedness, or technical artefacts. Together, these metrics confirm the overall robustness of the association results and the adequacy of QC measures applied.
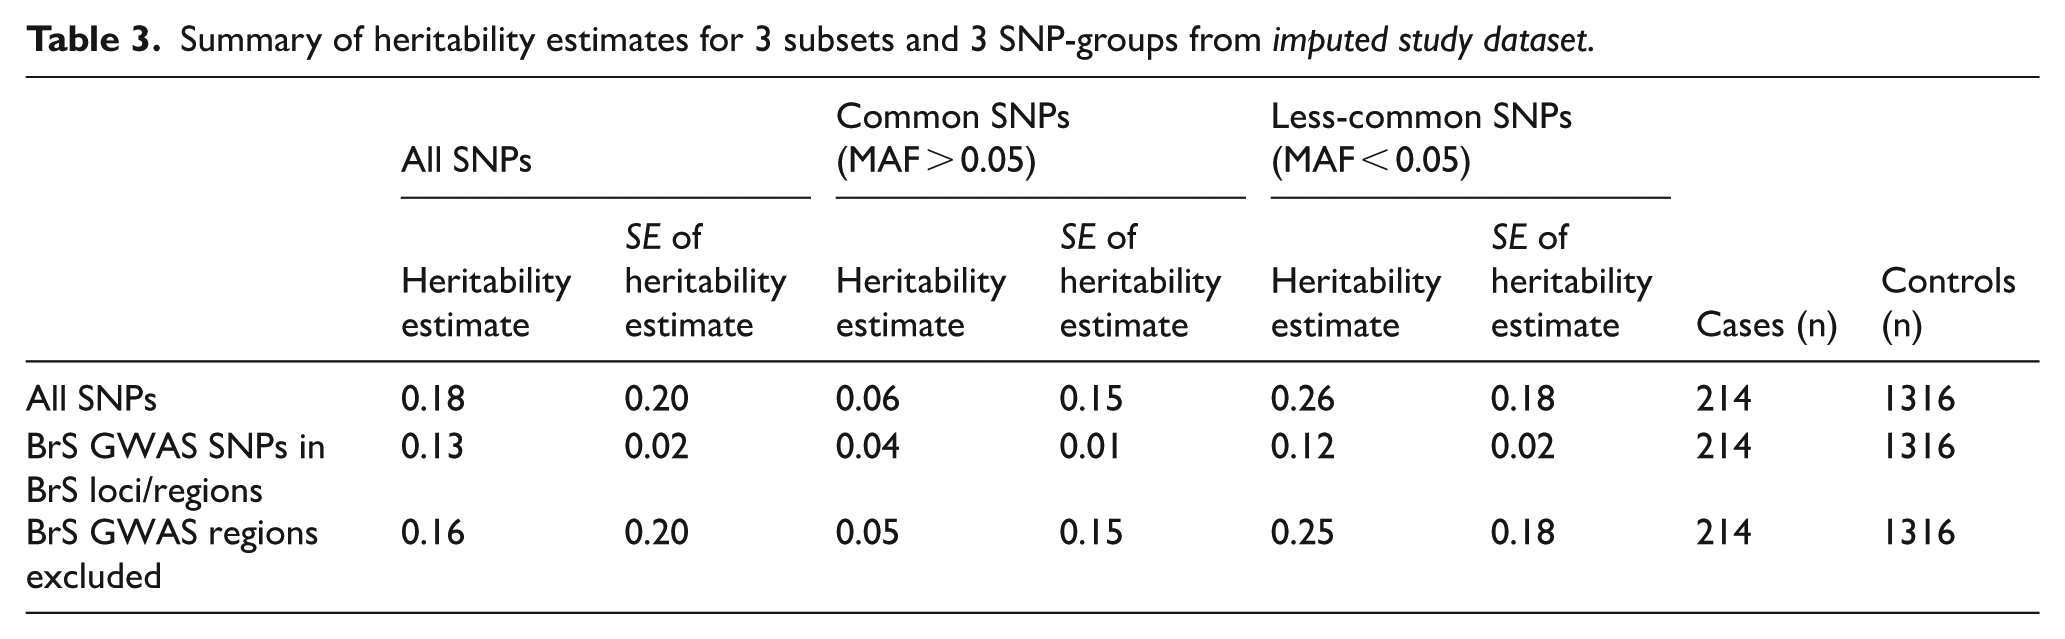
SNP-based heritability (h²SNP) was estimated using GCTA, stratified by MAF and genomic regions of interest. The results are summarized in Table 3. Across all SNPs, the total SNP-heritability was estimated at 0.18 (SE = 0.20). When stratified by allele frequency, less-common variants (MAF < 0.05) contributed more substantially to heritability (0.26, SE = 0.18) compared to common variants (MAF > 0.05), which explained a smaller proportion (0.06, SE = 0.15). SNPs located in the 3 GWAS-risk loci regions accounted for 0.13 (SE = 0.02) of the phenotypic variance, with less-common variants again contributing more (0.12, SE = 0.02) than common variants (0.04, SE = 0.01). These estimates were more precise, as indicated by lower standard errors, suggesting a robust contribution of the genome-wide significant BrS loci, particularly less-common variants to disease heritability. Excluding these GWAS regions, the remaining genome still explained a heritability of 0.16 (SE = 0.20), with less-common SNPs (0.25, SE = 0.18) again contributing more than common ones (0.05, SE = 0.15). This suggested that a substantial proportion of ‘missing’ or potentially hidden heritability still remained undetected by GWAS.
Summary of heritability estimates for 3 subsets and 3 SNP-groups from imputed study dataset.
Functional analysis and annotation of significant SNPs
Nine candidate SNPs (in linkage disequilibrium with one of the lead SNPs) were identified using FUMA; listed in Supplementary Table S1. Among these, the majority (66.7%) were classified as ncRNA-intronic variants, while the remaining 33.3% were categorized as intronic variants as depicted in Supplementary Figure S5. These SNPs were mapped to three genes located within 10 kb of the candidate SNPs: SCN10A, ZNF451, and NEDD1 as shown in Supplementary Table S2. Supplementary Table S3 lists the four significant eQTLs identified by FUMA at a false discovery rate (FDR) threshold of q < 0.05, where the genes in the SNP-gene pairs corresponded to the same genome-wide significant loci. In addition, Supplementary Figure S6 shows that the MAGMA gene-based association test highlighted SCN10A as genome-wide significant for BrS.
SNPnexus (ENCODE)33-35 and the Roadmap Epigenomics Project
36
were utilized for retrieveing additional context regarding the potential regulatory roles of the 4 lead SNPs. rs7617547 is located in a promoter-flanking region and exhibits tissue-specific chromatin activity. It was reported
Overall, these annotations indicated that the lead SNPs are located in regions with tissue-specific regulatory potential, with rs7617547 showing particularly strong evidence for functional activity in cardiac tissues. These findings provide functional context and can guide future experimental validation.
RVAT reveals three significant genes associated with BrS
Rare-Variant Association Testing (RVAT) was performed by focusing on rare variants (MAF < 0.01) and conditioning on the three genome-wide significant risk loci identified in the GWAS. The analysis revealed that CDK17, CFAP54, and ZNF451-AS1 were significantly associated with Brugada syndrome (BrS) (Supplementary Table S4). CDK17 (P-value = 4.56e-10) contained 151 rare SNPs, CFAP54 (P-value = 7.83e-08) had 243 rare SNPs, both located on chromosome 12, and ZNF451-AS1 (P-value = 8.3e-04) comprised 38 rare SNPs. All identified variants were intronic or non-coding intronic, with no prior associations with BrS reported in the GWAS Catalogue. The significant association signal at ZNF451-AS1 revealed a complementary signal at the ZNF451 locus, consistent with the findings from the GWAS. CDK17 has been previously linked to carotid artery intima-media thickness 47 and diastolic blood pressure. 48 CFAP54 has been implicated in male infertility,49,50 which is itself associated with an increased risk of cardiovascular diseases. 51 In addition, a recent study found that ZNF451-AS1, an RNA gene, is significantly downregulated in tumour tissues of patients with head and neck squamous cell carcinoma. 52
eQTL analysis didn’t predict associations with BrS
eQTL analysis was conducted using MetaXcan with GWAS summary statistics from the non-imputed study dataset. No significant eQTLs were identified at a threshold of P < 0.05.
CNV association analysis predicts seven deletions and one duplication region significantly associated with BrS
A total of 8901 CNVs were identified from 1530 samples using PennCNV, meeting the QC criteria. The CNV association analysis performed using ParseCNV revealed seven case-enriched deletion regions that were significant, with P-values below the Bonferroni-corrected threshold (P < 5e-04), and these were mapped to 19 genes. In addition, one significant case-enriched duplication region was identified, mapping to a single gene, as shown in Supplementary Table S5. The most significant case-enriched deletion region (chr16:1768782-1792146), associated with genes EME2, IGFALS, MAPK8IP3, MRPS34, NME3, NUBP2, and SPSB3 (P = 3.05e-06), had no prior reported association with BrS; however, MAPK8IP3 has been previously linked to coronary artery disease. 53 The significant case-enriched duplication region (chr11:534197-535098), mapped to the HRAS gene (P = 5.05e-07), has not been reported in previous studies on BrS.
Discussion
This study provides new insights into the genetic architecture of Brugada Syndrome (BrS), a rare and genetically heterogeneous cardiac arrhythmia. Using a comprehensive bioinformatics approach, we aimed to uncover novel variants – particularly low-frequency and rare variants – that may serve as potential biomarkers for early risk detection in the Taiwanese population. By implementing a customized reference panel (Merged-TWN-panel) for genotype imputation, we enhanced variant resolution and successfully identified several associations beyond the well-established SCN5A and SCN10A loci. Notably, SCN5A, although previously recognized in BrS studies, was identified in this study at a suggestive significance level (MAFs > 0.15, P < 1e-05) as shown in Supplementary Table S6. This finding is consistent with prior findings on the role of rare SCN5A variants as major causal contributors and common variants as modest, population-dependent modifiers. 54 Previous studies have reported a low penetrance of SCN5A in families with SCN5A mutations and, in some cases, affected individuals without familial mutation, underscoring its complex genetic architecture.55,56 A study on Taiwanese patients validated only one-fourth of the previously reported common variants (MAF > 0.05).4,11,44,57
Our GWAS identified four genome-wide significant loci, including rs7617547 at SCN10A, which has been consistently implicated in BrS across multiple studies.9,11,44,45 Notably, rs76107757, located within ZNF451, emerged as a novel genome-wide significant hit, despite lacking additional SNPs in strong LD. It demonstrates consistency in terms of low MAF (0.02) and the known tendency of rare variants to exhibit sparse LD58-60 and therefore, replication in independent cohorts is required to confirm this association. rs76107757 was previously found to be associated with atrial fibrillation and promyelocyic leukaemia.46,61 ZNF451 encodes a zinc finger protein involved in the SUMOylation pathway, 61 a post-translational modification process known to affect numerous cardiovascular phenotypes including arrhythmias, atherosclerosis, and cardiac hypertrophy. 62 Complementing this, rare-variant analysis using SKAT identified ZNF451-AS1, a long non-coding RNA transcribed antisense to ZNF451. While the two genes are distinct, their genomic proximity and potential regulatory relationship suggest that both common and rare variants at the ZNF451 locus may influence BrS susceptibility. This convergence of association signals from GWAS and RVAT reinforces the significance of this locus and highlights the importance of exploring both coding and non-coding genomic elements in rare disease genetics.
Beyond ZNF451, functional prioritization identified SCN10A, ZNF451, and NEDD1 as candidate genes of interest. Although NEDD1 has not previously been linked to BrS, its known involvement in neurovascular conditions63,64 suggests a possible broader biological role. Our CNV analysis further identified eight genomic regions significantly associated with BrS, encompassing genes such as FGFR3, EME2, and MRPS34. FGFR3 was found to be involved in FGF23-mediated cardiac remodelling 65 and deletions in EME2, for instance, have been linked to sudden infant death syndrome (SIDS), 66 a condition for which BrS is a known monogenic contributor. 67 MRPS34 was found to be involved in alterations in fractional shortenings of the heart when mutated. 68 These overlapped findings highlight possible shared genetic mechanisms across related cardiac syndromes.
Limitations
Despite these promising findings, we recognize a few limitations. First, the lack of replication in an independent cohort remains a key constraint. Due to the rarity of BrS and limited availability of East Asian datasets with detailed phenotype and genotype information, replication was not feasible in this study. We therefore present our results as hypothesis-generating, with future validation through multi-centre studies across East Asian populations being a critical next step. Second, while the Merged-TWN-panel improved imputation performance in this Taiwanese cohort, its modest sample size may have reduced power to detect very rare variants (MAF < 0.001). Third, our exploratory case-case Fisher’s exact test showed no significant variants, as shown in Supplementary Table S7; underscoring the need for larger cohorts to explore potential subgroup-specific genetic signatures. Finally, our eQTL analysis did not yield significant findings, likely due to the underrepresentation of Asian ancestry populations in transcriptomic resources such as GTEx. In addition, no prior reported associations were found linking our lead SNPs to gene expression levels in cardiac tissues in public databases. This underscores the need for population-specific reference transcriptomes to better interpret non-coding and regulatory variation in underrepresented populations.
Conclusion
In summary, this study applied an integrative genomic approach to identify both known and novel loci potentially involved in BrS susceptibility in the Taiwanese population. The identification of ZNF451 and ZNF451-AS1 as a convergent locus for both common and rare variants is particularly compelling and may represent a previously unrecognized contributor to BrS pathophysiology. These findings pave the way for future research into functional mechanisms and clinical translation, with the ultimate goal of enabling earlier risk prediction and improved outcomes for individuals at risk of sudden cardiac death.
Supplemental Material
sj-doc-1-bbi-10.1177_11779322251385926 – Supplemental material for Integrated Genomic Approaches to Elucidate the Genetic Basis of Brugada Syndrome in Taiwanese Patients
Supplemental material, sj-doc-1-bbi-10.1177_11779322251385926 for Integrated Genomic Approaches to Elucidate the Genetic Basis of Brugada Syndrome in Taiwanese Patients by Chayanika Goswami, Jyh-Ming Jimmy Juang, Tzu-Pin Lu, Jinn-Moon Yang, Amrita Chattopadhyay and Eric Y Chuang in Bioinformatics and Biology Insights
Supplemental Material
sj-docx-2-bbi-10.1177_11779322251385926 – Supplemental material for Integrated Genomic Approaches to Elucidate the Genetic Basis of Brugada Syndrome in Taiwanese Patients
Supplemental material, sj-docx-2-bbi-10.1177_11779322251385926 for Integrated Genomic Approaches to Elucidate the Genetic Basis of Brugada Syndrome in Taiwanese Patients by Chayanika Goswami, Jyh-Ming Jimmy Juang, Tzu-Pin Lu, Jinn-Moon Yang, Amrita Chattopadhyay and Eric Y Chuang in Bioinformatics and Biology Insights
Footnotes
Acknowledgements
We thank Dr. Melissa Stauffer of Scientific Editing Solutions for English editing our manuscript.
Ethical Considerations
This study was approved by the ethics committee of National Taiwan University Hospital Review Board with IRB # 201305043RINB.
Consent to Participate
All patients provided informed consent.
Author Contributions
Funding
The authors disclosed receipt of the following financial support for the research, authorship, and/or publication of this article: Financial support for this research was provided partially through the grants from Taiwan Health Foundation, and MOST108-2314-B-002-007 from the Ministry of Science and Technology, 112-2314-B-002-293, 111-2314-B-002-005 and 114-2314-B-002-056 from National Science and Technology Council, 114KKZA3T1 from Development Center for Medical Devices, National Taiwan University and from the Higher Education Sprout Project of the Ministry of Education (MOE) in Taiwan, with funding administered through National Taiwan University (grant number 114L910303).
Declaration of Conflicting Interests
The authors declared no potential conflicts of interest with respect to the research, authorship, and/or publication of this article.
Data Availability Statement
All relevant data are within the manuscript and its supporting information file.
Supplemental Material
Supplemental material for this article is available online.
References
Supplementary Material
Please find the following supplemental material available below.
For Open Access articles published under a Creative Commons License, all supplemental material carries the same license as the article it is associated with.
For non-Open Access articles published, all supplemental material carries a non-exclusive license, and permission requests for re-use of supplemental material or any part of supplemental material shall be sent directly to the copyright owner as specified in the copyright notice associated with the article.