
Abstract
A crucial role for both insulin and mTOR in the regulation of milk protein synthesis is emerging. Bovine mammary biopsies harvested during late-pregnancy through end of subsequent lactation were used to evaluate via quantitative PCR the expression of 44 genes involved in pathways of insulin, mTOR, AMPK, and Jak2-Stat5 signalling and also glucose and amino acid (AA) transporters. We observed an increased expression during lactation of ELF5, AA and glucose transporters, insulin signaling pathway components, MAPK14, FRAP1, EIF4EBP2, GSK3A and TSC1 among mTOR signaling-related genes. Among ribosomal components RPL22 was down-regulated. The overall data support a central role of AA and glucose transporters and insulin signaling through mTOR for the regulation of protein synthesis in bovine mammary gland. Furthermore, the existence of translational competition favoring the translation of milk protein transcripts was inferred from the combined dataset.
Introduction
Main constituents of bovine milk are lactose, protein, and fat. Among those, fat appears to be the most affected by diet while the former are mostly determined by genetic background with only few dietary factors known to affect their production.1,2 The regulation of milk fat synthesis in bovine mammary has received great attention in the last three decades. 1 Regulation of protein and lactose synthesis in mammary gland has received less attention; however, it is well-established that protein synthesis, and indirectly also lactose synthesis, is under hormonal control. 3 In particular prolactin, growth hormone, thyroid hormone, and corticosteroids appear to have a direct role in milk synthesis, while it was suggested that insulin has only an indirect role. 3 Blood insulin in bovine decreases dramatically after parturition and remains low for the first two months of lactation. 4 Despite the decrease of insulinaemia a role of this hormone in synthesis of main milk constituents, particularly protein and lactose, in bovine mammary was revealed more than 40 years ago. 5 Recent work demonstrated a pivotal role of insulin in regulating milk protein synthesis both in cow and mouse.6,7
The main regulator of milk protein expression in non-ruminant mammary gland appears to be the JakStat signaling pathway.8,9 However, the regulation of protein synthesis, particularly translation, in all tissues of mammals appears to be under control of the mTOR pathway. 10 Recent work in rodents and ruminants has highlighted a role of mTOR in regulation of milk protein synthesis.11–15 The activity of mTOR also appears to be modulated by branched-chain amino acids (AA), in particular Leu. 16 A direct stimulatory role of Leu (and other AA) on milk protein synthesis has been demonstrated in murine and bovine mammary epithelial cells, with a stronger sensitivity observed in bovine cells. 15 The availability of AA in mammary gland is not only important for regulation of translation but the transport rate of AA appears to be one of the major limitations for milk protein synthesis.17–21 Besides AA the availability of glucose also is crucial for the synthesis of the other main milk constituents. 17 In dairy cows the availability of glucose for mammary epithelial cells is determined by the rate of import via glucose transporters. 19
The regulation of protein synthesis requires a strong interplay between all the above elements, ie, AA import/availability, insulin, glucose import/availability, and mTOR signaling.20,21 This network of elements, which singularly has been shown to play a role in milk synthesis and particularly in milk protein synthesis, can be crucial during the onset and throughout established lactation in high-producing dairy cattle. A depiction of this network in bovine mammary and potential interplay is reported in Figure 1.
In order to evaluate the role of such network we have used bovine mammary tissue biopsied during pregnancy and lactation to examine the expression of 44 genes with key roles in mTOR signaling, insulin signaling, AA transport, glucose transport, Jak2-Stat5 signaling, and the protein synthesis machinery (ie, beside ribosomal proteins, genes coding for main proteins involved in initiation and elongation).
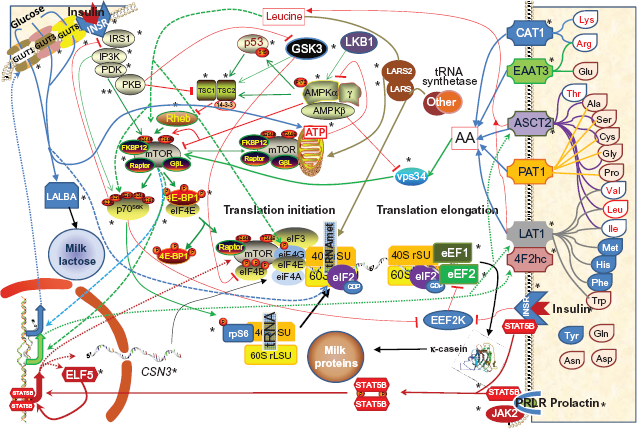
Model of the networks of factors (genes product, hormones, and metabolites) potentially involved in the regulation of milk protein synthesis in lactating bovine mammary tissue. The network includes the transport of AA and glucose, insulin signaling and activation of protein synthesis through mTOR (mTORC1) pathway, the activation of mTOR pathway by Leu and vps34, the mTOR inhibition through the tuberous sclerosis (TSc), GSK3A, TP53, and AMPK signaling. Non-essential AA are filled with pink, essential AA (EAA) of group I (EAA where the mammary up-take approximates the output in milk protein) are filled in light blue, while EAA of group II (the mammary up-take is in large excess compared to the milk protein output) are filled in white with red font.18,39,7778 The detailed description of the network is reported in Additional file 1. Not reported in the model is the function of MAPK signaling in protein synthesis. 63 Not depicted is also the role of GH and IGF1 on milk protein synthesis regulation through mTOR.52,54
Materials and Methods
Animals, Sampling, and Diet
Six Holstein dairy cows of high genetic merit were used (see S. Table 1 in Additional file 1). Details of the experimental design and biopsy procedure were reported previously. 22 Briefly, percutaneous biopsies from each of 6 cows were obtained from the right or left rear quarter of the mammary gland at –15 (–13 ± 3), 1, 15, 30, 60, 120, and 240 d relative to parturition. All procedures were conducted under protocols approved by the University of Illinois Institutional Animal Care and Use Committee.
Gene symbol, description, and mRNA abundance relative to UXT for the 44 genes measured; genes are clustered based on main functions relative to mammary protein synthesis. The name of the proteins was used for the generation of Figure 1. Among the AAT SLC1A1 codes for EAAT3, SLC3A2 codes for 4F2hc, SLC7A5 codes for LAT1, SLC1A5 codes for ASCT2, SLC7A1 codes for CAT1, and SLC36A1 codes for PAT1 (see Additional file 2 for detailed description of the AAT). Among glucose transporters SLC2A isoforms encode for GLUT proteins. Other protein names used in Figure 1 are: AKT1, AKT3 are part of the PKB/AKT system, FRAP1 encode for mTOR, PIK3C3 encodes for vps34, PRKAA2 and PRKAB1 encode for AMPKα and β, and STK11 for LKB1.
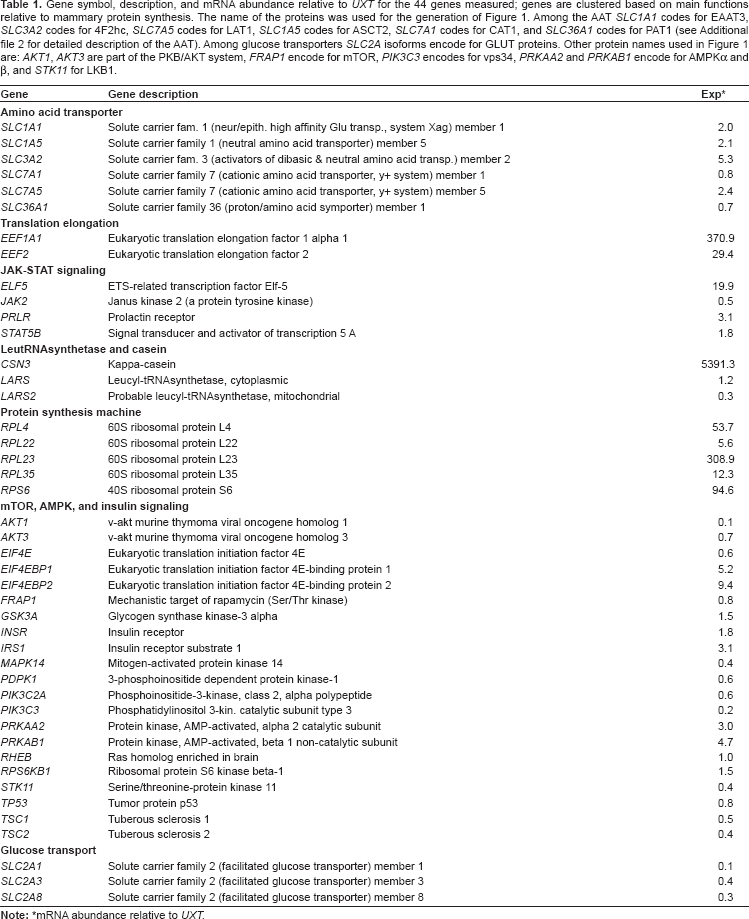
mRNA abundance relative to UXT.
RNA Extraction, PCR, and Design and Evaluation of Primers
These procedures were performed as previously described. 23 Briefly, qPCR analysis was performed using SYBR Green (ABI) with a 6 point standard curve. Relative quantification of Ct data was calculated using the standard curve. qPCR data were normalized using expression of UXT, RPS9, and RPS15. 22 Specific details about the procedures are reported in the Additional file 1. A comprehensive literature search was conducted to select genes with key roles in the proposed networks (Fig. 1). Primers features, amplicon sequencing, and qPCR performance are available in S. Tables 2–5 in Additional file 1. Description of genes measured clustered in main function related to protein synthesis is presented in Table 1. Expression of genes was measured for all time points or only for –15, 15, 60, and 240 d relative to parturition.
qPCR Data Processing
PCR-normalized data are presented as log2 n-fold change relative to –15 d. To estimate standard errors at –15 d, and prevent biases in statistical analysis, normalized data were transformed to obtain a perfect average of 1.0 at –15 d, leaving the proportional difference between the biological replicates. The same proportional change was calculated at all other time points to obtain a fold change relative to –15 d. The data were log2 transformed before statistical analysis.
mRNA Abundance of Measured Transcripts Relative to UXT
Efficiency of PCR amplification for each gene was calculated using the standard curve method (E = 10–1/-log curve slope) (Additional file 1, S. Table 5). mRNA abundance of measured genes was calculated as previously reported, 24 using the inverse of PCR efficiency raised to ΔCt (gene abundance = 1/EΔCt, where ΔCt = Ct sample—geometric mean Ct of 3 internal control genes). mRNA abundance relative to UXT for each transcript measured was calculated using the ratio of median ΔCt of the gene/median ΔCt of UXT. The UXT transcript is a gene with a medium-low expression in bovine mammary—Ct ca. 23.8 (see Ct values in S. Table 5 in Additional file 1). Use of this approach for estimating relative mRNA abundance among genes was necessary because relative mRNA quantification was performed using a standard curve, which precluded a direct comparison among genes. Together, use of Ct values corrected for the efficiency of amplification plus internal control genes as baseline overcome this limitation. Description of genes measured and overall relative mRNA abundance relative to UXT are reported in Table 1.
Milk Yield and Milk Composition
Milk yield for the cows used in the present experiment has been published previously. 23 Milk protein and lactose were analyzed by infrared analysis with a four-channel spectrophotometer (Multispec, Foss Food Technology Corp., Eden Prairie, MN) at the Virginia Dairy Herd Improvement Association laboratory and are presented as % and daily yield (kg/day) (Fig 2).
Plasma Insulin and Prolactin
Milk Yield and Milk Composition
Prolactin and insulin concentrations in blood in dairy cows during the transition from pregnancy to lactation and during the whole lactation have been measured previously by several authors (eg,).25,26 The pattern of plasma insulin is characterized by a higher concentration at dry-off and a consistent decrease until the first two weeks post-partum with a gradual and consistent increase until the end of lactation.25,26 Similarly, prolactin concentration is very high at the onset of lactation with a sharp decrease thereafter and a gradual increase until ca. 200 days postpartum followed by another decrease. To verify the behavior of those hormones during the transition period we measured them in 4 randomly selected cows out of the 6 used (Fig 3). The method to determine plasma prolactin and insulin was as previously described.27,28
Statistical Analysis
qPCR, plasma insulin and prolactin, and milk lactose and protein were analyzed using a MIXED model with repeated measures in SAS (SAS Inst. Inc. Cary, NC, release 8.0) to evaluate the effect of time relative to parturition. Compound symmetry was used as covariate structure for repeated measures analysis. The model included the fixed effect of time (–15, 1, 15, 30, 60, 120, and 240 d) and the random effect of cow. The data are discussed if an overall time effect was with P < 0.05. Significance for comparison between time points was declared at P <0.05. qPCR data are presented as log2 transformed relative to –15 d.
Results and Discussion
The mammary gland of high genetic merit Holstein cows, as the ones used in this experiment (S. Table 1 in Additional file 1), is able to secrete up to or more than 1 kg of milk protein per day during the entire lactation (Fig. 1) which translates to more than 300 kg of protein secreted during a lactation cycle. Mammary protein synthesis rate is markedly greater in lactating than non-lactating ruminants.12,29,30 Protein synthesis is a highly-active and energetically-costly process, and in ruminant mammary only a minor portion of the synthetic machinery appears to be used for production of milk proteins 30 (See Additional file 2 for a brief overview).
An increase in the efficiency of milk protein synthesis is a highly desirable goal for the dairy industry. In the present manuscript we have measured the expression of several genes coding for proteins involved in AA and glucose uptake, Jak2-Stat5 signaling, and mTOR and insulin signaling during an entire lactation. Changes in the expression of genes have to be considered a medium-to-long term adaptation of the tissue to a new physiological state. This is important to highlight because most of the signaling pathways considered in the present manuscript are regulated by phosphorylation, ie, acutely and as such has to be considered a short-to-medium term adaptation. Together, the aggregation of phosphorylation data from published studies with the longitudinal pattern of expression of the genes encoding those proteins can provide a more complete picture of the tissue's adaptations during lactation.
We have discussed the results in three separate sections: AA and glucose uptake, Jak2-Stat5 signaling, and mTOR and insulin signaling. In addition, due to the large interconnection between those, we also have discussed the underlying networks controlling milk protein synthesis.
Amino Acid and Glucose Transporters
The availability of AA is the main limiting factor for milk protein synthesis,17,31 with Met and Lys being the most-limiting in bovine mammary gland.31,32 Besides Met and Lys, several other AA also are essential17,18,33 (see also Additional file 2). In the present experiment we have measured three AAT that actively pump AA into mammary cells (SLC1A1, SLC1A5, and SLC36A1) and three (SLC3A2, SLC7A1, and SLC7A5) that counter-transport cationic AA (Lys and Arg) or protons (Fig. 4; see Additional file 2 for details about AAT).18,19,34,35 With the exception of SLC1A1, the data clearly showed a large up-regulation in expression of all measured AAT during lactation relative to pregnancy (Fig. 4). A large and very similar pattern of increase during lactation was observed for SLC1A5 and SLC7A5. Expression of SLC7A5 increases dramatically during lactation in rat. 36 Interestingly, SLC1A5 and SLC7A5 code for AAT systems L and ASC that specifically import neutral AA including branched-chain AA (Leu and Ile) (Additional file 2). It has been reported that those two AAT plus 4F2 heavy chain (SLC3A2) which form the functional heterodimer AA transporter with LAT1 (SLC7A5) have a reciprocal regulatory connection with mTOR, 35 probably through the active transport of Leu. The mRNA for those proteins was the most abundant among measured mRNA for AAT (Table 1 and S. Fig. 1 in Additional file 1). The expression of those three AAT also appear to be under control of mTOR. 35 The increase in expression of those transporters suggests an active import into cell of branched-chain AA and several other essential AA (see Fig. 1). This is in accord with previous data showing that those AA are taken up in excess by the bovine mammary gland 18 and have the larger net uptake. 33
The AAT PAT1 (SLC36A1) had a significant increase in expression in mammary due to lactation (Fig. 4). The PAT1 is highly expressed in small intestine 37 but recently it was reported to be expressed in human breast cancer cells (MCF-7) and it has been demonstrated to regulate mTORC1 activity by regulating AA availability inside the cells. 38 The relative abundance of SLC36A1 in bovine mammary was medium-to-low but the lowest among all transcripts coding for AAT measured (Table 1 and S. Fig. 1 in Additional file 1). The large expression due to lactation indicated a role of this AAT in milk synthesis and probably in the regulation of mTOR signaling through import of AA into cells and secretion into the cytoplasm of AA from endosomes (ie, intracellular regulation or buffering of mTOR). 38
Among the non-mTOR regulated AAT measured only SLC7A1 (CAT1) had increased expression during lactation (Fig. 4). The CAT1 transports specifically cationic AA (Lys and Arg; Fig. 1 and Additional file 2) and its expression has been reported to increase significantly in lactating rat mammary. 36 The AA Lys and Arg are among the most extracted AA by bovine mammary from blood. They fall in the group II essential AA because they are taken up by the mammary gland well in excess of their direct output in milk protein.31,39 The expression of SLC7A1 is induced by a decrease of AA availability. 34 Surprisingly, expression of SLC1A1 encoding the EAAT3 that transports Glu and Arg (Additional file 2), had only a numerical increase despite the fact that, among the non-essential AA, Glu has one of the greatest rates of import into mammary gland and it also is the most abundant AA in milk. 40
Overall, the gene expression of AAT suggests that transport of neutral AA, and specifically branched-chain AA, is very high in mammary gland during lactation. All the AAT that participate in regulating (ie, activating) mTOR have a large increase in expression during lactation. Besides CSN3, which had >30-fold increase in expression (Fig. 4), the AAT had the largest increase in expression among all genes measured in the present study (Fig. 4). This response underscores, confirming previous observations, 17 that the availability of AA for the lactating mammary tissue through increases in import is one of the most important factors regulating milk protein synthesis. Interestingly, as discussed above, the expression of several of those AAT appears to be regulated by mTOR, pointing to the crucial importance of this pathway in milk protein synthesis.
We have measured expression patterns of three glucose transporters GLUT1 (SLC2A1), GLUT3 (SLC2A3), and GLUT8 (SLC2A8) (Fig. 4). All of those had a low relative mRNA abundance with GLUT3 having the highest and GLUT1 the lowest (Table 1 and S. Fig. 1 in Additional file 1). These data appear to contradict the “low level” expression of GLUT3 in bovine mammary reported previously. 19 This glucose transporter is not expressed in murine or human mammary. 41 The expression of all three GLUT increased significantly during lactation (Fig. 4), with a larger increase observed for GLUT1 and GLUT8, confirming previous data. 41 Overall, our results confirmed the expected large uptake of glucose by the mammary gland during lactation. Interestingly the expression of GLUT1 also appears to be regulated by mTOR, 42 thus, interconnecting glucose uptake with mTOR signaling (see below).
Jak2-Stat5 Pathway and Milk Protein Synthesis
The STAT5 is a major factor controlling expression of milk protein genes in rodents 43 and appears to be an essential component for proper expression of milk protein genes in non-ruminants. 44 Besides protein synthesis, STAT5 is important for mammary gland development. 44 In bovine, STAT5 responds to prolactin and other lactogenic growth factors and its activity increases during lactation.8,9 However, in bovine mammary when compared to rodent, its role in controlling milk protein expression through the Jak2-Stat5 signaling pathway appears to be weak at best. 45 Our data appear to support a minor role of Jak2-Stat5 signaling for milk protein synthesis. This is inferred by the dramatic decrease of prolactin concentration in plasma during the first three days of lactation (Fig. 2) combined with the lack of any change in expression of PRLR, JAK2, and STAT5B during lactation. In addition, STAT5B activity is mostly regulated by its phosphorylation status and this appears to be already at the maximum level at the end of pregnancy and no further increases were observed in lactating bovine mammary. 45 It has been demonstrated, however, that the methylation status of the STAT5 promoter region acutely affects α-casein expression in bovine mammary. 46 Our data together with the last observation suggest that a basic STAT5 activity is probably essential for milk protein synthesis but the variation in expression of the genes coding for the milk proteins is not under control of this transcription factor.

Milk lactose and protein % and yield during lactation. The % protein was overall affected (P < 0.05) and lactose yield tended to be affected (P = 0.057) while protein yield (P = 0.63) and % of lactose (P = 0.11) were not affected by progression of the lactation. Different letters denote differences between each time point.
A potential role for the regulation of milk protein synthesis which could encompass STAT5 as a key player, but works as regulator of milk protein expression, is the transcription factor E74-like factor 5 (ELF5). 47 This protein is essential for expression of milk-related genes and its expression is under control of STAT5 and appears to enhance the STAT5 activity.48,49 The mRNA of ELF5 was among the most abundant measured in the present experiment (Table 1 and S. Fig. 1 in Additional file 1) and was significantly up-regulated during lactation (Fig. 4). Our data support a role of ELF5 in bovine mammary protein synthesis during lactation. Expression of ELF5 has been shown to be induced by insulin in bovine and mouse mammary. 67 In addition, the STAT5 phosphorylation status is strongly affected by insulin. 50 Those observations support a crucial role of insulin in regulation of expression of main milk proteins. A positive effect of insulin in milk protein synthesis has been previously demonstrated.5–7,51 Those previous observations together with our data highlight a complex network of major players in regulating coordinated expression and translation of milk-related genes with insulin playing a major role (Fig. 1).
mTOR Pathway, Insulin, AMPK, Leucine, and Milk Protein Synthesis
The role of mTOR signaling in bovine mammary protein synthesis has been previously evaluated (See Additional file 2 for a brief overview of the literature).11,12,15,33,–55 In the present work we have measured expression of the most important genes in the proposed networks of milk protein synthesis regulation encompassing mTOR, insulin, AMPK, MAPK, and glucose uptake (Fig. 1). Among measured genes involved in those functions and intracellular signaling (Fig. 5), the greatest up-regulation during lactation was observed for IRS1 (ca. >2-fold during the whole lactation vs. –15 d) with a significant, although less pronounced, up-regulation of INSR. Among the genes coding for insulin signaling downstream of IRS1, significant up-regulation during the whole lactation was observed for AKT3 and PDPK1. The AKT1, which has been demonstrated to be essential in murine mammary and its expression increases during lactation in this species,57,58 was among the least abundant transcripts among the ones measured (Table 1 and S. Fig. 1 in Additional file 1) and its expression was significantly higher only at 60 compared to –15 d (Fig. 5).
Together the data support a strong role of insulin in mammary gland during lactation. Interestingly, the expression of insulin signaling-related genes is not associated to the plasma concentration of insulin which decreases significantly during the peripartal period (Fig. 3) and remains low for at least 2 months after parturition.4,25 The insulin signaling through IRS1-IPK3-PDK-AKT (Fig. 1) is also common to one of the two IGF1 signaling routes. 59 Plasma molar concentration of IGF1 in bovine plasma is > 10 5 -fold higher than insulin. Thus, the increase in abundance of most of the insulin signaling genes (assuming that an increase in gene expression will be translated into more protein) might also be used to transduce IGF1-related signaling; however, in dairy cows the pattern of plasma concentration of IGF1 is similar to insulin with a significant decrease after parturition and with a low concentration during most of the lactation.60,61 The increase in expression of insulin signaling-related genes suggests an increase in insulin/IGF1 sensitivity of the mammary gland during lactation, which might compensate for the lower plasma concentration of the hormones.

Plasma concentration of insulin and prolactin during the transition from pregnancy into lactation in 4 out of 6 cows used in the present experiment. Both parameters were overall significantly affected by time (P < 0.001).* and # denotes points with a significant difference with P < 0.05 points without symbols for insulin and prolactin, respectively. Overall SEM for insulin = 1.77 for prolactin = 7.25.

Change in expression during lactation relative to –15 d of genes related to AA transport, glucose transport, Leu tRNA synthetase, κ-casein, and Jak2-Stat5 signaling. All genes were significantly affected by lactation (overall P < 0.05) with exception of LARS (P=0.06), JAK2 (P=0.84), and PRLR (P=0.35). The * denotes the time points significantly (P < 0.05) different than –15 d; each color of the * correspond to the color of the symbol for the gene.

Change in expression during lactation relative to –15 d of genes related to insulin signaling, activation and inhibition of protein synthesis related to mTOR, translation elongation, and ribosomal components. The expression of EEFA1, PIK3C2A, PIK3C3, PRKAA2, PRKAB1, RPL23, STK11, and TP53 was not affected by lactation (overall P > 0.10) and expression of RHEB (P = 0.096), RPS6 (P = 0.054), and TSC2 (P = 0.056) tended to be significant. Expression of all the other genes in the figure was significantly affected by time (P < 0.05). Among those expression of RPS6KB1 was not significant during any time point in lactation vs. –15 d. The * denotes the time points significantly (P < 0.05) different than –15 d; each color of the * correspond to the color of the symbol for the gene.
For the proteins involved in the core of mTORC1 signaling we observed a significant increase during lactation only for FRAP1 (coding for mTOR protein; Fig. 5). As far as we know, this is the first time FRAP1 expression has been measured in bovine mammary. Its transcript abundance can be considered medium-to-low (Table 1 and S. Fig. 1 in Additional file 1). Interestingly, the pattern in expression of FRAP1 is very similar to the pattern of % milk protein (Fig. 2). Among the downstream targets of mTOR, the expression of EIF4E was significantly higher at 15, 120 and, especially, 240 d. It has been reported previously that there is a significantly greater abundance of EIF4E in lactating bovine mammary at the end of lactation compared to dry-off resulting from abrupt cessation of milking 55 and in lactating mammary compared to pregnancy in primiparous cows. 62
Remarkably, among known inhibitors of protein synthesis the mRNA for EIF4EBP isoforms was highly abundant in bovine mammary (Table 1 and S. Fig. 1 in Additional file 1). Expression of EIF4EBP2 was significantly up-regulated during the whole lactation, while EIF4EBP1 expression was significantly up-regulated only at 1 and down-regulated at 240 d in lactation (Fig. 5). Isoforms of EIF4EBP code for the 4E-BP that bind eIF4E, thus, preventing translation initiation which can be considered part of the core of mTOR signaling (Fig. 1). A greater abundance of 4E-BP1 in bovine mammary at the end of lactation vs. dry-off has been previously reported. 55
Even though we have only measured expression of FRAP1 (but not the genes coding for raptor or GβL) (see Fig. 1) among the genes considered core of mTOR system, the mTOR protein coded by this gene is considered the “master regulator” of the translational machinery. 63 However, the same mTOR protein is used for mTORC1 and mTORC2 signaling pathways. 63 We have not measured any component of the mTORC2 pathway, whose main role is regulation of growth, metabolism, and cytoskeleton. 20 Despite those limitations, our data indicated that bovine mammary increased its sensitivity (⇑FRAP1) and control (⇑EIF4-EBP2) over the mTORC1 core signaling pathway during lactation. Interestingly, we observed an almost a concomitant increase in expression of EIF4E (Fig. 5).
The larger transcript abundance of EIF4EBP genes compared to EIF4E (assuming that the translation of those mRNA is proportional to the transcript abundance, see Table 1 and S. Fig. 1 in Additional file 1) suggests that during lactation there was an overwhelming amount of 4EBP that retained EIF4E, thus, preventing the initiation of transcription. This conclusion appears to be supported by a greater % of bound 4EBP-EIF4E in lactating vs. non-lactating bovine mammary. 55 Thus, the increase in expression of mTOR during lactation in bovine mammary may be a way to increase availability of the main phosphorylase for 4EBP in order to free EIF4E (Fig. 1). Overall, it appears that mammary gland during lactation increases the fine control of translation.
Among inhibitors of mTOR signaling, GSK3A and TSC1 were overall affected by the onset of lactation. The GSK3 α protein is inhibited by insulin and controls protein translation by activating TSC2, which in turn inhibits mTORC1 via Rheb, and by phosphorylation of the eIF2B inhibiting its binding with the translation initiation complex hindering translation (Fig. 1). 63 The GSK3 is a kinase that has peculiar features: it is constitutively active and extracellular stimulation inhibits GSK3 kinase activity, it is inhibited by phosphorylation, it requires ‘primed’ phosphorylation of its substrates by other kinases before GSK3 can phosphorylate them, and it mainly plays a role as a negative regulator. 64 Thus, the increase in expression of GSK3A can be considered an increase in the basal inhibition of protein synthesis; however, the increase in insulin signaling in mammary gland during lactation probably has a pivotal role in preventing such inhibition.
As also suggested above and considering the greater abundance of TSC1 during lactation, this observation indicated that the mammary gland during lactation increased tightly the regulation of the translational machinery emphasizing the role of insulin in “allowing” protein synthesis to take place. This conclusion is supported by the demonstrated role of insulin, or level of energy in the diet that increases insulin, in enhancing bovine mammary protein synthesis.6,7,33,53
mTOR activity appears to be inhibited by the AMPK signal. 20 The AMPK complex senses the decrease in energy and, as a consequence, inhibits the energy-consuming protein synthetic process. 63 We did not observed changes in expression of any gene coding for proteins involved in AMPK signaling, suggesting a relatively minor importance of this pathway for milk protein synthesis regulation despite the increased protein synthesis.
The mRNAs of translation elongation factors were among the most abundant (Table 1 and S. Fig. 1 in Additional file 1) and EEF2 expression was up-regulated significantly during the whole lactation. Among the translational elongation factors measured, EEF2 is the only one regulated by phosphorylation (through eukaryotic translation elongation factor 2 kinase or EEF2K, Fig. 1). In addition, elongation is the most energetically-costly process during translation. 63 Therefore, the observed increase in abundance of EEF2 in bovine mammary could have had a two-fold effect: first, it could have increased the utilization of energy for protein translation, this was probably compensated by the increase in energy availability through greater import of AA and glucose (expression of those transporters had the largest increase at 60 vs. –15 d, Fig. 4); on the other hand, the large amount of EEF2 protein could have counteracted the inhibition by its kinase. The EEF2K is a strong inhibitor of protein synthesis in muscle through the Ca2+ calmodulin signaling pathway. 65 Considering that translation is performed in the cytosol and that the cytosolic Ca2+ concentration is very low in mammary epithelial cells despite the large increase in intracellular Ca2+ for casein micelle formation, 66 the protein synthesis inhibition by the EEF2K was probably not relevant in lactating bovine mammary gland.
The p38 MAPK (MAPK14) has a positive effect on protein synthesis by increasing the stability of mRNA through phosphorylation of the AU-rich element-binding protein (ARE-BP). 63 We observed a significant increase in MAPK14 expression during the first four months of lactation (Fig. 5). It is well-known that casein transcript abundance in the cell is a consequence of the large increase in mRNA expression but also the increase in mRNA half-life due to its large poly-A tails. 67 Our data indicated that there was a likely increase in the phosphorylation of ARE-BP with a consequent increase in stability of mRNA. The relationship between increased stability of mRNA and milk protein transcripts remains to be determined. Interestingly, in human monocytes the expression of casein αS1 appeared to be under control of p38 MAPK. 68 This also needs to be demonstrated in bovine mammary; however, our data support a role of MAPK14 in mammary during lactation and, likely, for expression of milk protein genes.
The mRNAs of components of the ribosome 40S and 60S subunits were highly abundant in bovine mammary (Table 1 and S. Fig. 1 in Additional file 1). RPL22 expression was significantly down-regulated during peak lactation (Fig. 5). RPL35 expression was significantly up-regulated at 15 d (Fig. 5). Considering that the excreted milk proteins are synthesized in the endoplasmic reticulum, it is interesting that RPL35 has been shown to have a role in translation and endoplasmic reticulum docking. 69 This observation might suggest a role of this ribosomal component in milk protein synthesis during early lactation. The other ribosomal components, including RPS6, were consistently expressed without any change during pregnancy and lactation. Those data indicated that the components of the core of the protein synthesis machinery did not increase during lactation in bovine mammary; rather, some of them had a significant decrease in expression. This observation is, in some way, surprising considering that milk protein synthesis increases dramatically during lactation. 12
The decrease in expression of protein synthesis components during lactation has been previously reported in large microarray analysis of murine mammary. 70 The decrease, or lack of increase, of expression of ribosome components despite the evident increase in protein synthesis, together with the apparent induction of translation during lactation suggested also by the data of the present manuscript, led us to infer that the decrease of ribosome components with a marked increase in mRNA expression of caseins and other milk-specific proteins (see for instance Fig. 4 for CSN3, but see also lactoalbumin elsewhere) 22 is a mechanism for the mammary gland to prioritize at the translational level mRNA abundance for synthesis of milk-specific proteins rather than non-milk-specific proteins.
The above suggestion also appears to be supported by previous data in mouse and goat where competition between secreted milk proteins was observed.71,72 This implies that increase in mRNA expression of milk proteins can have a strong effect on milk protein composition but a rather minor effect on total milk protein synthesis. This conclusion is supported by data from transgenic cows where expression of beta- and kappa-casein was enhanced. Those cows had a significant change in casein composition of the milk but only a slight, yet significant, increase in milk protein synthesis. 73 In addition, we should also consider that the caseins and most of milk proteins are synthesized in polyribosomes attached to the endoplasmic reticulum. 74 It is possible that the decrease in expression observed for some of the ribosomal components encompasses components of the cytosolic protein machinery and not of the endoplasmic reticulum.
Summary and Conclusions
Figures 6, 7, and 8 summarize the dynamic networks of measured genes (built using Ingenuity Pathway Analysis, IPA, http://ingenuity.com, using IPA knowledge base and from Fig. 1). Overall, network visualization indicated that during lactation the expression of genes composing the networks is quite stable and with few changes. Particularly at 240 d there was a significant down-regulation of STAT5B and ELF5 (Fig. 8). This might explain part of the decrease in CSN3 expression observed at this time point (Fig. 4). Another difference was the decrease at 240 d in expression of EIF4EBP (particularly the isoform 1) (Fig. 8) which might have allowed for an increase in free eIF4E as previously reported for non-lactating vs. lactating bovine mammary. 55 Considering that all the other signaling cascades that stimulate translation were still highly-induced at 240 d (Fig. 8) we can infer an overall increase in translation (and reduction in specific mRNA competition for translation, see above). This might explain the maintenance of relative proportions of the different caseins in milk during lactation despite the decrease in their gene expression (eg, CSN3 in Fig. 4). 75 This is probably not surprising considering that the total amount of milk protein yield remained unchanged during the whole lactation (Fig. 2).
The dynamic network (Figs. 6, 7, and 8) highlights the increased insulin (or IGF1) sensitivity in lactating bovine mammary tissue through the IRS1-PDK-AKT signaling pathway and this signaling was probably amplified by the greater availability of mTOR protein. This could have increased both synthesis of protein and glucose import into mammary, as indicated by the large up-regulation of GLUT1 genes. Very evident from the network (Figs. 6, 7, and 8) was the large up-regulation of AAT, particularly for those transporting EAA, such as Leu. Larger uptake of EAA, and particularly Leu, compared to non-essential AA by bovine mammary has been previously reported. 33 This implies an intracellular increase of Leu that could have enhanced translation mainly through augmentation of mTOR pathway signaling (Fig. 1 and (Figs. 6, 7, and 8). Despite the greater import, incorporation of Leu into milk protein during lactation did not appear to have been increased, as suggested by the lack of change in Leu tRNA synthetases (Fig. 4). The low ratio of Leu content in milk/plasma and the high ratio mammary/milk previously reported supports this suggestion. 40
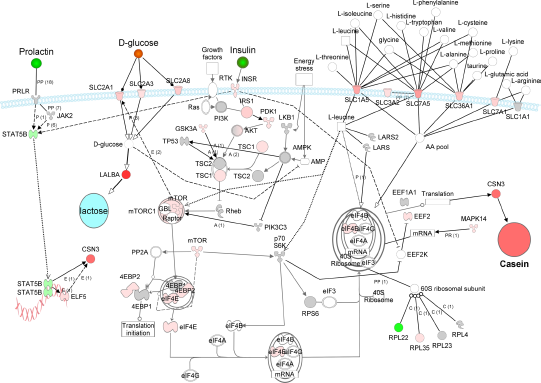
Overall results depicted in the networks of AA and glucose transporters and mTOR, Jak2-Stat5, insulin, and AMPK signaling with log2 fold change at 15 relative to –15 d postpartum. The overall pathway was built using Ingenuity Pathway Analysis software. Grey-shaded objects denote measured genes with not significant change, red-shaded object denote up-regulation, and green-shaded objects down-regulation in expression relative to –15 days in milk. The expression of LALBA has been previously measured in the same samples. 23 Arrow denote relationships (P = phosphorylation, PP = protein-protein interaction, PR = protein-RNA interaction, E = effect on expression, A = activation). Dotted lines denote indirect effect. See caption for Figure 1 for detailed explanation.

Overall results depicted in the networks of AA and glucose transporters and mTOR, Jak2-Stat5, insulin, and AMPK signaling with log2 fold change at 60 relative to –15 d postpartum. The overall pathway was built using Ingenuity Pathway Analysis software. Grey-shaded objects denote measured genes with not significant change, red-shaded object denote up-regulation, and green-shaded objects down-regulation in expression at the considered days relative to –15 days in milk. Arrow denote relationships (P = phosphorylation, PP = protein-protein interaction, PR = protein-RNA interaction, E = effect on expression, A = activation). The expression of LALBA has been previously measured in the same samples. 23 Dotted lines denote indirect effect. See caption for Figure 1 for detailed explanation.
Overall our data together with previously reported data (discussed above and in Additional file 2) suggested that bovine milk protein synthesis is driven by AA import into the mammary epithelium, with increases of intramammary Leu and a consequent enhancement of mTOR signaling or general translation. Translation is basically inhibited (⇑EIF4EBP2, ⇑GSK3A, ⇑TSC1) but probably this inhibition was overridden by insulin through the mTOR pathway, highlighting a crucial role of dietary energy content in milk protein synthesis, ie, increasing insulinaemia. Lastly, our data point to a crucial role of ELF5 in the control of milk protein mRNA expression and a likely role of MAPK14 in increasing mRNA stability. No evidence was found for a more important role of AMPK signaling during lactation compared to pregnancy in bovine mammary tissue. An important role of AMPK in the regulation of milk fat synthesis has been reported previously. 76 Our in vivo data indicate that the mammary gland does not need additional amounts of such proteins (ie, does not need to increase its sensitivity toward the energy status through AMPK) to control milk synthesis.

Overall results depicted in the networks of AA and glucose transporters and mTOR, Jak2-Stat5, insulin, and AMPK signaling with log2 fold change at 240 relative to –15 d postpartum. The overall pathway was built using Ingenuity Pathway Analysis software. Grey-shaded objects denote measured genes with not significant change, red-shaded object denote up-regulation, and green-shaded objects down-regulation in expression at the considered days relative to –15 days in milk. Arrow denote relationships (P = phosphorylation, PP = protein-protein interaction, PR = protein-RNA interaction, E = effect on expression, A = activation). The expression of LALBA has been previously measured in the same samples. 23 Dotted lines denote indirect effect. See caption for Figure 1 for detailed explanation.
Disclosure
This manuscript has been read and approved by all authors. This paper is unique and is not under consideration by any other publication and has not been published elsewhere. The authors and peer reviewers of this paper report no conflicts of interest. The authors confirm that they have permission to reproduce any copyrighted material.
Footnotes
Acknowledgements
Partial financial support for the gene expression work and milk protein and lactose analyses was provided by the Cooperative State Research, Education and Extension Service, U. S. Department of Agriculture, under project No. ILLU-538–307 (to JJL). We gratefully acknowledge the help from the staff of the University of Illinois Dairy Research and Teaching Unit for animal care.