
Abstract
Transcription factors control gene expression by binding to short specific DNA sequences, called transcription factor binding sites (TFBSs), in the promoter of a gene. Thus, studying the spatial distribution of TFBSs in the promoters may provide insights into the molecular mechanisms of gene regulation. I developed a method to construct the spatial distribution of TFBSs for any set of genes of interest. I found that different functional gene clusters have different spatial distributions of TFBSs, indicating that gene regulation mechanisms may be very different among different functional gene clusters. I also found that the binding sites for different transcription factors (TFs) may have different spatial distributions: a sharp peak, a plateau or no dominant single peak. The spatial distributions of binding sites for many TFs derived from my analyses are valuable prior information for TFBS prediction algorithm because different regions of a promoter can assign different possibilities for TFBS occurrence.
Introduction
Cells regularly face variable environments and can sense many different signals, including temperature, oxidative, and osmotic pressure, beneficial nutrients, and harmful chemicals.1–5 Through signal transduction pathways, these signals can modulate the activities of transcription factors (TFs). The active TFs can regulate the gene expression of many targets genes to produce appropriate proteins, which work together to enable cells to adapt to new environmental conditions.6–14 TFs regulate gene expression by binding to specific DNA sequences, called transcription factor binding sites (TFBSs), in the promoters of the target genes. Therefore, studying the spatial distribution of the TFBSs in the promoters may provide insights into the molecular mechanisms of gene regulation.
By using the TFBS data derived from the ChIP-chip data, Harbison et al 15 constructed the spatial distribution of the TFBSs in yeast promoters. They found that binding sites are not uniformly distributed over the promoter regions. Although their findings are interesting, their method has two problems. First, their spatial distribution of the TFBSs was inferred relative to the translation start codon. Since TFs control gene expression at the transcriptional level and transcription is initiated from the transcription start site (TSS), it is more biologically meaningful to infer the spatial distribution of the TFBSs relative to the TSS than to the translation start codon.16,17 Second, their spatial distribution of the TFBSs was constructed by counting the number of TFBSs located at each site of a promoter. Because the number of promoter sequences that contain a site near the TSS (say 100 bp upstream from the TSS) is much larger than that of a site far upstream from the TSS (say 1000 bp upstream from the TSS), the number of TFBSs found at a site near the TSS will tend to be larger than that of a site far upstream from the TSS. Therefore, to avoid the bias caused by unequal numbers of promoter sequences that contain different sites, it is better to construct the spatial distribution of the TFBSs by counting the frequency of TFBSs than counting the number of TFBSs. The frequency of TFBSs located at a site is calculated by dividing the number of TFBSs located at that site by the number of promoter sequences which contain that site.
In this study, I developed a method to construct the spatial distribution of the TFBSs, which can solve the two problems of Harbison et al's method. 15 My method constructed the spatial distribution of the TFBSs relative to the TSS by counting the frequency of TFBSs located at each site of a promoter. Using my method, I can construct the spatial distribution of the TFBSs for any set of genes of interest. I found that different functional gene clusters have different spatial distributions of the TFBSs. I also found that binding sites of different TFs may have different spatial distributions.
Methods
Datasets
The TFBS locations in the yeast genome for 117 TFs were retrieved from the paper of MacIsaac et al.
18
They used two binding motif discovery algorithms, PhyloCon and Converge, to identify the genome-wide locations of the TFBSs. These two algorithms are based on TF-DNA binding evidence (determined by the
The genomic coordinates of the TSS of 4560 yeast genes were retrieved from Nagalakshmi et al's paper, 19 in which a high-resolution transcriptome of the yeast genome was generated by a high-throughput RNA-seq method. The lists of 2803 singleton and 1501 duplicate genes were defined according to Ensembl gene family annotation. 20 The lists of 914 essential and 3387 non-essential genes were downloaded from Saccharomyces Genome Deletion Project Website. 21 The lists of 2079 stress and 2290 non-stress genes were defined according to Gasch et al's paper. 3 A gene is called a stress gene if it has a fold change larger than two under at least one of the five stress conditions: heat shock, oxidative shock, osmotic shock, amino acid starvation, and nitrogen depletion.
Constructing the Spatial Distribution of the TFBSs for a Functional Gene Cluster
Let

The spatial distributions of the TFBSs for singleton and duplicate genes. It can be seen that singleton genes have a sharply peaked distribution of the TFBSs, whereas duplicate genes have a dispersed distribution of the TFBSs. The difference between the spatial distributions for singleton and duplicate genes is statistically significant (K-S test,
Identifying the Enriched TFBSs in a Functional Gene Cluster
Let

where
Constructing the Random Expectation of the Spatial Distribution of the TFBSs
The random expectation of the spatial distribution of the TFBSs is calculated by averaging the distributions constructed using 1,000 “randomized” genomes in which the binding sites in each promoter region were redistributed randomly and independently in each promoter region. 15
Statistical Testing for the Difference between two Spatial Distributions of the TFBSs
Kolmogorov-Smirnov (K-S) test was used to test if two spatial distributions of the TFBSs are statistically different in location or shape.
22
Assume that
Results
The Spatial Distributions of the TFBSs for Singleton Genes and Duplicate Genes are Significantly Different
Gene duplication plays an important role in evolution because it is the primary source of new genes. Many studies showed that gene duplicability varies considerably among genes.23–25 Some genes only have a single copy whereas the other genes have multiple copies in an organism. It would be interesting to know whether singleton and duplicate genes have different gene regulation mechanisms. I studied this issue by constructing the spatial distributions of the TFBSs for singleton and duplicate genes. I found that singleton genes have a sharply peaked distribution of the TFBSs, whereas duplicate genes have a dispersed distribution of the TFBSs (see Fig. 1). The difference between the spatial distributions for singleton and duplicate genes is statistically significant (K-S test,
The enriched TFBSs (P-value <0.001) in the functional gene cluster under study (see Supplementary Table 2 for details).

The Spatial Distributions of the TFBSs for Essential Genes and Non-Essential Genes are Significantly Different
Essential genes in yeast are those genes required for laboratory growth on rich media.
21
The deletion of any one of these genes is sufficient to confer a lethal phenotype. Such genes make excellent potential drug targets.
26
It is estimated that 17.8% of the yeast genome is essential.27,28 On the other hand, non-essential genes are those genes when deleted may have some fitness effects but the yeast still can survive. It would be interesting to know whether essential and non-essential genes have different gene regulation mechanisms. I studied this issue by constructing the spatial distributions of the TFBSs for essential and non-essential genes. I found that essential genes have a sharply peaked distribution of the TFBSs, whereas non-essential genes have a dispersed distribution of the TFBSs (see Fig. 2). The difference between the spatial distributions for essential and non-essential genes is statistically significant (K-S test,

The spatial distributions of the TFBSs for essential and non-essential genes. It can be seen that essential genes have a sharply peaked distribution of the TFBSs, whereas non-essential genes have a dispersed distribution of the TFBSs. The difference between the spatial distributions for essential and non-essential genes is statistically significant (K-S test,
The Spatial Distributions of the TFBSs for Stress Genes and Non-Stress Genes are Significantly Different
Stress genes are those genes whose protein products can help cells fight against the deleterious effects induced by environmental stresses such as high temperature, high acidity, nutrient depletion, etc.1–5 On the other hand, non-stress genes are those genes whose functions are not related to the cell's complex stress adaptation mechanism. It would be interesting to know whether stress and non-stress genes have different gene regulation mechanisms. I studied this issue by constructing the spatial distributions of the TFBSs for stress and non-stress genes. I found that non-stress genes have a sharply peaked distribution of the TFBSs, whereas stress genes have a dispersed distribution of the TFBSs (see Fig. 3). The difference between the spatial distributions for stress and non-stress genes is statistically significant (K-S test,

The spatial distributions of the TFBSs for stress and non-stress genes. It can be seen that non-stress genes have a sharply peaked distribution of the TFBSs, whereas stress genes have a dispersed distribution of the TFBSs. The difference between the spatial distributions for stress and non-stress genes is statistically significant (K-S test,
The Spatial Distributions of the Binding Sites for Different TFs are Significantly Different
In the previous results, the spatial distribution of the TFBSs for a functional gene cluster as constructed by considering the binding site data of all TFs. It would be interesting to know whether the spatial distributions of the binding sites for different TFs are different. Therefore, I constructed the spatial distribution of the binding sites for each available TF.
18
For example, 356 Abf1's binding sites in the promoter regions of 308 Abf1's target genes in the yeast genome are used to construct the spatial distribution of the binding sites for Abf1. After constructing the spatial distributions of the binding sites for various TFs, I found that these spatial distributions could be divided into three categories (see Fig. 4): 49 TFs in the first category, 27 TFs in the second category and 41 TFs in the third category (see Supplementary Table 1 for the detailed list of the TFs in each category). The spatial distributions of the binding sites for the first group of TFs, eg, Abf1, Reb1, and Hap4, have a sharp peak and can be fitted by a Power-law distribution (

The spatial distributions of the binding sites for different TFs. It can be seen that spatial distributions of the binding sites for different TFs are different and can be roughly divided into three categories: I) the distributions have a sharp peak, II) the distributions have a plateau, and III) the distributions do not have any dominant peak.
Discussions
The Proposed Method can Extract Biologically Meaningful Results
To show that my method can extract more biological insights than Harbison et al's approach, 15 I constructed the spatial distribution of the TFBSs for all genes in the yeast genome by using the TSS (in this study) and the translation start codon (in Harbison et al's study) as the reference point, respectively. When the TSS is used as the reference point, I found that the TFBSs are highly enriched in a ~100 bp region (ranging from 80 to 180 bp upstream from the TSS) with a sharp peak at –115 bp. The sharp peak is significantly higher than random expectation, supporting a strong positioning bias of the TFBSs relative to the TSS (see Fig. 5). In contrast, no sharp peak can be observed when the start codon was used as the reference point (see Fig. 5). This observation suggests my method is more powerful than Harbison et al's approach to construct biologically meaningful spatial distributions of the TFBSs.
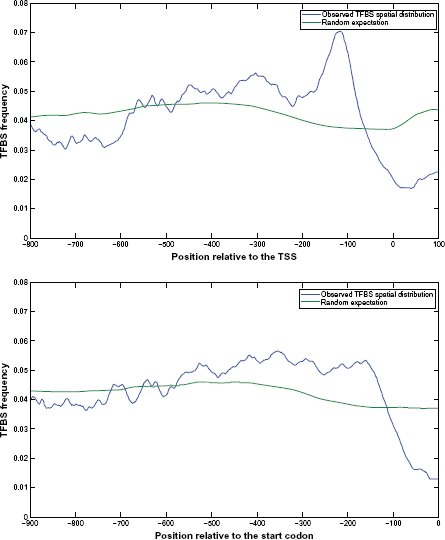
The spatial distributions of the TFBSs relative to the TSS v.s. the start codon. I constructed the spatial distribution of the TFBSs for all genes in the yeast genome by using the TSS (in this study) and the translation start codon (in Harbison et al's study) as the reference point, respectively. A sharp peak can be seen in the spatial distribution of the TFBSs relative to the TSS and the sharp peak is significantly higher than random expectation, supporting a strong positioning bias of the TFBSs relative to the TSS. However, such sharp peak cannot be seen in the spatial distribution of the TFBSs relative to the start codon, suggesting that my method is more powerful than Harbison et al's approach to construct biologically meaningful spatial distributions of the TFBSs.
The Proposed Method is Robust
Since the total number of TFBSs that could be identified strongly depends on the parameter settings in TFBS prediction algorithms, I performed my analyses using four different TFBS datasets to ensure the robustness of my findings. I found that these four distributions of the TFBSs have very similar patterns, showing the robustness of my results (see Fig. 6a). Moreover, since TFBSs in divergent promoters (a common promoter region shared by two divergently transcribed adjacent genes) cannot be assigned to one of the two adjacent genes unambiguously, I excluded these TFBSs from my analyses to avoid the potential bias. I found that the distributions of the TFBSs are almost the same whether I included divergent promoters in my analyses or not, showing that my method is very robust (see Fig. 6b). In addition, I used three different window sizes (31 bp, 41 bp, and 51 bp) of the sliding window for smoothing the spatial distributions of the TFBSs. I found that these three distributions of the TFBSs have very similar patterns, showing the robustness of my results (see Fig. 7).

The robustness of my method. A) The four spatial distributions of the TFBSs constructed by using four different TFBS datasets have very similar patterns, showing the robustness of my method. B) The two spatial distributions of the TFBSs constructed by including or excluding the divergently transcribed adjacent gene pairs are almost the same, showing that my method is very robust.

Using three different window sizes for smoothing the spatial distribution of the TFBSs. The three spatial distributions of the TFBSs constructed by using three different window sizes (31 bp, 41 bp, and 51 bp) of the sliding window have very similar patterns, showing my result is not sensitive to the chosen window size.
The Spatial Distributions of the Binding Sites for Various TFs are Useful
The spatial distributions of the binding sites for different TFs derived from my analyses can be used as valuable prior information for TFBS prediction. For example, when a TFBS prediction algorithm is performed to search Abf1's binding sites in a promoter of interest, it should focus on the DNA sequences from 100 bp to 200 bp upstream from the TSS because most of Abf1's binding sites prefer to locate in this region (see Fig. 4). In contrast, when search Yap6's binding sites in a promoter of interest, every region of the promoter should have equal attention because Yap6's binding sites have no preference to locate in a particular region of the promoter (see Fig. 4).
Conclusions
I developed a method to construct the spatial distribution of the TFBSs for any set of genes of interest. Unlike Harbison et al's approach, I used the transcription start site (TSS) as the reference point and counted the frequency of TFBSs for each site in the promoter of a gene. These two features make my method more biologically meaningful than their approach. Besides, I constructed the spatial distributions of the TFBSs using four different TFBS datasets and found highly consistent results, showing the robustness of my method. Moreover, I used my method to construct the spatial distributions of the TFBSs for different functional gene clusters. I found that singleton genes, essential genes and non-stress genes have sharply peaked spatial distributions of the TFBSs, whereas duplicate genes, non-essential genes, and stress genes have dispersed spatial distributions of the TFBSs. In addition, I found that binding sites for different TFs may have different spatial distributions. For example, the spatial distributions of the binding sites of Abf1, Reb1 and Hap4 all have a sharp peak; the distributions of the binding sites of Rap1, Fhl1 and Skn7 all have a plateau, but the distributions of the binding sites of Mot3, Phd1, and Yap6's do not have any dominant peak. In summary, my results show that different functional gene clusters have different spatial distributions of the TFBSs, indicating that gene regulation mechanisms may be very different among different functional gene clusters.
Disclosures
This manuscript has been read and approved by the author. This paper is unique and not under consideration by any other publication and has not been published elsewhere. The author and peer reviewers report no conflicts of interest. The author confirms that they have permission to reproduce any copyrighted material.
Supplementary Data
Footnotes
Acknowledgements
I thank Drs. Wen-Hsiung Li, Zhenguo Lin, and Han Liang for helpful discussion. This study was supported by the Taiwan National Science Council NSC 99-2628-B-006-015-MY3.