
Abstract
To establish a relevant in vitro model for systems toxicology-based mechanistic assessment of environmental stressors such as cigarette smoke (CS), we exposed human organotypic bronchial epithelial tissue cultures at the air liquid interface (ALI) to various CS doses. Previously, we compared in vitro gene expression changes with published human airway epithelia in vivo data to assess their similarities. Here, we present a follow-up evaluation of these in vitro transcriptomics data, using complementary computational approaches and an integrated mRNA-microRNA (miRNA) analysis. The main cellular pathways perturbed by CS exposure were related to stress responses (oxidative stress and xenobiotic metabolism), inflammation (inhibition of nuclear factor-kB and the interferon gamma-dependent pathway), and proliferation/differentiation. Within post-exposure periods up to 48 hours, a transient kinetic response was observed at lower CS doses, whereas higher doses resulted in more sustained responses. In conclusion, this systems toxicology approach has potential for product testing according to “21st Century Toxicology”.
Keywords
Introduction
The human lung epithelium is continuously exposed to various environmental stressors, including cigarette smoke (CS). In line with “21st Century Toxicology”, new strategies for a systems biology-based risk assessment of environmentally hazardous substances, such as tobacco products, are currently under development.1–4 The establishment of reliable in vitro systems is extremely important in this because human testing is very limited, and animal studies are expensive and laborious, with disputable translatability to humans.5,6
Cell culture models using primary human cells are valuable screening tools for both risk assessment purposes and mechanistic investigations. The most common in vitro models used to investigate the effect of aerosols on human lung epithelium mainly consist of monolayers of lung-derived epithelial cells. However, although transformed (tumorderived or immortalized) cells are readily available, they have a number of limitations. These include (i) their inherent tumorigenicity (eg, BEAS-2B and A549 cells); (ii) their ability to only partially mimic normal bronchial epithelial cell behavior (eg, A549, a type-2 alveolar cell-like adenocarcinoma-derived tumor cell line) 7 ; (iii) the lack of multiple cell types, which as multicellular in vitro systems would better represent the tissue reaction to certain exposures 8 ; and (iv) the inability of the cell monolayer, normally covered with culture medium, to achieve organotypic differentiation, including epithelial polarity. Moreover, although submerged cells that have not undergone organotypic differentiation can be exposed directly to complex aerosols such as CS,9–12 the nonspecific stress and damage caused by removal of the culture medium and the lack of differentiated features that protect against airborne toxicants (eg, mucociliary or squamous differentiation) cannot be excluded. Therefore, exposure surrogates such as aqueous CS extracts 13 or specific fractions diluted in solvents such as dimethyl sulfoxide are still used in most models. 14
In recent years, progress has been made in the development of valuable in vitro systems that mimic human airway and lung epithelia. Organotypic pseudostratified bronchial epithelium-like tissue derived from primary human bronchial epithelial cells that closely resembles normal human tracheobronchial epithelium after differentiating into ciliated, non-ciliated, goblet, and basal cells is now available.15,16 Such tissue cultures have been used to investigate the effects of CS-related substances such as nicotine, formaldehyde, urethane, cadmium, 17 and hydrogen peroxide. 18 Applying these substances as liquid solutions to the air liquid interface (ALI) has identified a number of exposure-specific molecular defense mechanisms.17–19 We and others have previously exposed organotypic murine 20 and human bronchial epithelial tissue cultures21,22 to whole mainstream CS at the ALI. By analyzing different endpoints, including gene expression, the effects of CS were observed on many cellular processes, including xenobiotic metabolism, the oxidant/antioxidant balance, cell proliferation, and DNA damage and repair.
Recently, we exposed human organotypic bronchial epithelial tissue cultures (AIR-100 tissue) at the ALI to mainstream CS using the Vitrocell® system. Data generated in this in vitro experiment as well as in vivo published data were used to perform a comparative analysis of different CS exposure durations (corresponding to different doses) and postexposure periods. We demonstrated that this in vitro system is a reliable model of the bronchial epithelium of human smokers. 21 In a second analysis of these in vitro data, presented herein, we applied a broad systems biology approach, including a novel computational modeling method, to more extensively analyze the gene expression data, and generated additional microRNA (miRNA) profile to further understand the exposure effect. For an enhanced tissue context-specific interpretation of the gene expression changes, we complemented gene set enrichment analysis (GSEA) 23 with a novel reverse causal reasoning (RCR)-based approach, 24 including several selected computable causal network models: (i) the cellular stress network model, 25 (ii) the cell proliferation network model, 26 and (iii) the inflammatory process network model. 27
The RCR method 24 integrates large-scale transcriptomics data into a biological context using information from differentially expressed genes together with a priori knowledge of cause and effect relationships to identify high-level upstream controllers of the observed gene expression called hypotheses (HYPs) (for details, see Refs. 25-27). HYPs were mapped as functional nodes on specific cellular networks, thereby enabling the identification of molecular perturbations of specific cellular signal pathways within the networks in response to CS exposure.
Another side of this study was to generate from the same samples both gene expression and miRNA profiles in order to integrate them into our systems biology investigation of the effect of CS. A stringent approach was applied based on the high-confidence miRNA targets provided by TarBase. 28 Various small regulatory networks were then created where possible around the significantly expressed miRNAs to reveal details of the downregulation of nuclear factor NF-kB signaling and the activation of cell cycle activation.
Materials and Methods
Cell Culture
EpiAirway™ tissue cultures (AIR-100), purchased from MatTek Corporation, were produced from primary bronchial epithelial cells obtained from a 23-year-old male donor with no history of smoking. Tissue inserts were first cultured for 24 ∓ 2 hours at 37 °C after shipment prior to exposure. The different exposure conditions did not trigger a decrease in cell viability as assessed 24 hours after exposure using the soluble tetrazolium salt resazurin (Sigma) (data not shown).
CS Exposure and Experimental Design
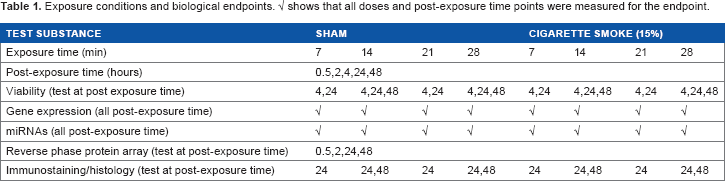
The reference cigarettes 3R4F were obtained from the University of Kentucky (www.ca.uky.edu/refcig) and stored in their original packaging in a cooling chamber at 5 ∓ 3 °C with uncontrolled humidity conditions before conditioning. Conditioning of the sticks was performed at 22 ∓ 2 °C with 60 ∓ 5% humidity for 48 hours prior to the experiment. AIR-100 cultures were exposed in triplicate (three inserts per exposure condition) for 7, 14, 21, and 28 minutes at the ALI to either synthetic air (SA; 85% nitrogen and 15% oxygen; Praxair) or to 15% (vol/vol) mainstream CS from the 3R4F reference cigarette in the Vitrocell® system. 29 For all conditions, 1 puff/minute, 2 mL/minute of vacuum rate, 0.395 L/minute of dilution airflow, and 35 mL/puff were used. The smoking regimen was in basic conformity with the International Organization for Standardization (ISO 2000) smoking regimen using the VC 10 smoking robot. After exposure, tissues were incubated in fresh culture medium for 0.5, 2, 4, 24, and 48 hours before further analysis. Table 1 summarizes the various end points, time points, and dose levels.
Exposure conditions and biological endpoints. √V shows that all doses and post-exposure time points were measured for the endpoint.
Array-Based Transcriptomics
RNA was extracted and hybridized to high-throughput GeneChip® Human Genome U133 Array Plates (Affymetrix). For miRNA analysis, total RNA was labeled using the miRCURYLNA™ miRNA Array Power Labeling Kit (Exiqon). The Hy3-labeled samples and a Hy5-labeled reference RNA sample were hybridized to the fifth generation of miRCURY LNA Array version (Exiqon). Array data were submitted to ArrayExpress with the following accession numbers: E-MTAB-874 for the mRNA dataset and E-MTAB-877 for the miRNA dataset.
Gene Set Enrichment Analysis
To investigate the main biological effects regulated by CS in AIR-100 tissue cultures, GSEA was performed with entire contrasts computed for the treatment effect independently of the dose.
23
For each postexposure time, the list of genes was sorted in descending order by the t-values associated with the βt coefficient estimated from the following linear model:

The coefficients of the model reflected the basal gene expression (β0, intercept), the whole CS effect (treatment: CS versus sham) independent of the dose (βt), the dose-effect (7, 14, 21, and 28 minutes) independent of the treatment (βd), and the interaction effect between the treatment and the dose (βi). The parameter ε corresponds to the residual error. Normalized enrichment scores (NESs) and the associated false discovery rate (FDR) were then computed for each gene set of the molecular signatures database (MSigDB) C2 collection representative of canonical pathways, biological processes, and chemical and genetic perturbations (http://www.broadinstitute.org/gsea/msigdb/index.jsp). These were used as prior knowledge for the analysis. Gene sets with significant NESs (NESs with FDR ≤0.05) for at least one post-exposure time and similar functions were grouped together to represent specific biological processes perturbed by CS.
Reverse Causal Reasoning
RCR 24 is a knowledge-driven approach used to identify high-level upstream controllers, HYPs, which could explain the observed differential gene expression profiles. A priori biological knowledge in the form of possible HYPs and experimental data in the form of significantly regulated genes selected from each treatment-control pairwise contrast gene expression profile (different doses and post-exposure times) were used as inputs for RCR analysis. These pairwise comparisons were computed using limma 30 following a global linear model to produce a contrast for each treatment-control pair (CS for a given exposure time/ dose and post-exposure time were compared with the corresponding sham condition). Genes that were significantly differentially regulated by CS were selected by an absolute fold change ≥1.3, a significance level (FDR) ≤0.05, and an abundance level ≥log2(100).
An HYP corresponds to a simple causal network constituted by an upstream node (subject term or controller) connected to downstream nodes (measured quantities, eg, expression of target genes) by a causal edge. Each edge represents the causal relationship between the controller and the target gene derived from an evidence line extracted from the literature (eg, transcriptional activation of x increases the expression of y, but decreases the expression of ω), and each causal statement is coded in the biological expression language (BEL) (http://www.openbel.org) (for details, see Ref. 24).
The notion of causal relationship directionality is important in RCR. Indeed, HYPs can be evaluated as potential explanations for the observed differences in measurement sets by calculating the concordance statistic, which measures the consistency of the directions between the observed state changes (corresponding to the pairwise differentially expressed genes) and the expected direction. A P-value was computed for each concordance statistic. RCR analysis of our data was performed on the Gene Technology Platform (Selventa), currently holding more than 2,000 HYPs. 24
Network Models
The following causal biological network models were applied: cellular stress, 25 cell proliferation,26,31 and inflammatory process networks. 27 Only subnetworks related to lung epithelial cells were considered for the latter model (ie, epithelial barrier defense and epithelial cell proinflammatory signaling); immune-cell-specific subnetworks (eg, neutrophil response) were excluded. Network models and their underlying subnetworks consisted of edges and nodes coded in BEL. Nodes are biological entities such as protein abundance, mRNA expression, and protein activity or can represent biological processes such as response to oxidative stress (ROS). Some nodes are also called HYPs when they can be predicted to increase or decrease by the RCR based on the transcriptomics input to the network. All causal connections or edges were based on manually curated literature (for details of network model building, see Refs. 25-27).
HYP Clustering
To group HYPs that behave similarly with regard to the concordance statistic across doses and post-exposure times, the affinity propagation (AP) clustering algorithm in the form of an R implementation was used (APcluster32,33). Briefly, following RCR, HYPs belonging to one of the subnetworks investigated with at least one significant concordance (P < 0.05) across the 14 and 28 minutes exposure time and all post-exposure time contrasts were selected for the clustering process. The Pearson correlation coefficient of the minus log-transformed concordance P-values was computed as a measure of similarity for each pair of HYPs. A pair-wise correlation matrix was then taken as input by APcluster using default parameters to generate the clustering. As a result, HYPs were grouped into communities and further leveraged for biological interpretation of data.
Strategy for the Integrated mRNA-miRNA Analysis
Integrated mRNA-miRNA analyses are usually more sensitive than specific. They produce many candidate miRNA gene interactions, a significant fraction of which are false positive because of high signal-to-noise ratios in the statistical analyses. Here, we adopted a different approach by prioritizing specificity over sensitivity. This enabled our results to be interpreted on the basis of causations rather than correlations or statistical associations, which was in line with the approach taken for the analysis of mRNA expression data. We therefore made the following choices: (i) we used a less-detailed linear model to determine mRNA and miRNA differential expression (see below); (ii) differential expressions of significant miRNAs were compared with the corresponding values of their family members (ie, miRNAs from alternative strand, co-transcribed miRNAs, and paralogous miRNAs) to provide additional confidence in the obtained results; (iii) we used preferential mRNA-miRNA relationships supported by the most reliable experimental methods, as described in the TarBase repository 28 ; and (iv) we restricted the final interpretation to the 24 and 48 hours post-exposure time points, in which the effects of differential miRNA regulation could be reasonably expected to be detected in the differential expression of their mRNA targets (at least two hours were necessary to observe a significant decrease in target transcripts in the most favorable case). 34
Calculation of Differential Expression for Integrated mRNA-miRNA Analysis
Exiqon-based miRNA raw expression data were preprocessed as described in our previous study.
21
Because the miRNA data yielded a weaker signal than mRNA data, we replaced the linear model described above by a more robust two-step approach, which we applied to both miRNA and mRNA normalized expression data. First, CS-induced differential expression values were calculated by subtracting the mean of the post-exposure time- and dose-matched control group from the expression value of each sample. Second, for each post-exposure time point (0.5, 2,4, 24, and 48 hours), the obtained CS-induced differential expression matrix was applied to the following linear model:

The variables in the model are Treatment ∈ {0,1}, which corresponds to sham and treated samples, respectively, and Normalized_Dose ∈ {-1, -1/3, 1/3, 1}, which results from centering and normalizing the dose values {7, 14, 21, 28}. In this model, β captures the global CS-induced effect valid for all four doses, while βdg captures the systematic dose-specific deviations around the global CS-induced effect βg The coefficients of the linear model are statistically significant when the corresponding FDR values are smaller than 0.05, as calculated using moderated t-statistics and multiple-testing corrections. 21
Small Network Assembly for Integrated mRNA-miRNA Analysis
We assembled small regulatory networks around the significantly differentially expressed miRNAs where possible. We used TarBase as the source of high-confidence miRNA targets, 28 and took advantage of the recently established property that mRNA-miRNA interactions are weakly dependent upon the tissue context. 35 mRNA differential expression values were assigned to the gene nodes in the networks. This choice was supported by two observations. First, even if miRNAs operate functionally at the protein level, their effects at the mRNA levels are highly representative. 36 Second, the identification of mRNA and protein differential expression as a consequence of miRNA changes is expected to be more relevant at the 24 and 48 hours postexposure time points considered in our integrated mRNA-miRNA analysis than at the earlier time points (see above).
Results and Discussion
To investigate dose-effects over different post-exposure times, the organotypic bronchial epithelial tissue cultures were exposed for 7, 14, 21, or 28 minutes to 15% (vol/vol dilution with air) mainstream CS (corresponding to different doses) with five post-exposure times (0.5, 2, 4, 24, and 48 hours) for each of the doses (Table 1). The systems biology approach applied for the mechanistic investigation of CS effects was based on mRNA and miRNA expression data, and on computational data analysis and interpretation using an integrated mRNA-miRNA analysis. This included small network assembly and the two complementary approaches for gene expression: (i) GSEA and (ii) RCR networks and AP-clustering.
Gsea
To identify the main general biological processes perturbed in AIR-100 tissue culture after CS exposure from the data set of differentially expressed genes, GSEA was performed with entire contrasts (computed for the treatment effect, independent of the dose) using a collection of gene sets representative of canonical pathways (from the MSigDB collection).23,37 Briefly, this commonly used approach enabled the identification of a significant enrichment of coordinated co-regulated genes representative of biological processes (within full gene expression profiles). Focusing on the CS effect, independent of the exposure dose, enabled us to elucidate processes that were regulated over post-exposure times, as shown in Figure 1. This revealed a significant enrichment of genes involved in the oxidative stress response, which was rapidly induced at early post-exposure times (2 and 4 hours). Part of the stress response was repressed at later post-exposure time points (24 and 48 hours), whereas a sustained enrichment of genes involved in processes characteristic of detoxification (eg, metabolism of xenobiotics - metabolism by cytochrome P450) and antioxidant systems (eg, glutathione metabolism) was seen. Genes involved in the machinery for mRNA processing and translation were rapidly upregulated and coordinately induced after CS exposure. Interestingly, gene sets associated with processes leading to mRNA translation and newly synthesized proteins were sequentially enriched over post-exposure times (eg, mRNA capping, elongation, splicing, translation, and protein export). At later post-exposure times, GSEA revealed a consistent enrichment of genes encoding proteins of the mitochondrial electron respiratory chain (at 24 and 48 hours) as well as of energy metabolism (eg, amino acids, pyruvate, and lipids). Strikingly, gene sets representative of interferon and NF-kB signaling pathways were significantly enriched in the downregulated gene profiles associated with early (2 and 4 hours) and late (24 and 48 hours) post-exposure times. The analysis also captured a late, yet coordinated, induction of genes involved in cell proliferation at 24 hours post-exposure. This observation could be linked to the induction of energy metabolism highlighted after 24 and 48 hours post-exposure.

GSEA revealed specific patterns of biological processes modulated over post-exposure times in AIR-100 tissue culture exposed to whole CS. Gene sets with significant NESs for at least one post-exposure time (2, 4, 24, or 48 hours) and known biological functions were grouped together. A heat map was generated to highlight NES patterns over post-exposure time. Red color indicates the enrichment of gene sets at the top of the ranked gene list (upregulated genes), and green color indicates enrichment of gene sets at the bottom of the ranked gene list (downregulated genes). The color scale is proportional to NES values. Values in bold correspond to NES with associated FDR <0.05.
RcR Analysis
To follow up on the GSEA results and obtain a more granular, tissue-specific mechanistic understanding of the molecular effect of CS in a dose- and time-dependent manner, we applied a recently developed method that uses computable network models in combination with the RCR approach. 24 This method is based on tissue-specific biological causal network models built to represent different biological processes, such as cell proliferation, 26 cellular stress, 25 and inflammatory processes, 27 in the context of the lung. RCR integrates large-scale transcriptomic data into biological meaning by identifying higher level upstream controllers of specific gene expression. These HYPs can be mapped as functional nodes on specific cellular networks, enabling comparisons of molecular perturbations with signaling pathways and other response mechanisms across diverse doses and post-exposure time points both qualitatively and quantitatively.38,39
RCR analysis was performed using differential gene expression (CS exposure vs. sham exposure) derived from AIR-100 tissue cultures exposed to whole smoke for 14 minutes (low dose) or 28 minutes (high dose) followed by five post-exposure times (0.5, 2, 4, 24, and 48 hours). The 7-and 21-minute exposure times were not considered for RCR because they were found to have insufficient differentially expressed genes to perform RCR (Supplementary Table 1A). By applying a distinct significance criterion (ie, concordance <0.05), 671 HYPs were identified that showed significant changes in at least one exposure condition (Supplementary Table 1B). Of these, 244 (37%) could be mapped to one or several of the following three different network models: 126 were related to the cellular stress response network model, 54 to inflammatory process subnetworks related to the lung epithelium (ie, epithelial barrier defense and epithelial cell proinflammatory signaling), and 130 to the cell proliferation network model (Supplementary Table 1C).
To gain insights into the time- and dose-dependent activation or repression of HYPs and potential co-regulations, a clustering approach (APcluster) was applied to the minus log-transformed P-value concordance associated with the 244 identified HYPs across 10 different exposure conditions. Seventeen different communities of similarly regulated HYPs were identified. Figure 2 shows the clustering with the assignment of the single HYPs to the three different network models (cellular stress, cell proliferation, and inflammatory processes). There was no clear correlation of distinct communities with a single network, suggesting that different cellular processes show, at least in part, similar time- and dose-dependent regulations by CS exposure. The interconnection of the different networks is also obvious from the fact that certain HYPs, such as the transcriptional activity of the activating protein (AP)-1 complex (“taof(AP-1 complex Hs)”), belong to all three networks.
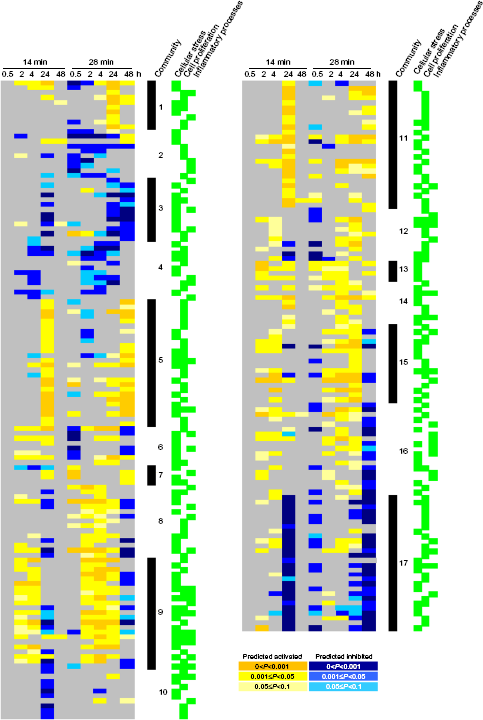
AP clusters using the minus log-transformed P-value of concordance from 244 HYPs with at least one significant concordance (P < 0.05) across the two different exposure conditions (14 and 28 minutes) and the five different post-exposure time points (0.5, 2, 4, 24, and 48 hours). All of these HYPs (indicated by a green box) belong to at least one of the three networks (cellular stress, cell proliferation, and inflammatory processes). In all, 17 different communities of similarly regulated HYPs are shown. Color code: yellow, HYPs with predicted increase in abundance or activity; blue, HYPs with predicted decrease in abundance or activity; light yellow/blue, 0.05≤P<0.1; yellow/blue, 0.001≤P<0.05; dark yellow/blue, P < 0.001; and gray, no significant changes. For more details, see Supplementary Table 1B.
Two major effects are notable. First, an overall dose-and time-dependent response was detected. At the low dose (14 minutes of exposure), no significant HYPs were detected at 0.5 hours post-exposure and only three were detected at 48 hours post-exposure, whereas a stronger response was observed at 2, 4, and 24 hours post-exposure. Thus, at the low dose, an almost complete recovery of the cellular system occurred within 48 hours post-exposure. By contrast, at the high dose (28 minutes of exposure), a much stronger response was already observed 0.5 hours post-exposure (76 significant HYPs), and a sustained perturbation of the system was reflected by a large number of significant HYPs at 2, 4, 24, and even 48 hours post-exposure. A qualitatively similar response was observed at 2 and 4 hours post-exposure for both doses with a clear trend toward a stronger response with the high dose. Second, cluster analysis revealed a strong similarity between 24 hours post-exposure at the low dose and 48 hours post-exposure at the high dose. This suggests that similar cellular processes are active at both doses and that the differences in dose response mainly reflect the kinetics of the cellular response.
Cellular Stress Response
Most HYPs related to the cellular stress network showed a transient activation with recovery after 24 hours post-exposure for the low dose and after 48 hours postexposure for the high dose (Fig. 3A). Detailed investigations of subnetworks and related HYPs revealed a strong activation of the oxidative stress response that was also identified by GSEA analysis. This activation could be deduced from the prediction of HYPs that are directly related to corresponding biological processes, such as “ROS” and “oxidized low-density lipoprotein”, and HYPs that are related to substances known to induce oxidative stress, such as “acrolein”, “hypochlorous acid”, and “ozone”. Interestingly, the HYP for acrolein, a CS constituent, was downregulated at 24 hours post-exposure for the low dose and at 48 hours post-exposure for the high dose, indicating a recovery from oxidative stress in the system.
Direct analysis of the oxidative stress subnetwork model through mapping the identified HYPs to the respective nodes in the network (Fig. 3B and Supplementary Fig. 1A for a higher resolution view) elucidated potential cellular pathways involved in the oxidative stress response. For instance, nuclear factor (erythroid-derived 2)-like 2 (NFE2L2) is the central transcription factor that mediates the oxidative stress response both in vitro and in vivo when induced by CS.13,40,41 As shown in Figure 3A, NFE2L2 abundance (“NFE2L2”) and activity (“taof(NFE2L2)”) HYPs were predicted to be activated in the NFE2L2_signaling subnetwork, whereas HYPs for “KEAP1” and “Bachl”, which are proteins known to counteract NFE2L2 activity,7,42 were predicted to be inhibited (for details, see specific NFE2L2_signaling subnetwork, Supplementary Fig. 1B). Additionally, activity of AP-1, another transcription factor known to be activated by oxidative stress,41,43 was identified by the activation of related HYPs such as “taof(Jun)”, “taof(AP-1 complex Hs)”, and several mitogen-activated protein kinases (MAPKs), eg, such as extracellular signal-regulated kinase (ERK)1 (“kaof(MAPK3)”) and ERK2 (“kaof(MAPK1)”), which are upstream of AP-1 in cellular signal transduction cascades induced by oxidative stress. These results are in accordance with the activation of pro-proliferative ERK1/2 signaling, and pro-apoptotic MAP kinase p38 and c-Jun N-terminal kinase previously detected by phospho-specific Western blotting in CS condensate-treated submerged bronchial epithelial cells. 44

(A) selection of predicted HYPs within the cellular stress network. ROS, reactive oxygen species; taof(X), transcriptional activity of X; and kaof(X), kinase activity of X. For detailed information, see supplementary Table 1B. (B) High magnification of a schematic representation of perturbations observed in part of the oxidative stress subnetwork. On the upper part of each significant HYP, an eight-folder cassette (shown in light green) depicts the color code for significance of concordance for all post-exposure kinetics (0.5, 2, 4, 24, and 48 hours) after 14 minutes of exposure (top five squares) and after 28 minutes of exposure (bottom five squares). Circle head arrow, inhibition; arrow edge, activation; and gray line, co-regulation. For a high-resolution image of the subnetwork, see supplementary figure 1color code: yellow, HYPS with predicted increase in abundance or activity; blue, HYPS with predicted decrease in abundance or activity; light yellow/blue, 0.05≤P<0.1; yellow/blue, 0.001<P<0.05; dark yellow/blue, P< 0.001; and gray, no significant changes.
Other cellular stress responses were identified from the prediction of related HYPs by RCR. Increased activity of HYPs related to protein damage, such as “response to heat”, which covers the induction of specific heat shock genes; “response to endoplasmic reticulum stress”, including activation of related transcription factors activating transcription factor (“ATF6”) and X-box binding protein 1 (“taof(XBP1)”); and “response to osmotic stress”, which could be observed as early as 2-4 hours after exposure.
Another cellular stress response known to be induced by CS and also identified by GSEA analysis is related to xenobiotic metabolism. 45 The prediction of HYPs for “taof(AHR)”, “2,3,7, 8-tetrachlorodibenzodioxin”, or “benzopyrene” pointed to the activation of the aryl hydrocarbon receptor, the key transcription factor that mediates the induction of phase I enzymes, such as Cyp1A1. 46 A more detailed description of the evaluation of xenobiotic metabolism subnetwork has been provided elsewhere. 47 In general, the cellular stress response followed a dose-dependent, transient kinetic response with a stronger and more persistent activation at the high dose; however, on a qualitative level, the responses for both doses were very similar in terms of perturbed biological processes (eg, activating the NFE2L2 pathway to combat oxidative stress, Fig. 3A). Overall, the results indicate a comprehensive, highly regulated cellular stress response to CS exposure, which involves different cellular defense pathways.
Inflammatory Processes
In human lung tissue, epithelial cells mediate an initial inflammatory response by actively secreting specific cytokines that recruit and activate inflammatory cells, such as neutrophils or macrophages, 48 or by the release of damage-associated molecular pattern molecules from necrotic cells.49,50 The analysis of significant HYPs that are part of the three subnetworks related to inflammatory response in epithelial tissue revealed distinct perturbations of the main intracellular signal mediator pathways (Fig. 4). In accordance with the GSEA results, inhibition of the interferon (IFN) γ- and NF-κB-mediated inflammatory responses was visible as the downregulation of related HYPs such as “IFNG” and “taof(RELA)” (Fig. 4). The observed transient inhibition of the NF-κB/IFNγ response has previously been described in response to aqueous extracts of CS, 51 oxidants in general, 52 and acrolein, 53 which is a major a, α,β-unsaturated, highly reactive aldehyde present in CS; this, therefore, links the process of NF-KB inhibition to the oxidative stress response.

Selection of predicted HYPs within the inflammatory process subnetworks. Color code: yellow, HYPs with predicted increase in abundance or activity; blue, HYPs with predicted decrease in abundance or activity; light yellow/blue, 0.05≤P<0.1; yellow/blue, 0.001 ≤P<0.05; dark yellow/ blue, P< 0.001; and gray, no significant changes. taof(X), transcriptional activity of X and kaof(X), kinase activity of X. For detailed information, see Supplementary Table 1B.
We also observed inhibition of the activity of the transcription factors CCAAT/enhancer-binding protein beta (“taof(CEBPB)”) and signal transducer and activator of transcription 3 (“taof(STAT3)”), which are known to be involved in the inflammatory response. Interestingly, a clear dose-dependent proinflammatory response related to increased cytokine abundance was also predicted (eg, interleukin (IL), “IL1A”, “IL1B”, “IL6”, “IL13”, and “IL24”). Again, this response was mostly reversed at 48 hours post-exposure for the low dose but remained elevated over time for the high dose with respect to several cytokines such as IL2, IL6, and IL13. Allahverdian et al previously reported that IL13 secretion by airway epithelial cells enhanced epithelial repair via heparin binding EGF-like growth factor (HB-EGF), 54 and potential NF-KB- independent inflammatory pathways have been suggested to operate through the transcription factors AP-1 55 and/or early growth response protein-1 (EGR-1) 56 ; the activity of both of these transcription factors was predicted in our networks.
Proliferation-Related Response
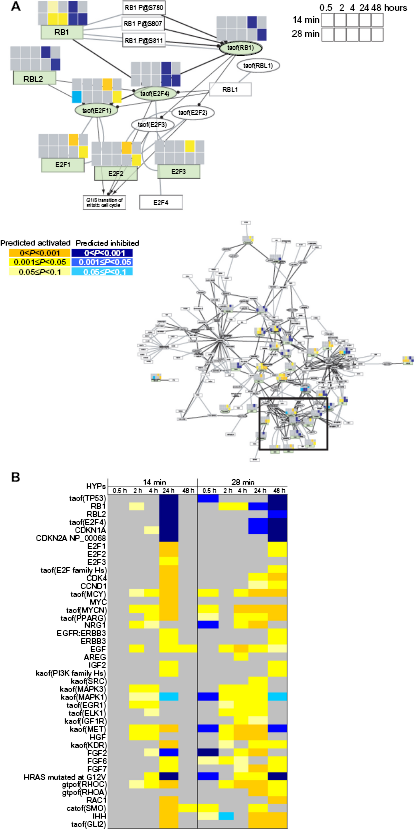
In mapping significant HYPs to the proliferation network, we observed a distinct perturbation of the core proliferation subnetwork (ie, cell cycle subnetwork; Fig. 5A and Supplementary Fig. 1C for a higher resolution view). In particular, a coordinated down-regulation of HYPs related to cell cycle inhibitors and activation of HYPs for cell cycle inducers was predicted by RCR at 24 hours post-exposure time for the low dose (Fig. 5B). This response fully recovered at 48 hours post-exposure. HYPs describing proteins and/or biological processes that are down-regulated in proliferating cells such as “taof(p53)”, “RB1”, “taof(E2F4)”, and “CDKN1A” were clustered in community 17, whereas those describing increased protein abundance or upregulated transcriptional activation involved in cell proliferation, eg, “E2F1”, “E2F2”, “E2F3”, “CDK4”, “CCND1”, and “taof(Myc)”, were mainly clustered in community 11 (Figs. 2 and 5B, and Supplementary Table 1C).
(
Because CS is known to induce growth factor-related cellular pathways, 57 we examined a specific subnetwork of the cell proliferation network related to growth factor response more closely (Fig. 6 and Supplementary Fig. 1D for a higher resolution view). Nodes related to the EGF receptor (EGFR) family (eg, “NRG1”, “EGFR:ERBB3”, and “ERBB3”), and related ligands for EGFR activation (eg, “EGF” and “AREG”) were markedly upregulated. Moreover, EGFR ligands (HBEGF, EREG, and AREG) were strongly and dose-dependently induced at the gene expression level by CS exposure (Supplementary Table 1D). Accordingly, HYPs related to downstream cellular pathways, such as RAS (“HRAS mutated at G12V”), phosphatidylinositol 3-kinase (“kaof(PI3K Family Hs)”), and MAPK (“kaof(MAPK3)” and “kaof(MAPK1)”),as well as downstream transcription factors (“taof(ELK1)” and “taof(EGR1)”) were also upregulated (Fig. 5B). Additionally, we observed HYPs for increased hepatocyte growth factor (“HGF”) abundance and increased activity of the related receptor (“kaof(MET)”), pointing to an alternative pathway that may lead to lung cell proliferation. Indeed, Sakamaki et al. 58 previously reported increased Hgf and Met expression preceding the regenerative proliferation of lung epithelial cells in mice after pneumonectomy.

High magnification of a schematic representation of perturbations observed in part of the growth factor response subnetwork. On the upper part of each significant HYP, an eight-folder cassette (shown in light green) depicts the color code for significance of concordance for all postexposure kinetics (0.5, 2, 4, 24, and 48 hours) after 14 minutes of exposure (top five squares) and after 28 minutes of exposure (bottom five squares). Color code: yellow, HYPs with predicted increase in abundance or activity; blue, HYPs with predicted decrease in abundance or activity; light yellow/ blue, 0.05≤P<0.1; yellow/blue, 0.001 ≤P<0.05; dark yellow/blue, P< 0.001; and gray, no significant changes. Circle head arrow, inhibition; arrow edge, activation; and gray line, co-regulation. For high-resolution images of the subnetwork, see Supplementary Figure 1.
A pathway related to fibroblast growth factors (“FGF2”, “FGF6”, and “FGF7”) was also identified, pointing to the involvement of these growth factors in the regeneration of AIR-100 tissue. 59 Additionally, HYPs for mediators of cell migration and tissue differentiation were strongly upregulated (eg, “gtpof(RHOC)”, “IHH”, and “taof(GLI2)”). For the high dose, a similar response was observed at 24 hours post-exposure. In contrast to the low dose, perturbation of the proliferation network persisted for at least 48 hours.
CS Effect on the Regulation of Mucus Synthesis in Organotypic Bronchial Tissue Cultures
Mucins are major constituents of airway mucus and, therefore, essential for the defense against and clearance of inhaled irritants and toxicants. Excessive mucin overproduction is a distinguishing feature and a risk factor of chronic obstructive pulmonary disease.60,61 Mucins have been reported to be expressed in airway epithelial cell cultures,62,63 and CS enhances mucin secretion both in vitro64,65 and in rat airways. Therefore, we investigated the expression of mucin genes in CS-exposed bronchial epithelial tissue cultures. Six membrane-bound (MUC1, MUC4, MUC13, MUC15, MUC16, and MUC20) and two gel-forming mucins (MUC5AC and MUC5B) were differentially regulated in CS-exposed AIR-100 tissue cultures (Supplementary Table 1D). Most of these were down-regulated in CS-exposed tissues compared with sham. For instance, MUC5B mRNA, specifically expressed in goblet cells, 63 was only downregulated at 24 hours post-exposure with the longer exposure time, thus corresponding to the observed initial decrease in the proportion of mature goblet cells (data not shown). MUC5AC mRNA, previously shown to be upregulated upon CS exposure both in vitro and in vivo,65–69 was increased at the later post-exposure time in both 14 and 28 minutes CS-exposed tissue cultures. Interestingly, we also observed the upregulation of the gene expression of different positive regulators of MUC5AC, 70 such as SPDEF and the EGFR ligands AREG, EREG, and HBEGF (Supplementary Table 1D). CS-enhanced MUC5AC expression was shown to be mediated by EGFR signaling and required ERK1/2 and p38 activation in rats,65,66,69 which agrees with the predicted ERK1/2 activation (Fig. 3A) in the present study.
CS-Induced miRNA Differential Expression
We identified 11 miRNAs that were differentially expressed following CS exposure (more details are given in Supplementary Fig. 2). Except for hsa-miR-675, all miRNAs were down-regulated, which is in agreement with in vivo findings 71 and as discussed in our previous article. 21 Regarding the sensitivity of our approach, the linear model used for the integrated mRNA-miRNA analysis is not appropriate to capture the dose-dependent modulation of the response to CS exposure, as it is done in the mRNA-only part of the analysis using a more precise model. This does not mean that this effect is absent at the single miRNA level, but rather that the three replicates per condition are not sufficient to stabilize the signal variance because of the inherently higher variability of the miRNA versus mRNA data. It is also worth mentioning that the dose-dependent modulation of the response to CS exposure was not observed at the single gene, but at the gene-group level, eg, HYPs or gene sets.
Construction of Small Regulatory Networks
Two small regulatory networks containing 7 of the 11 differentially expressed miRNAs were assembled. Where possible, experimentally high-confidence causal relationships were used to construct the regulatory networks following the same approach adopted during the assembly of the network models used in RCR analysis. Therefore, downstream miRNA targets were extracted from TarBase, 28 whereas upstream transcription miRNA factors were found in TransmiR. 72 In both cases, a relevant structure with negative feedback loops was obtained, confirming the importance of the identified miRNAs in the regulatory mechanisms involved after CS exposure. These findings based on miRNA analysis from the same RNA samples used for gene expression analysis provide important complementary details about the regulatory mechanisms of biological processes, also identified as being perturbed by the mRNA-based evaluation.
The inhibition of NF-KB found in our previous analysis with GSEA or RCR approaches was further supported by the expression of hsa-miR-146a and has-miR-146b, which are connected to NF-KB in an auto-regulatory feedback loop. 73 The small network model (Fig. 7A) depicts NF-KB as a transcription factor for both hsa-miR-146a and b, which both repress IL1 receptor-associated kinase (IRAK1), itself an activator of NF-KB. As shown in Figure 7A, the differential expression of hsa-miR-146a/b is negative at 24 and 48 hours post-exposure, which matches the significant downregulation of the NF-KB transcript. The positive differential expression of IRAK1 at the same time points is consistent with a weaker effect of hsa-miR-146a/b (de-repression). The connection closing the loop between IRAK1 and NF-KB is not satisfied (at the transcript level), indicating that the feedback mechanisms bringing NF-KB expression back to unperturbed levels may not yet be fully effective and that longer post-exposure times may be needed for complete reversibility of the NF-KB response. It should also be noted that when testing the signed relationships in a negative feedback loop against experimental values, one edge will necessarily be unsatisfied. This does not invalidate the network but rather indicates which mechanisms are dominant at the time point of the measurement. Taken together, these findings demonstrate the importance of hsa-miR-146a/b in regulating inflammatory mechanisms. 74
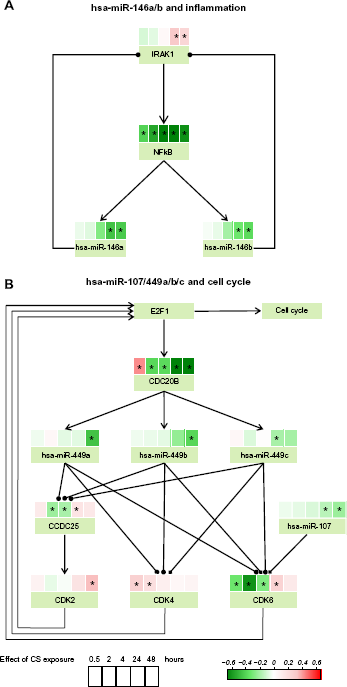
Small regulatory networks containing the differentially expressed miRNAs hsa-miR-146a/b (panel A) and hsa-miR-107/hsa-miR-449a/b/c (panel B). Each node contains a heat map displaying the differential expressions (coefficient βg of the linear model) and their statistical significance (FDR <0.05, indicated by an asterisk (*)) for the five post-exposure times (0.5, 2, 4, 24, 48 hours). The signed edges are indicated in the same way as in the other figures: –| represents activation and – inhibition. The early time points 0.5, 2, and 4 hours were still included to show the complete response although they were not used to select relevant miRNAs.
Transient activation of the cell cycle was identified by RCR analysis of the proliferation network perturbation. In line with this observation, a second small network model depicting a possible feedback loop involving the downregulated E2F1- inhibiting miRNA hsa-miR-107/hsa-miR-449a/b/c (Fig. 7B and the heat map in Supplementary Fig. 2A) was generated. A similar negative feedback mechanism involving upregulated miR449a/b and CDC20B induced by E2F1 expression, and finally limiting E2F1 levels and excessive E2F1-driven proliferation was previously proposed by Lize et al. 75 The apparently concomitant transcription of CDC20B, hsa-miR-449a/b/c, and the minor strand hsa-miR-449b-3p (not shown on the network because it is a dead end) is clearly visible in the significant negative differential expression observed at 24- and 48-hour time points (Fig. 7B). This response is fully consistent with the positive differential expression of CDK2/4/6 and CCDC25, all positively acting on E2F1 to promote the cell cycle. These observations include hsa-miR-107, which was also shown to intervene in the cell cycle regulation via the direct repression of CDK6.76–78 Examination of the full feedback loop contained in the small network revealed that the edge E2F1–-CDC20B is not satisfied at the late time points because E2F1 is predicted to be positively activated using RCR (see Fig. 5B). This shows that the origin of the negative differential expression of the CDC20B transcript (later followed by its intronic miRNAs, hsa-miR-449a/b/c and hsa-miR-449b-3p) is not a late response but an early event, taking place in the first two hours following CS exposure. Our RCR results show that E2F1 activity was not responsive in the early response; thus, additional investigations are necessary to explain the early behavior of CDC20B expression.
Alternative Evaluation of the miRNA-mRNA Relationship
For three remaining miRNAs (hsa-miR-342-3p/375/ 675-5p) that could not be integrated into high-confidence regulatory networks because of a lack of evidence of causal relationships, we used a correlative approach to evaluate their relationship with observed mRNA changes and their potential role in exposure-related biological responses.
For hsa-miR-375, TarBase provided a large quantity (>100) of moderately reliable targets obtained in a micro-array experiment. We used a global approach to show that the downregulation of hsa-miR-375 induced a statistically significant anti-correlation effect on its (direct and indirect) downstream targets, 72 as expected for miRNAs that are expression repressors. This result (shown in the histograms of Supplementary Fig. 2B) indicated that the repressive effect of hsa-miR-375 is present at 24 hours post-exposure (two-sided Kolmogorov-Smirnov test P-value = 6.87 X 10⁻⁶) and disappears at 48 hours (P-value = 0.488). However, the overlap of the distributions of the true targets (red curves in Supplementary Fig. 2B) and random genes (black curves) was too large (~85%) to enable reliable enrichment calculations to be performed, which would have helped in the assigning of functional categories to the subset of anti-correlated target genes.
For hsa-miR-342-3p/675-5p, we relied on isolated literature statements to try to link their differential expression to their target genes. For instance, hsa miR-342-3p was shown to target DNA methyltransferase 1 (DNMT1) and, thereby, inhibits cell proliferation in colorectal cancer cells. 79 The differential expression values of DNMT1 were consistent with a potential de-repression by the miRNA (βg 0 with FDR values <0.05 for both 24 and 48 hours post-exposure). Because it was the only positively differentially expressed miRNA, hsa-miR-675-5p is an interesting case (also because βdg was the only statistically significant case). Moreover, it was recently shown to target the tumor suppressor runt-related transcription factor 1 (RUNX1). 80 The observed differential expression values of RUNX1 in the present study agrees with this relationship (βg < 0 with FDR values <0.05 for 24 hours post-exposure; the signal vanishes at 48 hours). The negative differential expression values of this tumor suppressor are consistent with the activation of the cell cycle observed at the late 24 and 48 hours time points, which was already supported by other miRNAs such as the miR-449 family and miR-107 family. Thus, differential expression of miRNAs can still be linked to identifiable effects on their downstream target mRNAs using a less-specific correlative approach when causal relationships are not available.
Summary and Conclusion
In line with the new paradigm shift in the toxicological assessment strategy advising the use of advanced tools and technologies,3,81 and with the need to find alternatives to animal testing, 82 the effect of acute CS exposure was investigated in the present study using (i) a relevant human organotypic bronchial epithelial model that has been previously shown to closely mimic the biological response in the bronchial epithelium of smokers 21 ; (ii) a whole smoke in vitro exposure system (Vitrocell® system); (iii) a systems toxicology approach based on classical toxicological parameters and the capture of complementary molecular endpoints such as mRNA and miRNA expression, after various exposure times/doses and at different post-exposure times; and (iv) a computational analysis approach combining complementary methods for transcriptomics data interpretation (GSEA 23 and RCR 24 ) and an integrated mRNA/miRNA evaluation.
During recent years, we have developed a network-based approach to mechanistically evaluate the biological impact of various exposures in experimental models. 1 This approach is based on building different biological causal network models relevant to biological processes, such as cell proliferation, 26 cellular stress, 25 and inflammatory processes, 27 in the lung. By applying RCR to identify HYPs or upstream regulators, the vast transcriptomics data generated in this study were interpreted, and signaling perturbations across various doses and post-exposure time points were compared. Our systems biology approach provided an insight into the different cellular responses triggered over time after CS exposure and demonstrated that they were dependent on the CS dose applied.
We believe that the toxicological method applied here in the assessment of CS exposure effect is the first step to a more advanced approach that will allow: (i) the quantification of the biological effect by measuring specific network perturbation amplitudes and the overall biological impact of an exposure using recently developed algorithms,38,39 (ii) the mechanistic representation of critical toxicological effects that span over different layers of biological organization (from the initiating molecular events toward the adverse outcome), and (iii) the integration of information derived from proteomics and miRNA analysis into the networks.
Another consideration that should be investigated in the future is the assessment of chronic exposure effect and the use of tissue inserts derived from different donors. These two challenging aspects are necessary to better understand the long-term effect of CS exposure and the possibility to leverage these observations to a population level.
To conclude, the combination of an in vitro model, leveraging human organotypic bronchial epithelial tissue culture, and an in vitro ALI exposure model allows for the biochemical analysis of distinct, well-regulated, dose- and time-dependent perturbations to cellular stress responses, inflammatory processes, and cell proliferation. This model and the used system biology approaches have the potential to unravel the underlying molecular mechanisms activated following CS exposure and can be viewed as a paradigm for a systems toxicology approach in “21st Century Toxicology”.2–4
Author Contributions
Conceived and designed the experiments: DW, CM, SW, JH, MCP. Analyzed the data: CM, SG, CP, VB, DW, AH, AS, SA. Wrote the first draft of the manuscript: SG, CM. Contributed to the writing of the manuscript: CP, VB, AS, DW, AH. Agreed with manuscript results and conclusions: all authors. Developed the structure and arguments for the paper: CM, SG, CP, DW, AS, VB. All authors reviewed and approved the final manuscript.
Footnotes
Acknowledgments
The authors thank Lynda Conroy-Schneider for expert editorial support; Marja Talikka, Walter Schlage, and Yang Xiang for helpful discussions and support during the manuscript preparation/revision; and Patrice Leroy for statistical support. They also acknowledge Horst Weiler, Christina Berger, Marek Franitza, Torsten Wilms, Jessica Buechel, Sigrid Lufen, Marco Hebestreit, and Birgit Kurkowsky (all from Philip Morris Research Laboratories) for their skilled technical assistance.